After you install an ARMS agent, the Overview tab on the application details page displays real-time performance data: request volume, error counts, response duration, instance count, and CPU utilization. Use this page to assess application health at a glance and identify performance bottlenecks across your deployment environments.
Prerequisites
An ARMS agent is installed for your application.
Application Monitoring provides a new application details page for users who have enabled the new billing mode. If you have not enabled the new billing mode, click Switch to New Version on the Application List page to access the new application details page.
Access the application overview
Log on to the ARMS console. In the left-side navigation pane, choose Application Monitoring > Application List.
On the Application List page, select a region in the top navigation bar and click the application name.
NoteIcons in the Language column indicate the programming language of each application:
 : Java
 : Go
: Go : Python
Hyphen (-): application monitored in Managed Service for OpenTelemetry
Click the Overview tab.
Summary cards
Four cards at the top show high-level metrics for the selected time range. Each card includes a Day On Day percentage that compares the current value against the same time range on the previous day.
| Card | Description |
|---|---|
| Requests | Total number of requests. |
| Number of errors | Total number of errors. |
| Average Duration | Average response time across all requests. |
| Number of instances | Total number of running instances. |
Trend charts
| Chart | Visualization | Description |
|---|---|---|
| Requests | Stacked column chart | Request volume over time, broken down by call type. |
| Errors | Column chart with trend line | Error count on the left y-axis, error rate on the right y-axis. |
| Duration | Trend chart | Response duration over time. Available metrics: average, P99, P90, and P75. |
Percentile metrics (P99, P90, P75) are disabled by default. To display percentile data, enable percentile statistics on the Custom Configurations page. For more information, see Customize settings for a Java application.
Peak CPU usage
A honeycomb chart shows peak CPU utilization across hosts or instances during the selected time range. Dashboard data and CPU metrics vary depending on how the application is deployed and whether the environment is monitored in Managed Service for Prometheus.
If the application runs in an ACK cluster monitored in Managed Service for Prometheus, the dashboard displays Prometheus data. For setup instructions, see Monitor an ACK cluster.
If the ACK cluster is not monitored in Managed Service for Prometheus, make sure the ARMS agent version is 4.1.0 or later. The dashboard then displays Application Monitoring data. For agent versions, see Release notes of the ARMS agent for Java.
The following table describes how the honeycomb chart behaves by deployment type:
| Deployment type | Honeycomb display | Color thresholds |
|---|---|---|
| ECS | Each cell represents a host. | Green: normal. Yellow: exceeds 60%. Red: exceeds 70%. |
| ACK (monitored in Managed Service for Prometheus) | CPU utilization at the application level. If the application spans multiple ACK clusters, the chart displays data from the first cluster that reports data. | — |
| Kubernetes (custom data collection) | CPU utilization at the application level. | — |
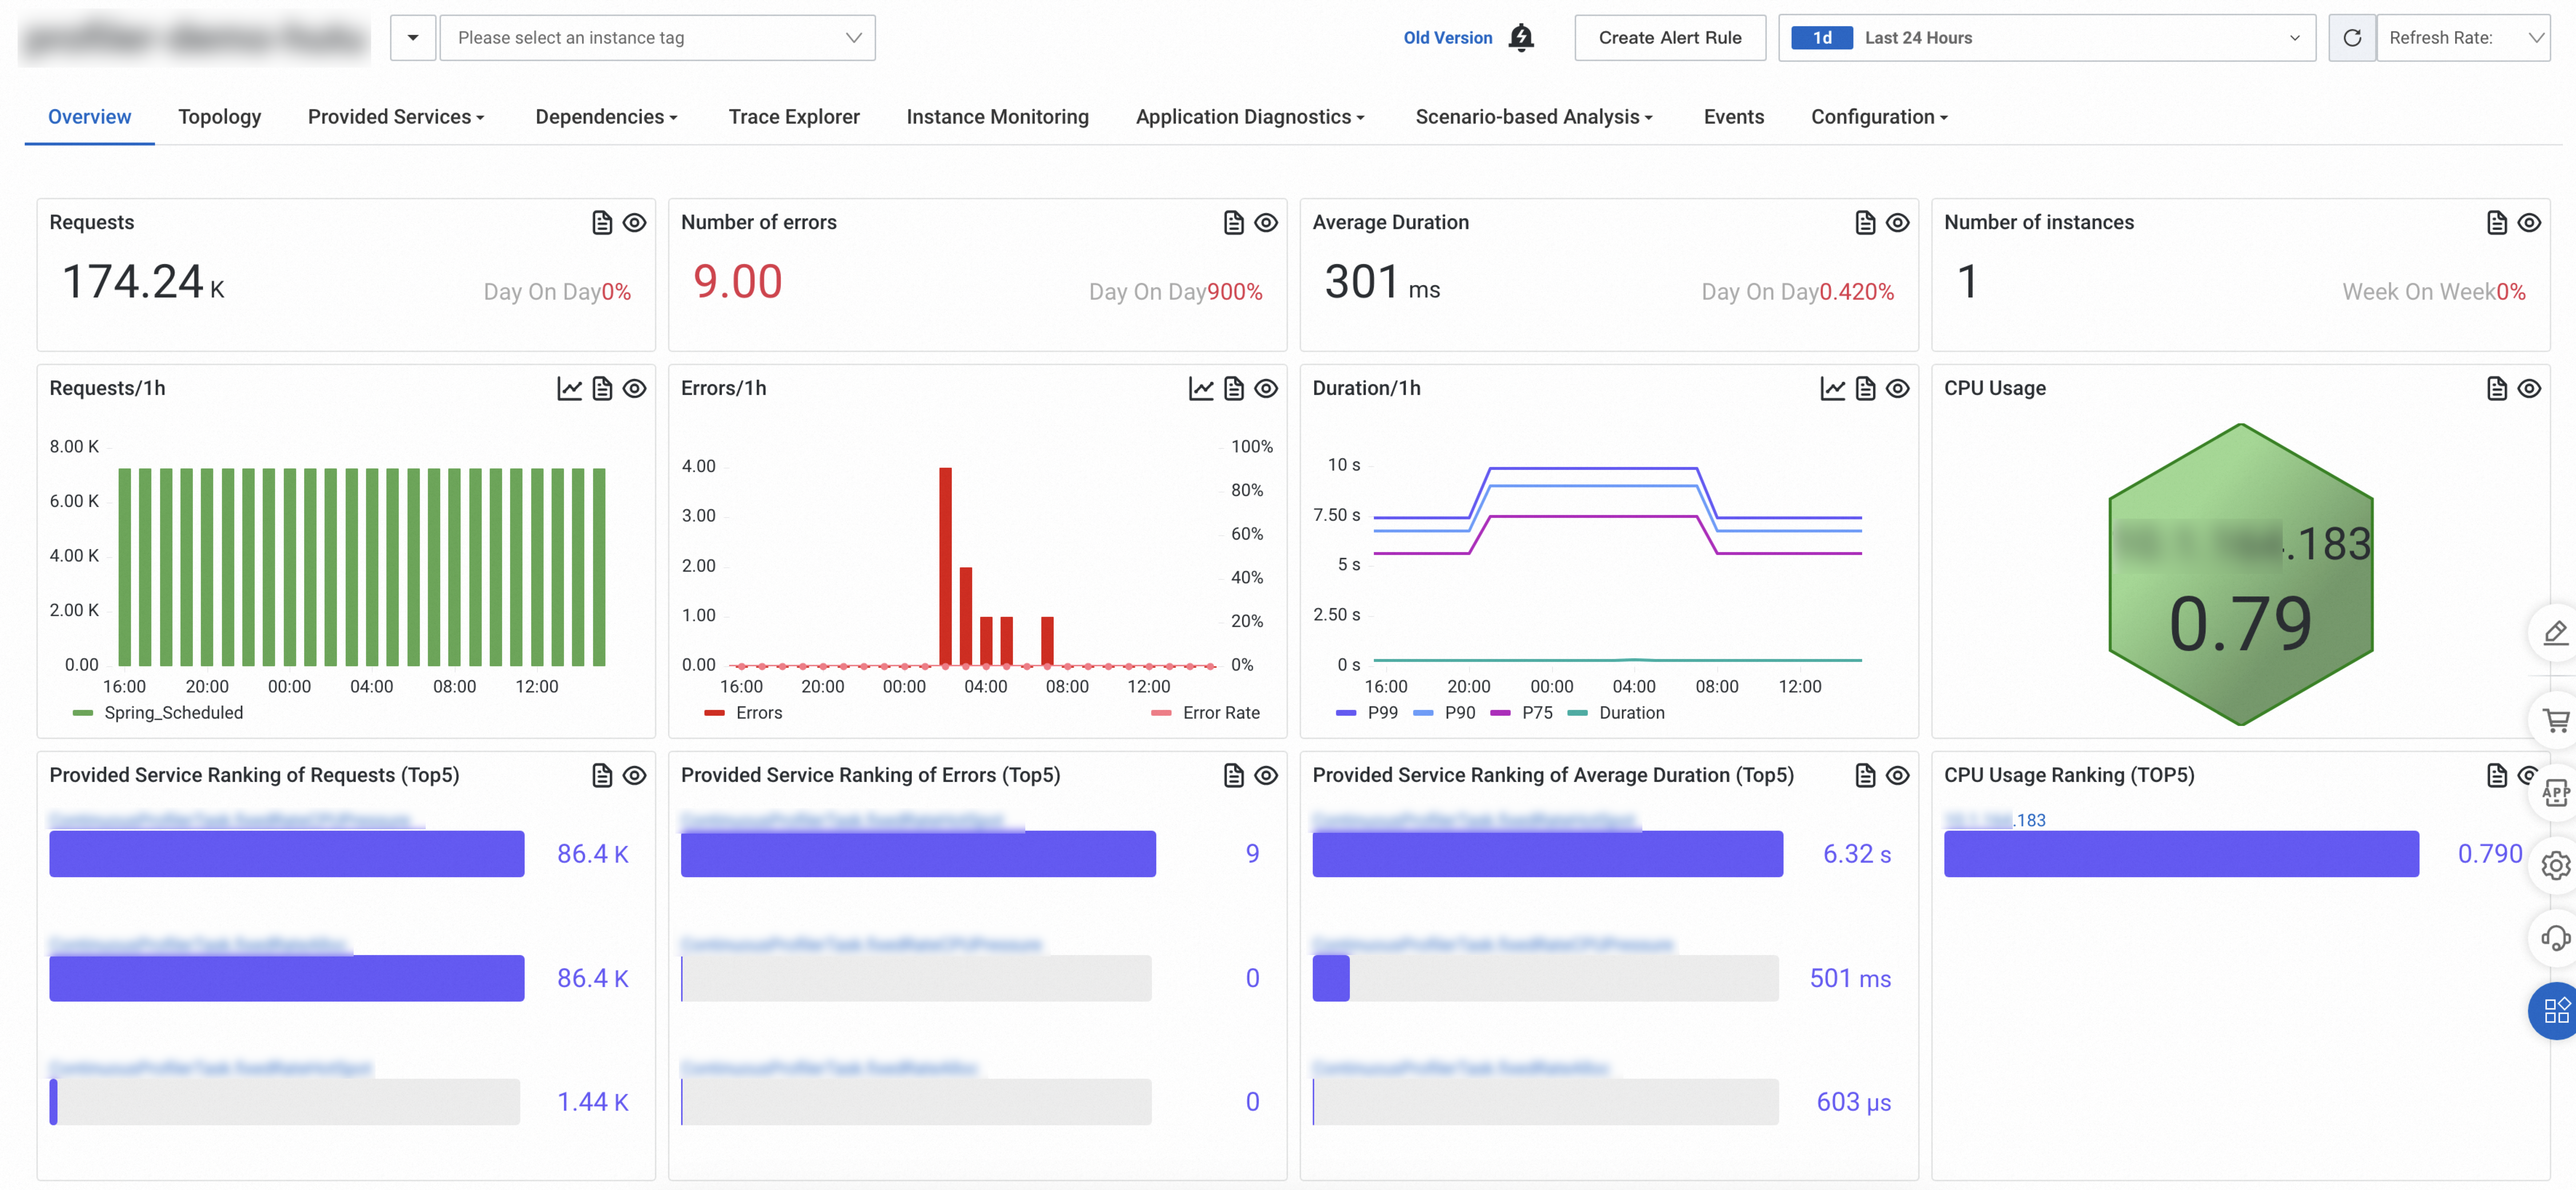
Service rankings
Three Top 5 lists rank the services provided by the application:
| Ranking | Sorted by |
|---|---|
| Provided Service Ranking of Requests | Highest request volume |
| Provided Service Ranking of Errors | Highest error count |
| Provided Service Ranking of Average Duration | Longest average response duration |
Rankings cover the following call types: HTTP, Dubbo, HSF, DSF, user_method, MQ, Kafka, Server, Producer, gRPC, Thrift, Sofa, Schedulerx, Spring_Scheduled, JDK_Timer, XXL_Job, and Quartz.
Peak CPU usage instance ranking
A Top 5 list shows the hosts or application instances with the highest CPU utilization during the selected time range.
| Deployment type | Ranked by |
|---|---|
| ECS | Hosts with the highest CPU utilization. |
| ACK (monitored in Managed Service for Prometheus) | Application instances with the highest CPU utilization. If the application spans multiple clusters, the ranking displays data from the first cluster that reports data. |
| Kubernetes (custom data collection) | Application instances with the highest CPU utilization. |
Compare data by group or time
Click ![]() above a trend chart to open the comparison panel.
above a trend chart to open the comparison panel.
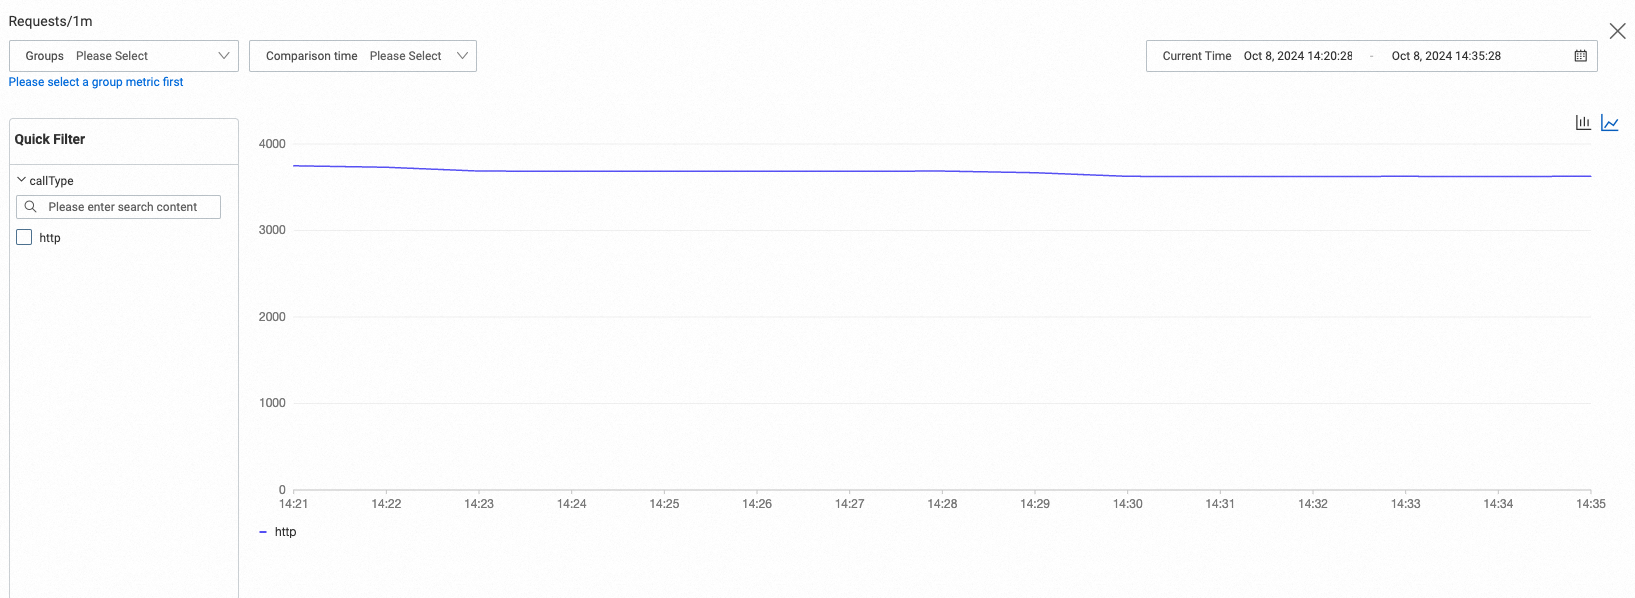
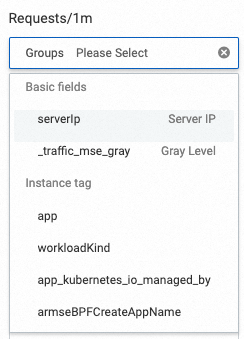
Comparison by group: Select Groups to compare data across different dimensions.
Basic fields: Tags shared by all metrics. Use this option to compare data by server IP address.
Instance tag: Default and custom instance tags for more granular comparisons. To add custom tags, see Add and use tags.
Comparison by time: Specify a time range to compare current data against a previous period.
View PromQL statements
Click ![]() above any section to view the underlying Prometheus Query Language (PromQL) statements.
above any section to view the underlying Prometheus Query Language (PromQL) statements.
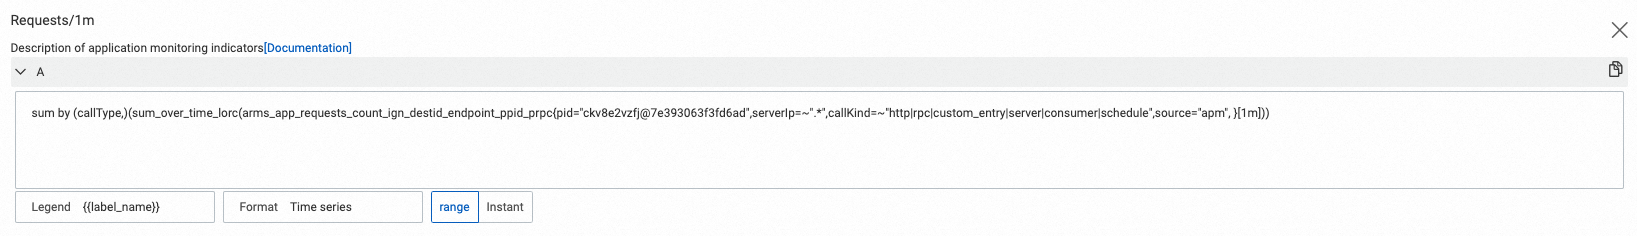
Use PromQL statements to:
Query metrics on the Metrics Explorer page in Managed Service for Prometheus.
Build custom dashboards in Managed Service for Grafana. To get started, integrate your data sources first.
FAQ
Why is 99th percentile data not displayed?
Percentile metrics are disabled by default. Enable percentile statistics on the Custom Configurations page. For more information, see Customize settings for a Java application.
Why does the request count on the old console Overview page not match the actual time range?
The old console includes data from one minute before the selected time range. For example, selecting a 5-minute range displays 6 minutes of data, and selecting 30 minutes displays 31 minutes.
Why does the slow SQL count from the POP API differ from the old console?
The POP API queries slow requests across databases supported by ARMS, NoSQL databases, and caches. The old console queries only databases supported by ARMS.
To align POP API results with the old console, add an rpcType filter to your query:
QueryMetricByPageRequest.Filters filters2 = QueryMetricByPageRequest
    .Filters
    .builder()
    .key("rpcType")
    .value("60|62|63|65|66|67|68|69|58|59")
    .build();
Why does the instance count exceed the number of running instances?
Long-running queries may include destroyed instances in the total count.
Why does the request count differ between the new and old consoles?
The new console includes scheduled task data. The old console does not.