Distributed traces generate large volumes of span data. Without sampling, storage and compute costs grow with traffic, while most traces represent normal, healthy requests. Application Real-Time Monitoring Service (ARMS) provides five sampling policies that let you keep the traces that matter -- errors, slow requests, low-traffic interfaces -- and discard the rest. This reduces cost while preserving the observability coverage you need for troubleshooting and performance analysis.
All sampling configuration changes take effect immediately. No application restart is required.
Terms
| Term | Definition |
|---|---|
| Span | A single operation within a request, such as an RPC call or an internal method invocation. |
| Root span | The first span in a trace. A root span has no parent. |
| Local root span | The first span of a trace within a single service. Each service in a distributed trace has its own local root span. |
| Span context | Metadata associated with a span, propagated across process boundaries. |
| Head-based sampling | A sampling decision made at the root span before the trace begins propagating. Head-based sampling guarantees complete traces: either all spans are sampled, or none are. |
| Non-head based sampling | Sampling that takes effect when head-based sampling is not triggered. Non-head based sampling may be triggered at any local root span, so trace completeness is not guaranteed. |
Choose a sampling policy
ARMS provides two head-based and three non-head based sampling policies. Head-based policies decide at the root span and guarantee complete, end-to-end traces. Non-head based policies decide at individual services and capture traces that head-based sampling might miss.
| Goal | Recommended policy | Category |
|---|---|---|
| Sample a fixed percentage of all traces | Fixed-rate sampling | Head-based |
| Balance coverage across all interfaces regardless of traffic volume | Adaptive sampling | Head-based |
| Guarantee at least one trace per interface per minute | Minimum sampling for all interfaces | Non-head based |
| Automatically capture error and slow-request traces | Sampling for failed or slow requests | Non-head based |
| Always sample specific interfaces by name | Custom sampling | Non-head based |
Multiple policies can be active simultaneously. ARMS evaluates them in a defined order. See Sampling decision flowchart.
Head-based sampling policies
Head-based sampling makes a single decision at the root span of a trace. If the trace is sampled, all downstream spans inherit the decision through the span context. This guarantees complete, end-to-end traces.
Fixed-rate sampling
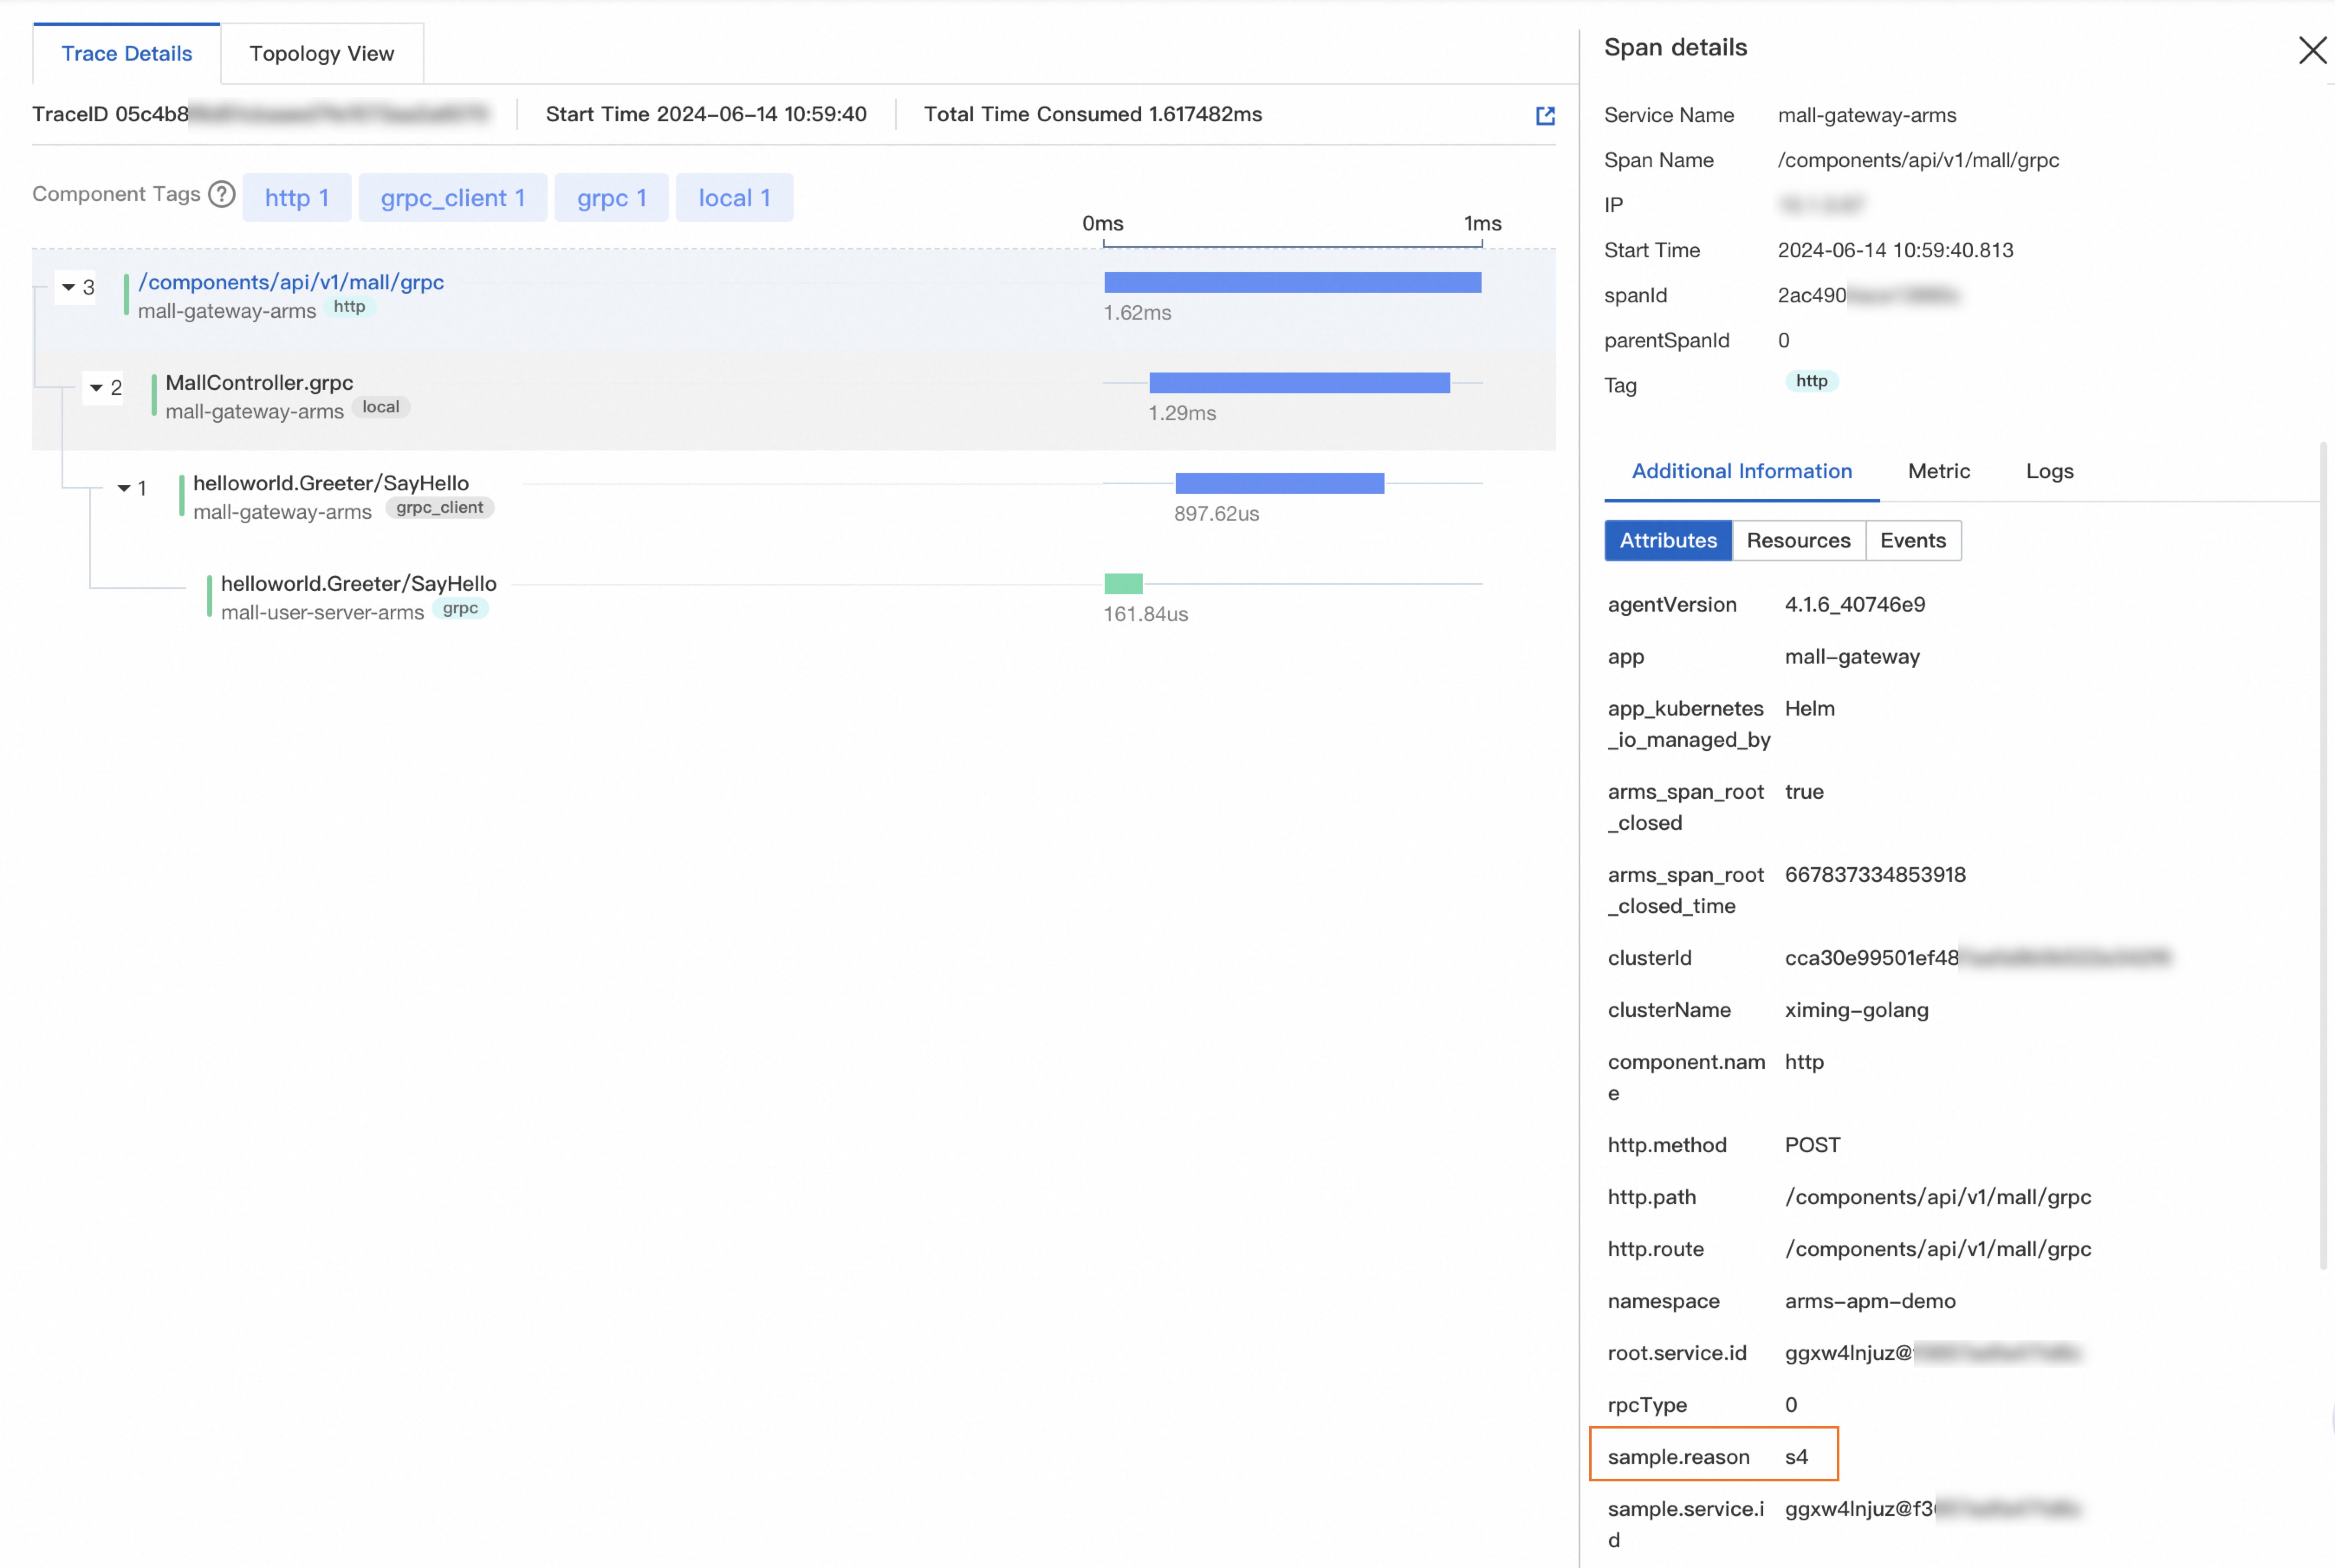
Fixed-rate sampling selects traces at a configured percentage at the ingress service. For example, a 10% sampling rate means roughly 1 in 10 traces is sampled.
Sampled spans carry the attribute sample.reason: s4.
Configure fixed-rate sampling
Log on to the ARMS console. In the left-side navigation pane, choose .
Select a region in the top navigation bar and click the application.
Note Icons in the Language column indicate the programming language: - : Java -
  : Go -
  : Python - - (Hyphen): an application monitored in Managed Service for OpenTelemetry
In the top navigation bar, choose .
In the Sampling Settings section, set Sampling strategy to Fixed sampling rate. In the Sample Rate Percentage field, enter a value. For example, enter
10for a 10% sampling rate.NoteThe default value is 10. A higher sampling rate consumes more system resources. Keep the default unless your workload requires broader trace coverage.
Click Save.
Adaptive sampling
High-traffic interfaces often dominate fixed-rate sampling results, while low-traffic but critical interfaces get underrepresented. Adaptive sampling solves this by allocating a fixed number of traces per interface, regardless of request volume.
How it works: ARMS identifies the 1,000 interfaces with the highest request volume and samples 10 traces per interface per minute using a Least Frequently Used (LFU) algorithm. All remaining interfaces share a combined budget of 10 traces per minute.
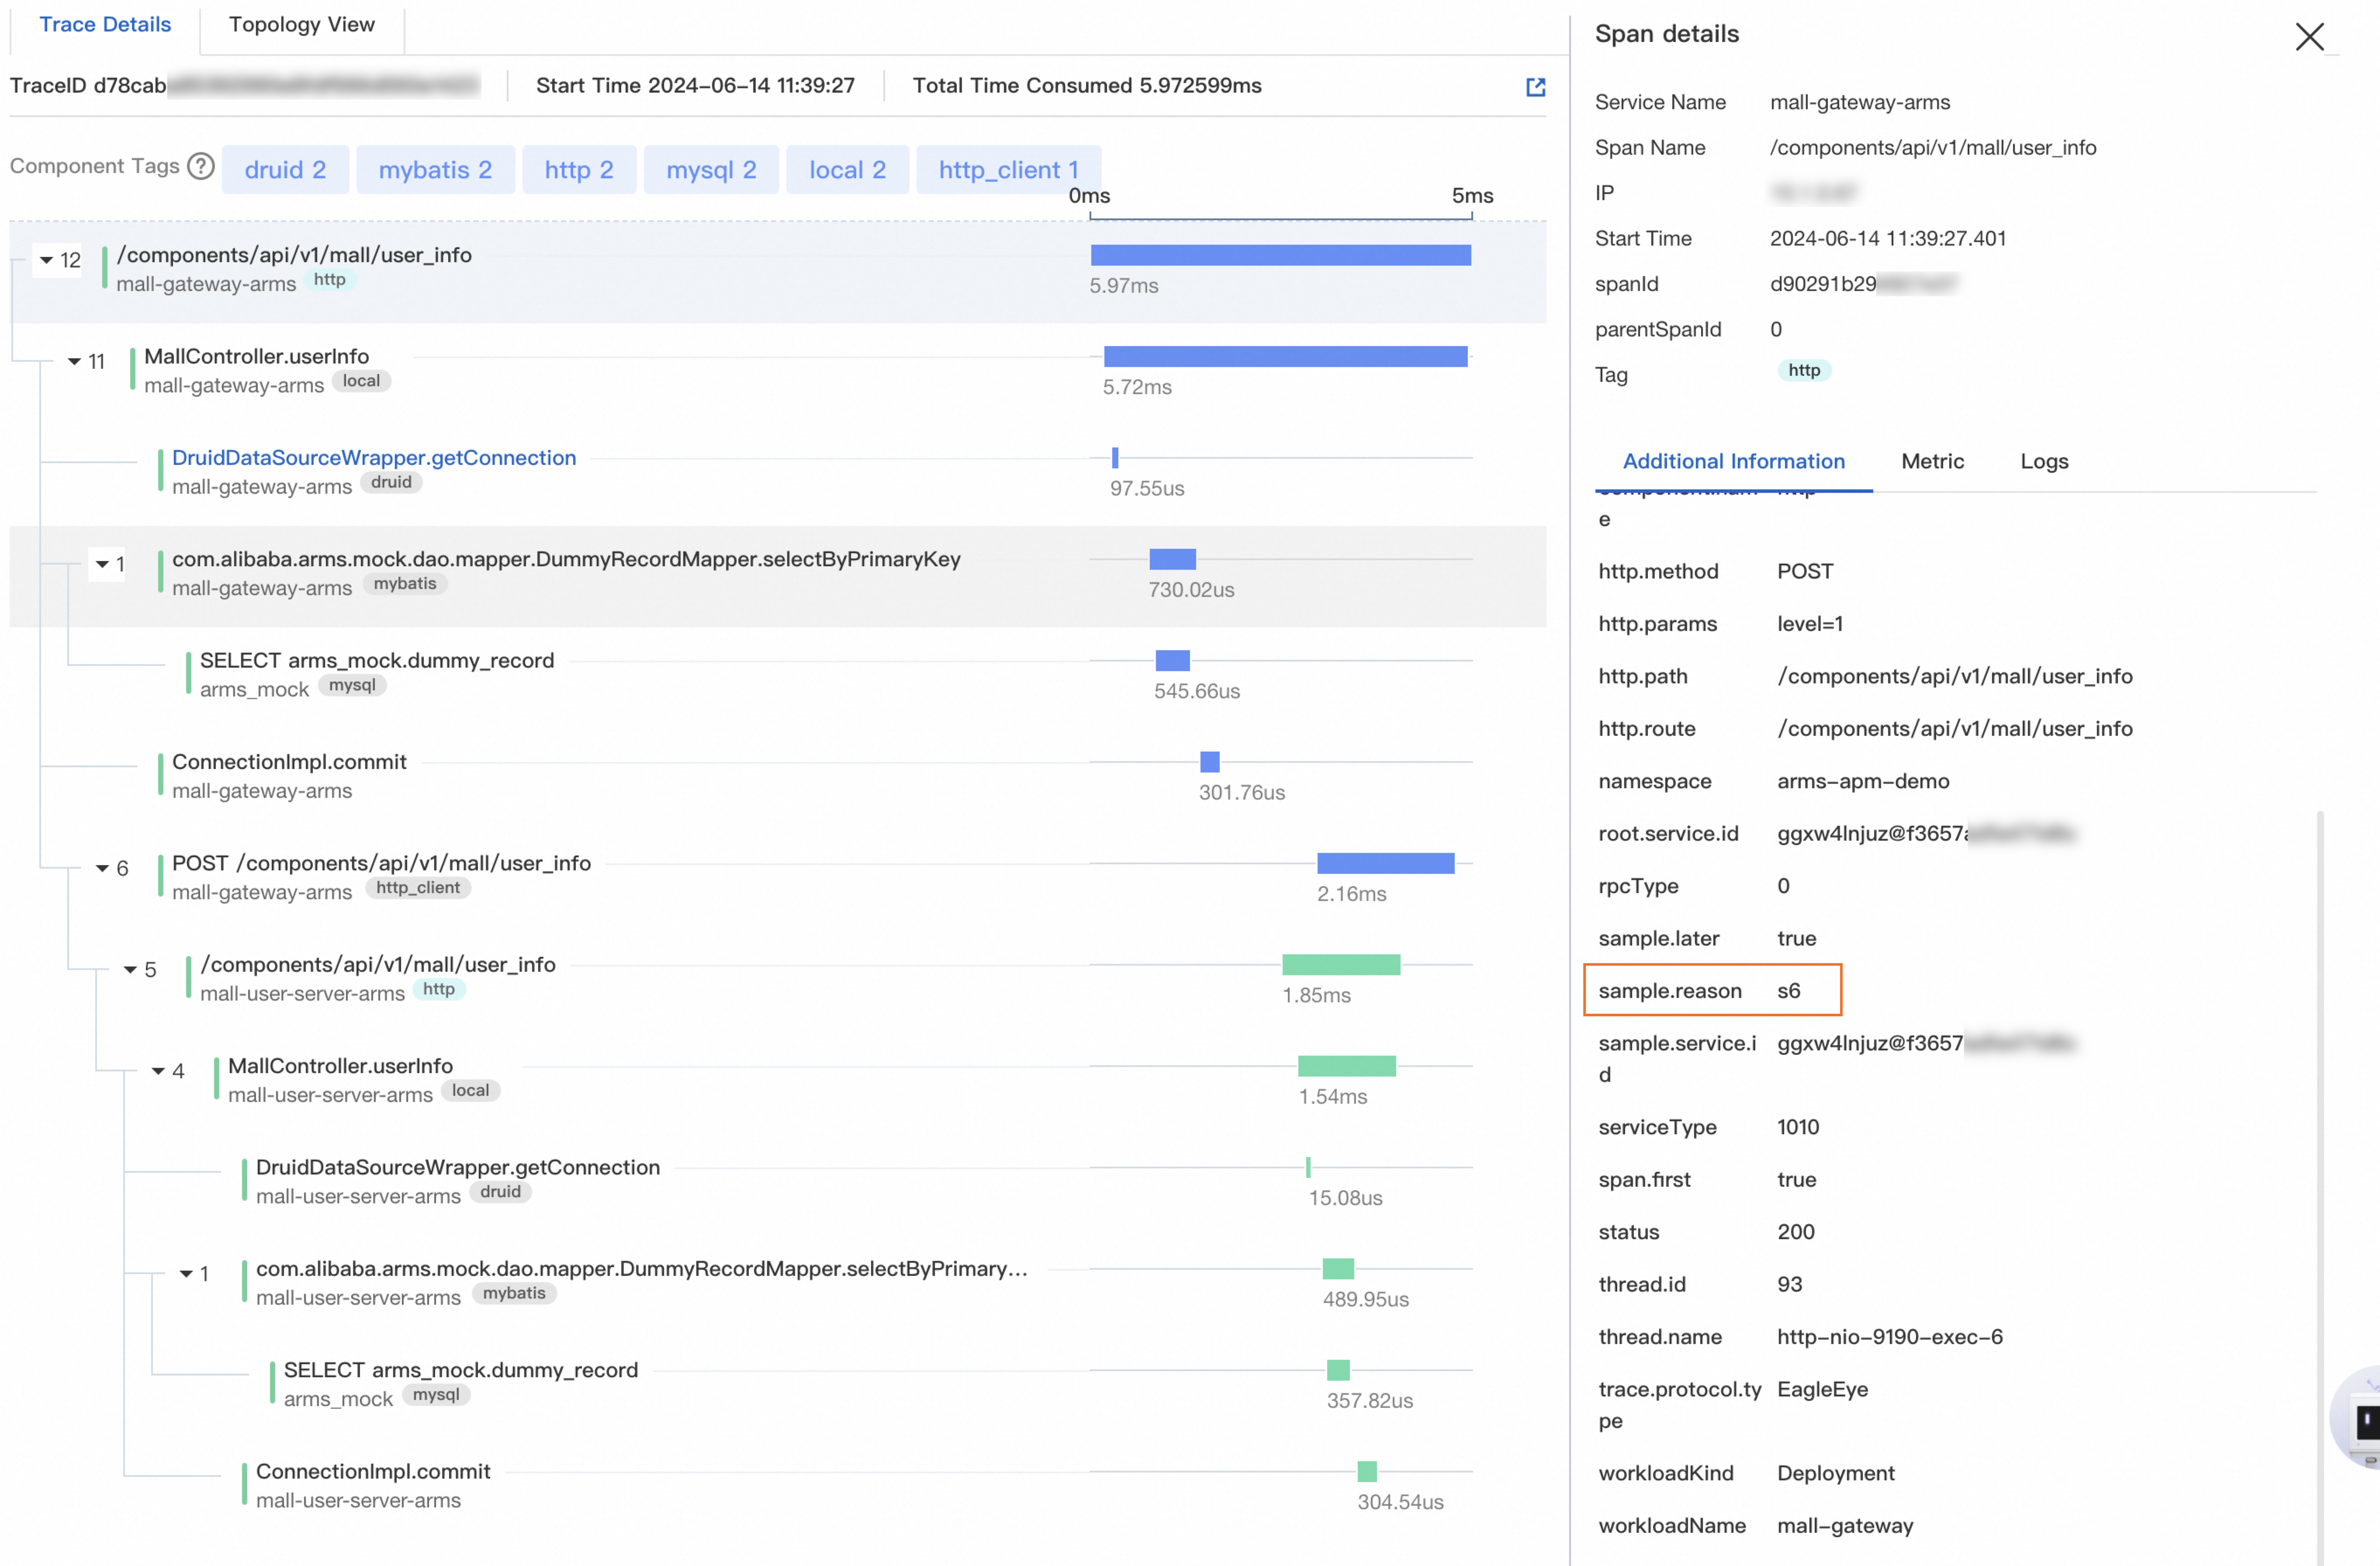
Example: Suppose your service has an interface /api/orders/list handling 50,000 requests per minute and another interface /api/orders/refund handling only 100 requests per minute. With adaptive sampling, both get 10 sampled traces per minute. You maintain visibility into the low-traffic refund flow without being overwhelmed by the high-traffic list flow.
Sampled spans carry the attribute sample.reason: s6.
Configure adaptive sampling
Log on to the ARMS console. In the left-side navigation pane, choose .
Select a region in the top navigation bar and click the application.
Note Icons in the Language column indicate the programming language: -: Java - : Go - : Python - - (Hyphen): an application monitored in Managed Service for OpenTelemetryIn the top navigation bar, choose .
In the Sampling Settings section, set Sampling strategy to Adaptive Sampling.
Click Save.
Non-head based sampling policies
Non-head based sampling triggers independently at each service when head-based sampling has not already selected the trace. Because the decision is made mid-trace rather than at the root, complete end-to-end traces are not guaranteed. However, these policies capture traces that head-based sampling might miss, such as errors, slow requests, and rarely invoked interfaces.
Minimum sampling for all interfaces
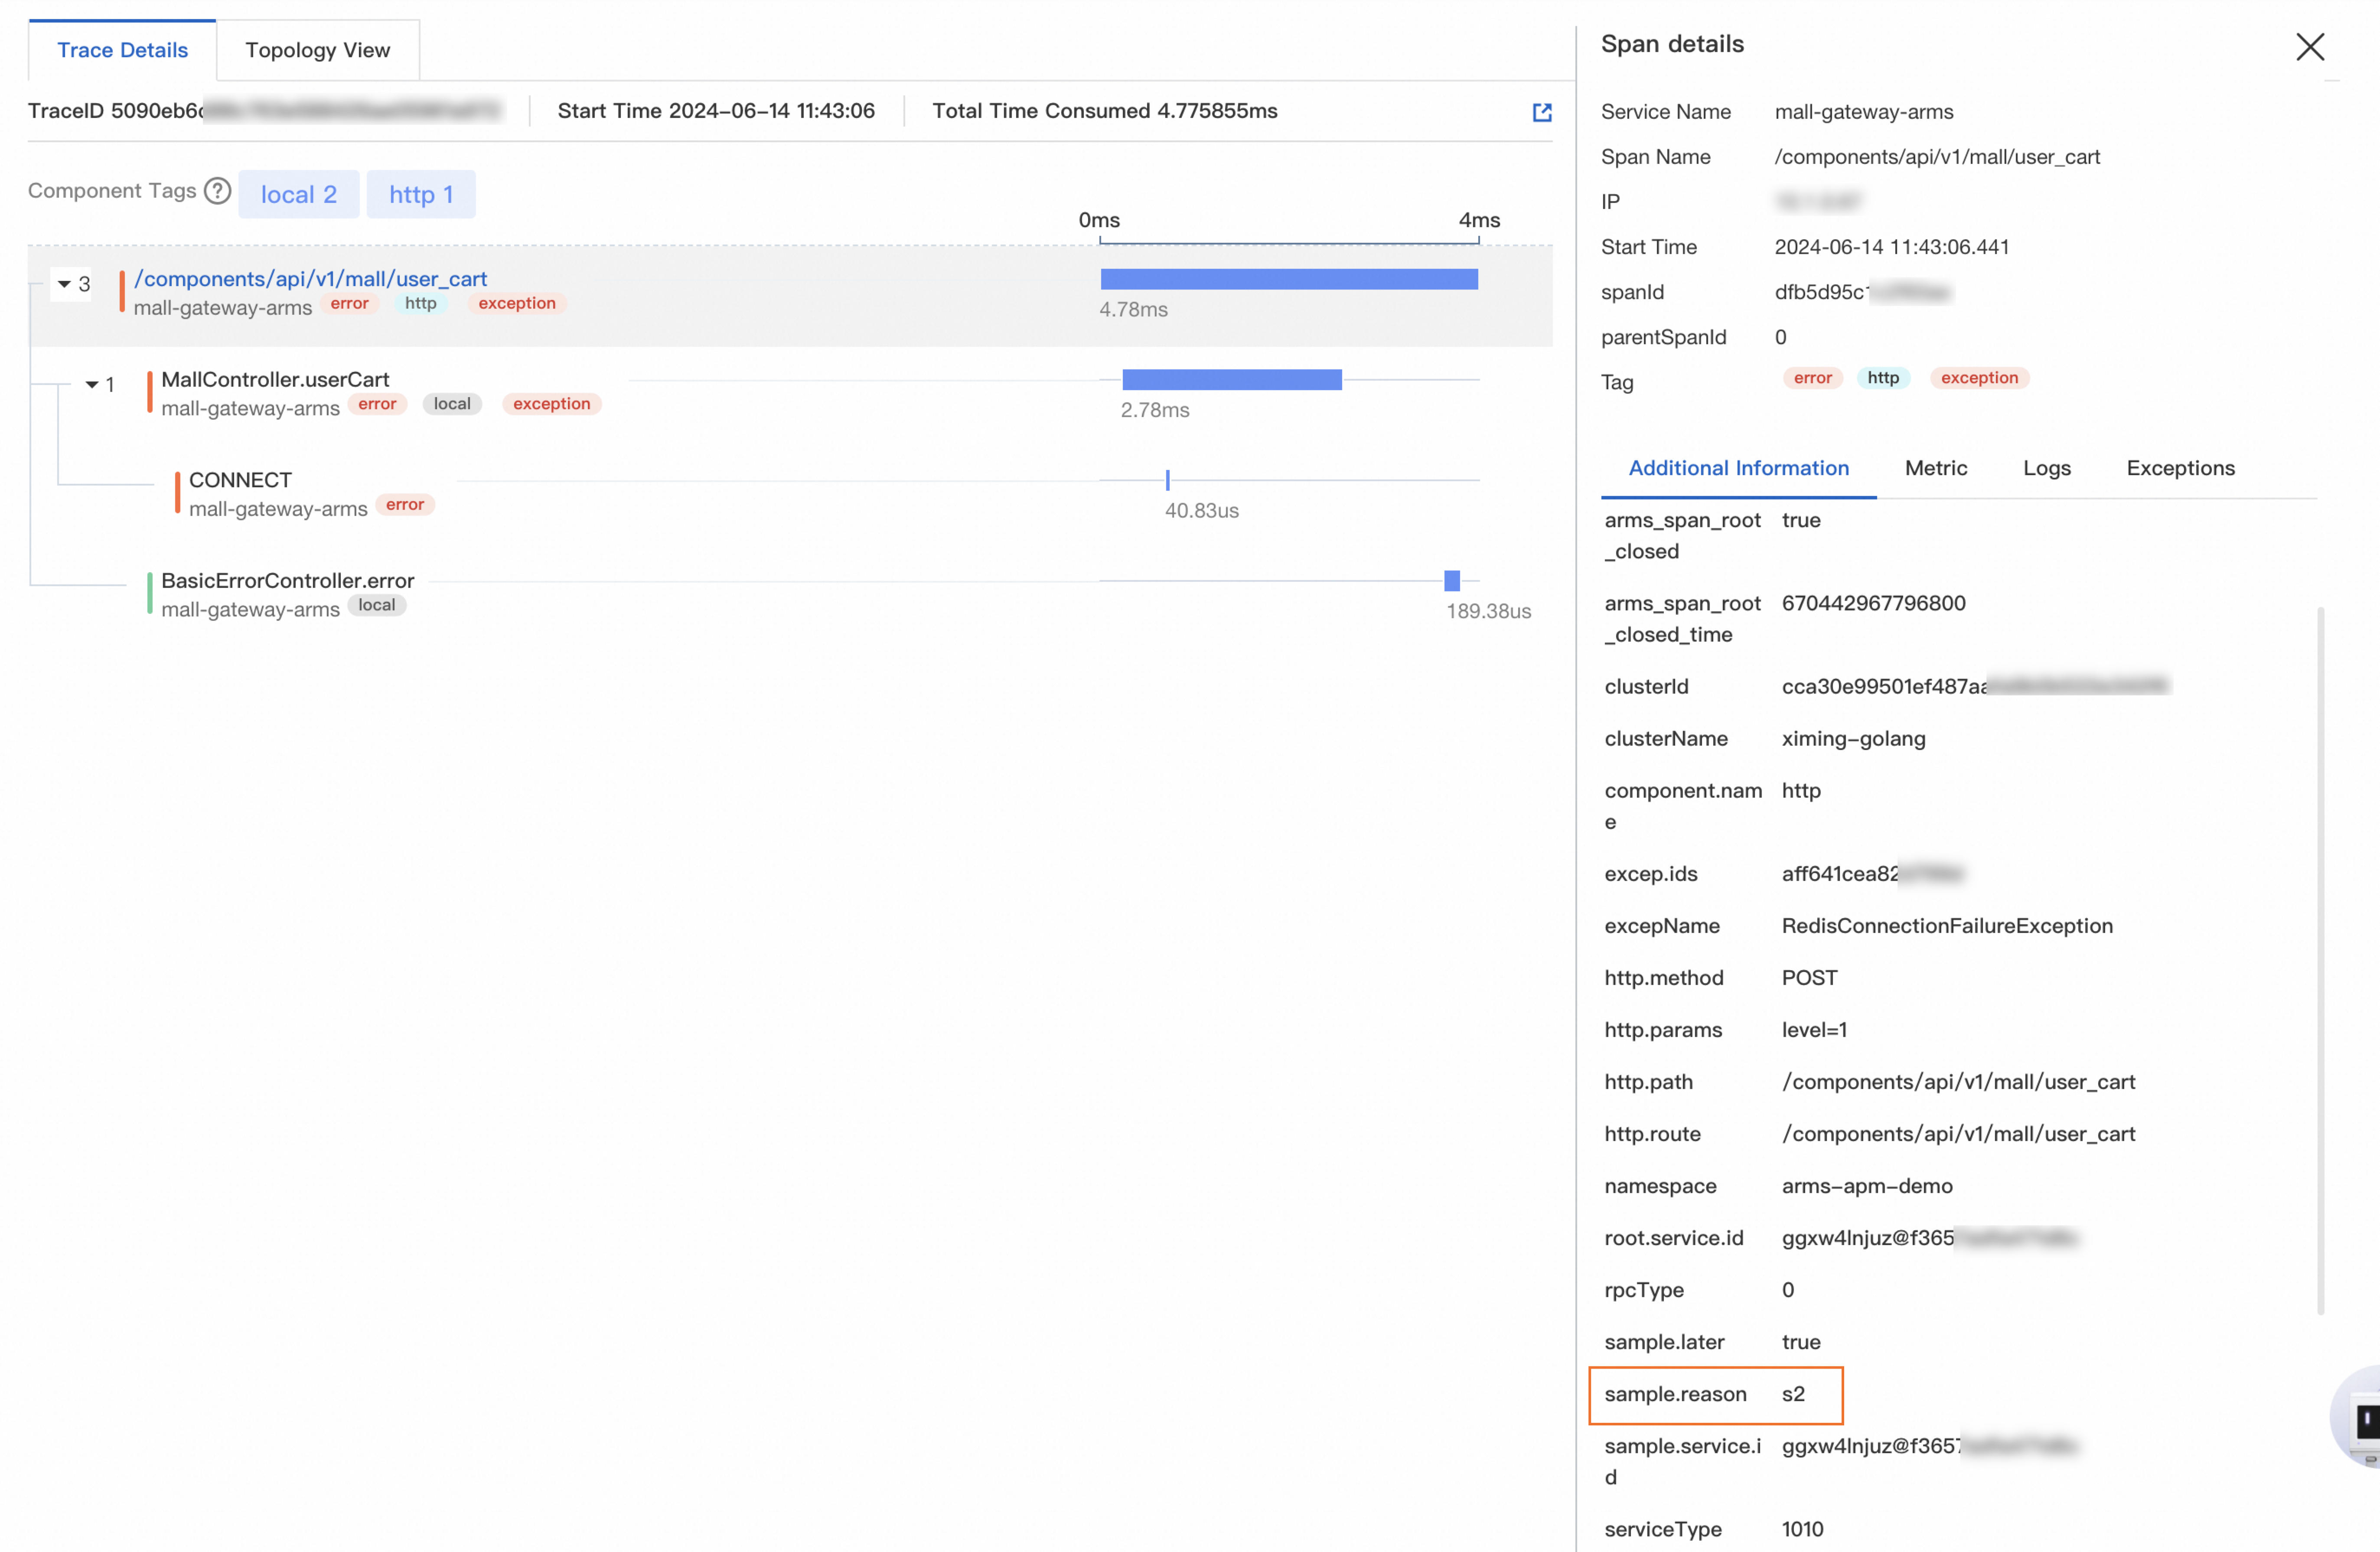
ARMS automatically samples at least one trace per interface per minute. This guarantees baseline visibility into every interface, including those with very low traffic that fixed-rate or adaptive sampling might skip entirely.
Sampled spans carry the attribute sample.reason: s2.
Sampling for failed or slow requests
This policy automatically captures traces for failed or slow requests, so you always have trace data for the calls that need investigation.
Before using this policy, verify that the Call chain compression switch is turned on. Go to the application details page, choose from the top navigation bar, and check the Advanced Settings section. The switch is on by default.
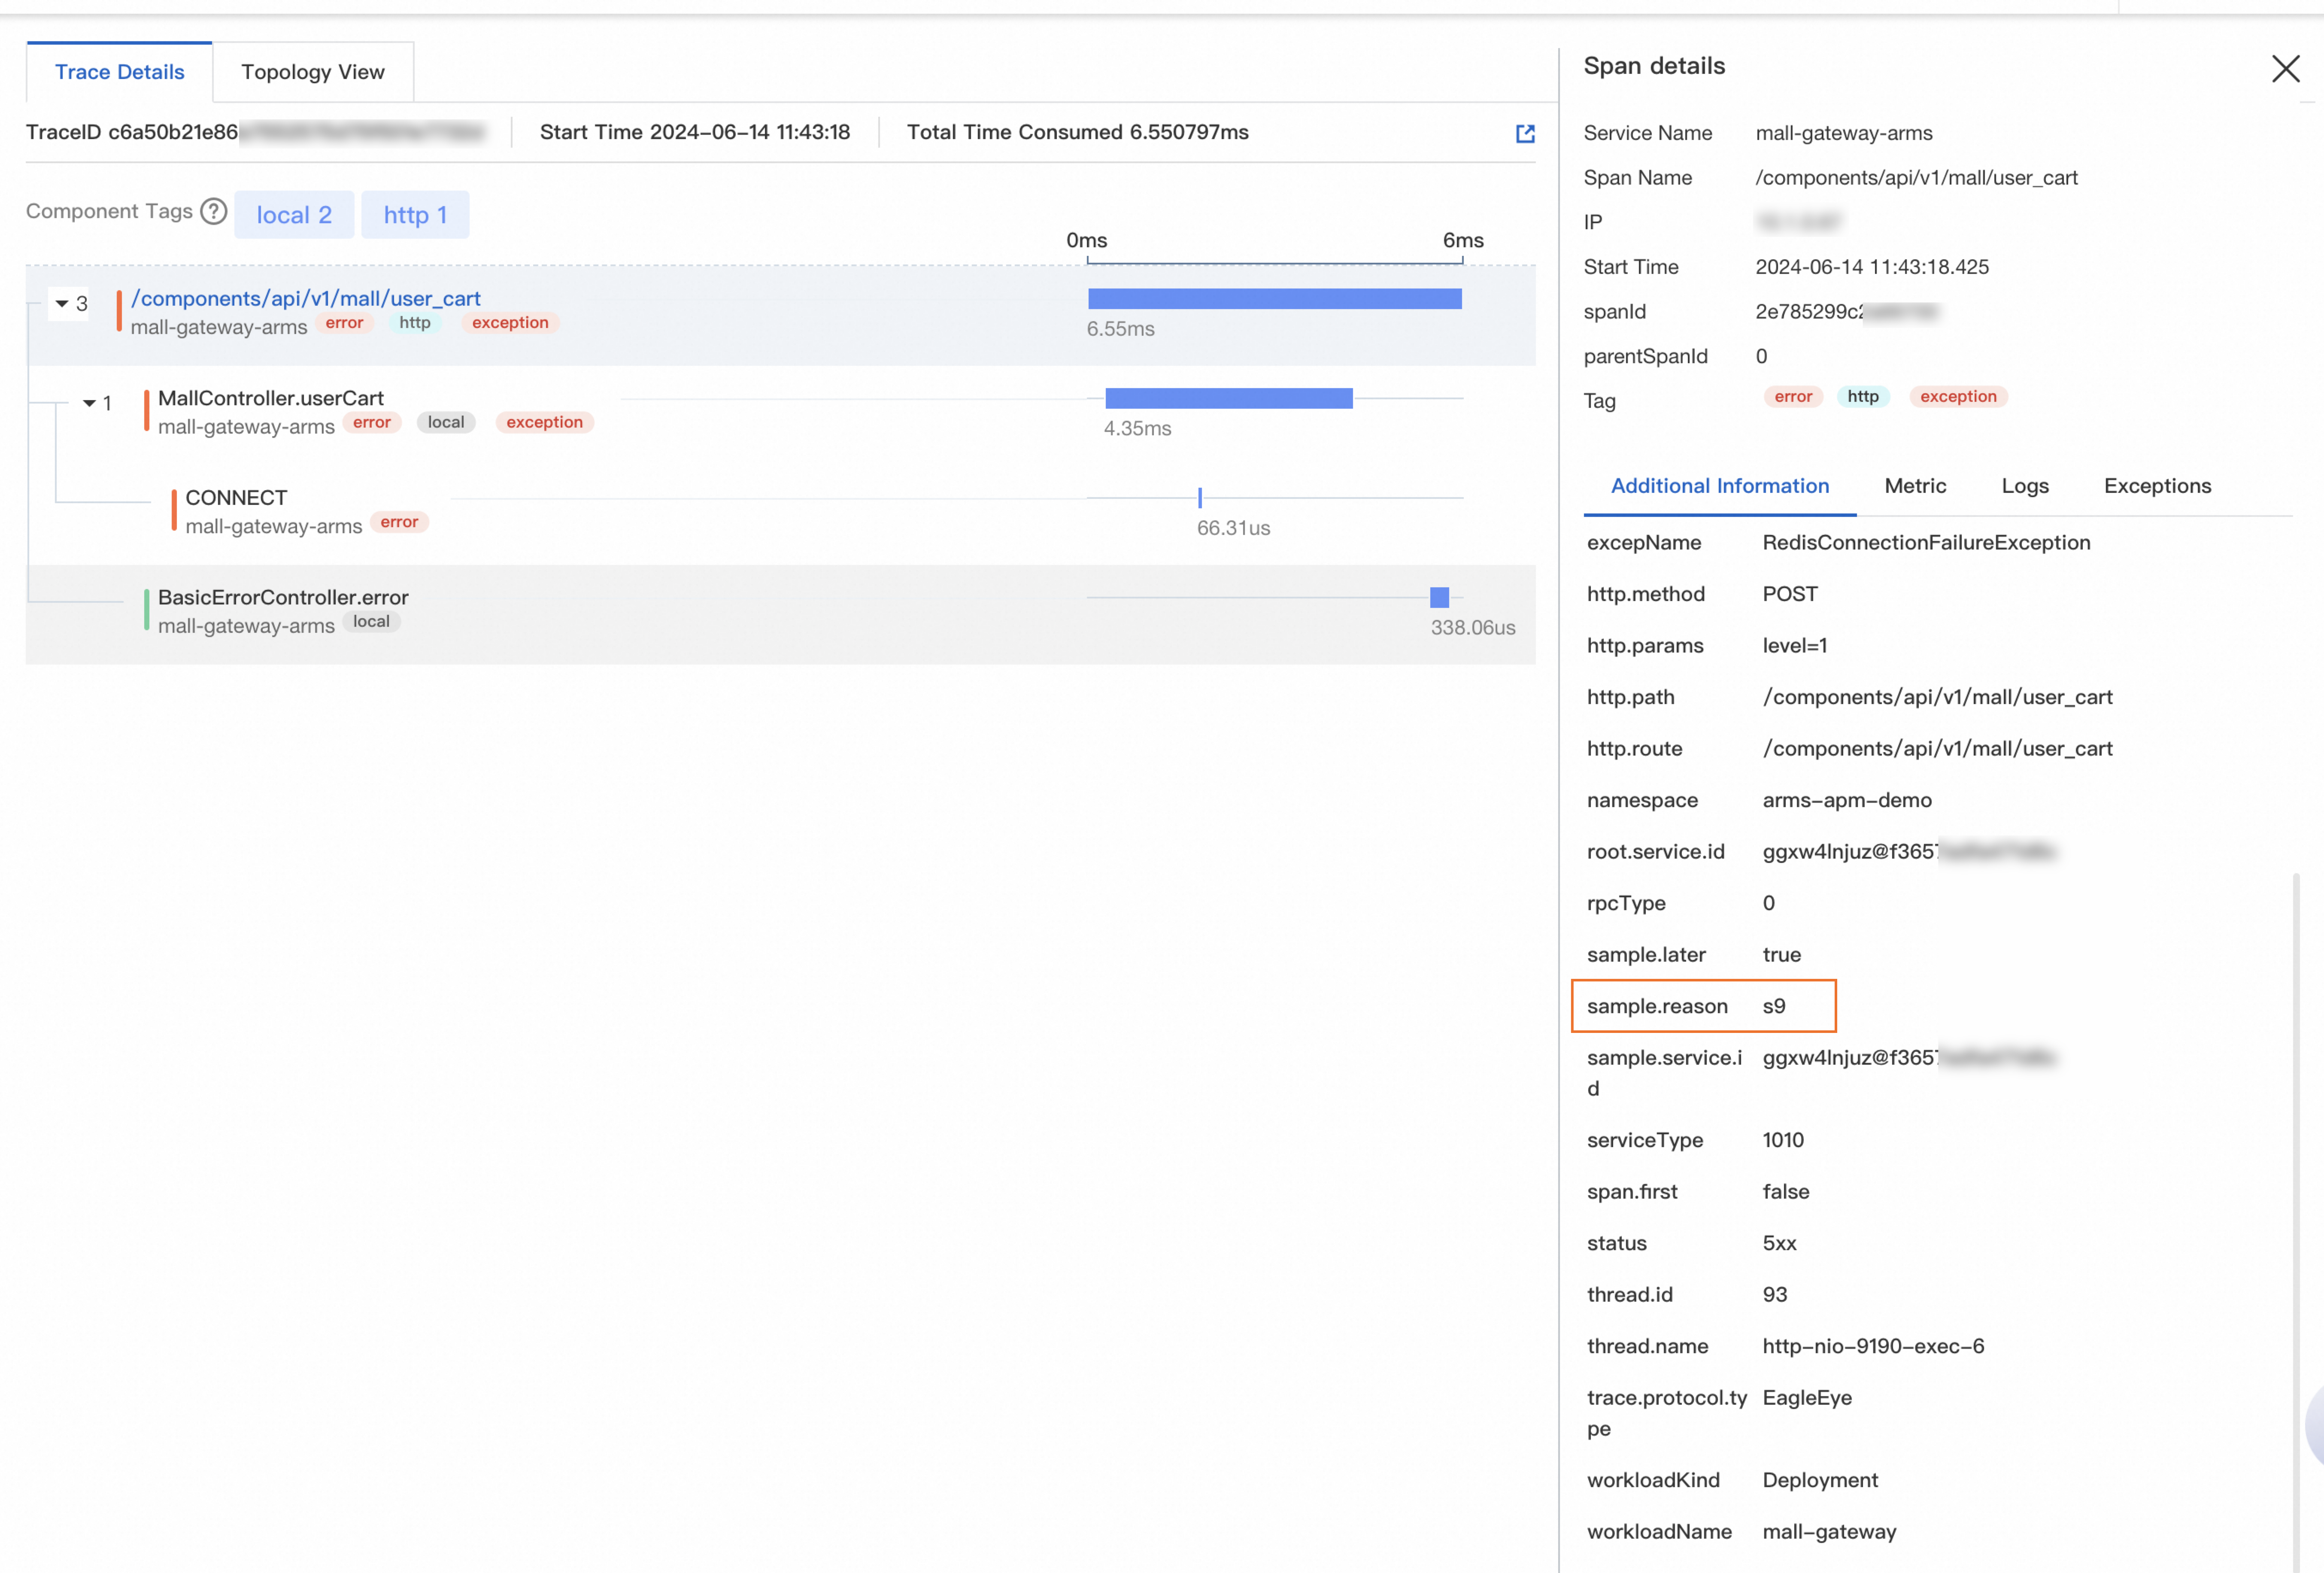
A trace is sampled when any of the following conditions is met:
Failed request: An HTTP interface returns a status code other than 200, or a non-HTTP interface throws an exception from the instrumented method.
Uncaught internal exception: An exception occurs during internal execution but is not propagated to the ingress service of the framework.
Slow request: The call duration exceeds the slow-call threshold configured on the Custom Configurations page.
If quantiles are enabled, calls with a duration above the 99th percentile of that interface also match the slow-call sampling rule.
The sample.reason attribute value depends on the trigger condition:
| Condition | sample.reason value |
|---|---|
| Failed request | s9 |
| Abnormal call (uncaught exception) | s11 |
| Slow request | s10 |
Custom sampling
Custom sampling lets you specify interfaces by exact name, prefix, or suffix and sample all their traces. Use this for interfaces that require complete trace coverage -- for example, payment processing interfaces or newly deployed services.
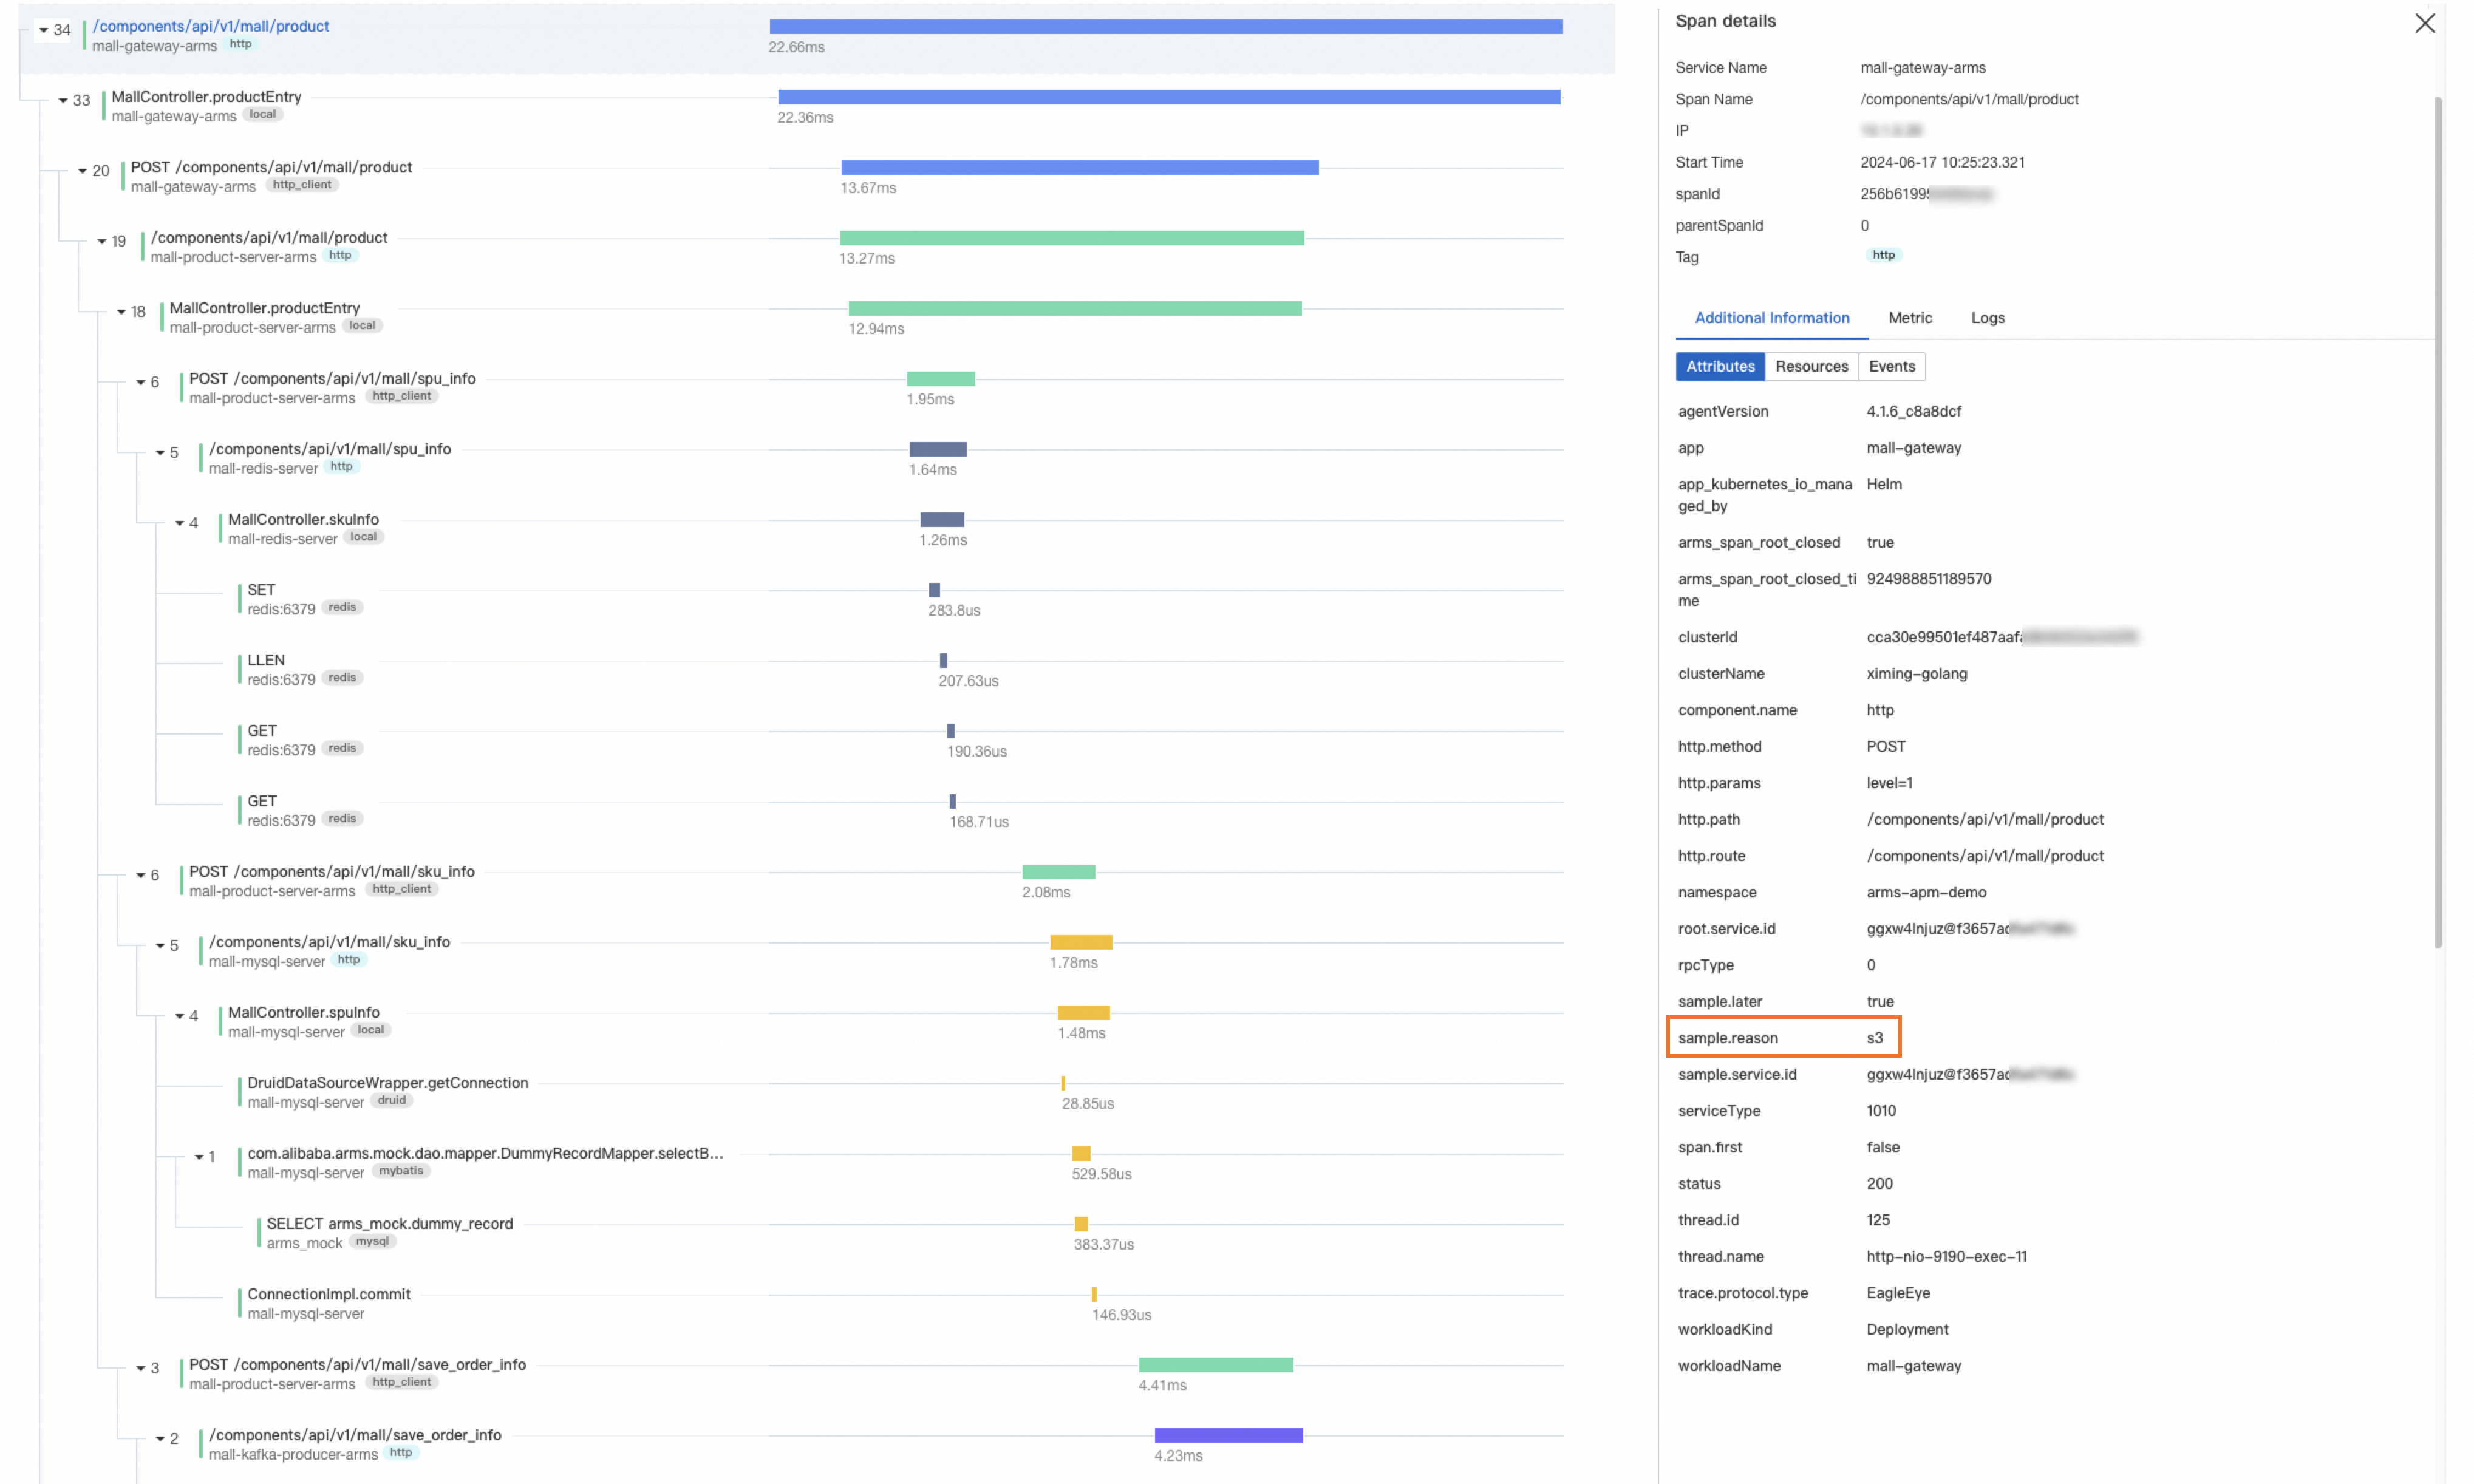
Sampled spans carry the attribute sample.reason: s3.
Configure custom sampling
Log on to the ARMS console. In the left-side navigation pane, choose .
Select a region in the top navigation bar and click the application.
Note Icons in the Language column indicate the programming language: -: Java - : Go - : Python - - (Hyphen): an application monitored in Managed Service for OpenTelemetryIn the top navigation bar, choose .
In the Sampling Settings section, specify the interface names, prefixes, or suffixes.
Click Save.
Sampling marks
When trace contexts pass between services using the EagleEye protocol, ARMS uses sampling marks to communicate the sampling decision. The EagleEye-Sampled request header carries one of two values:
| Value | Meaning |
|---|---|
s0 | Not sampled |
s1 | Sampled |
ARMS also records the reason a trace was sampled in the sample.reason span attribute. Use this attribute to filter and analyze traces in Trace Explorer. For example, filter by s10 to find all traces sampled due to slow requests.
sample.reason value | Sampling policy |
|---|---|
s2 | Minimum sampling for all interfaces |
s3 | Custom sampling |
s4 | Fixed-rate sampling |
s5 | Reserved |
s6 | Adaptive sampling |
s7 | Reserved |
s8 | Basic Edition sampling |
s9 | Failed request sampling |
s10 | Slow request sampling |
s11 | Abnormal call sampling |
Sampling decision flowchart
The following diagram illustrates how ARMS evaluates sampling policies for a trace spanning services A, B, and C.

The flowchart uses three color-coded paths:
Purple (head-based sampling): Evaluated only at the root span of the trace. A single sampling decision is made at service A and propagated to all downstream services.
Blue (custom sampling and minimum sampling): Evaluated at each service if head-based sampling was not triggered. When service B samples a trace through custom or minimum sampling, the sampling attributes are passed on to service C. Each service (A, B, C) makes its own decision.
Green (failed or slow request sampling): Evaluated at each service if none of the previous policies triggered sampling. When service B samples a trace because of a failure or slow response, the sampling attributes are not passed to service C. Each service makes an independent decision.
See also
Analyze trace data in Trace Explorer: Filter by
sample.reasonand other attributes to investigate specific traces.Supported tracing protocols: Details on the EagleEye protocol and other supported propagation formats.