After you install an Application Real-Time Monitoring Service (ARMS) agent for an application, ARMS begins monitoring the application. You can view information about the dependencies of an application on the Dependencies page, including external calls, database calls, and message queues.
Prerequisite
An ARMS agent is installed for the application.
Application Monitoring provides a new application details page for users who have enabled the new billing mode.
If you have not enabled the new billing mode, click Switch to New Version on the Application List page to view the new application details page.
View the dependencies of an application
Log on to the ARMS console. In the left-side navigation pane, choose .
Select a region in the top navigation bar and click an application.
In the top navigation bar, click Dependencies.

In the Quick Filter section (icon 1), you can query charts and dependencies by Request Type, Request Destination, and Host.
In the trend charts section (icon 2), you can view the time series of requests sent by the application to the dependency, the number of errors, and the average duration within the specified time period.
Click the
 icon. In the dialog box that appears, you can view the metric data in a specific period of time or compare the metric data in the same time period across different dates. You can click the
  icon to display the data in a column chart or a trend chart.
In the service list section (icon 3), you can view the name, type, and key metrics of each request defined by the RED Method: rate, errors, and duration.
In the service list, you can perform the following operations:
Click the name of a dependency, or click Details, SQL Analysis, or Exceptions in the Actions column to view the details of the dependency. For more information, see Dependency details.
Click Traces in the Actions column to view the trace details of a dependency. For more information, see Trace Explorer.
Supported frameworks
Dependency details
External calls
Overview
On the Overview tab, you can view the number of requests, number of errors, and average duration of an endpoint or a service, and time series of the slow calls.

Trace explorer
Trace Explorer allows you to combine filter conditions and aggregation dimensions for real-time analysis based on the stored full trace data. This can meet the custom diagnostics requirements in various scenarios. For more information, see Trace Explorer.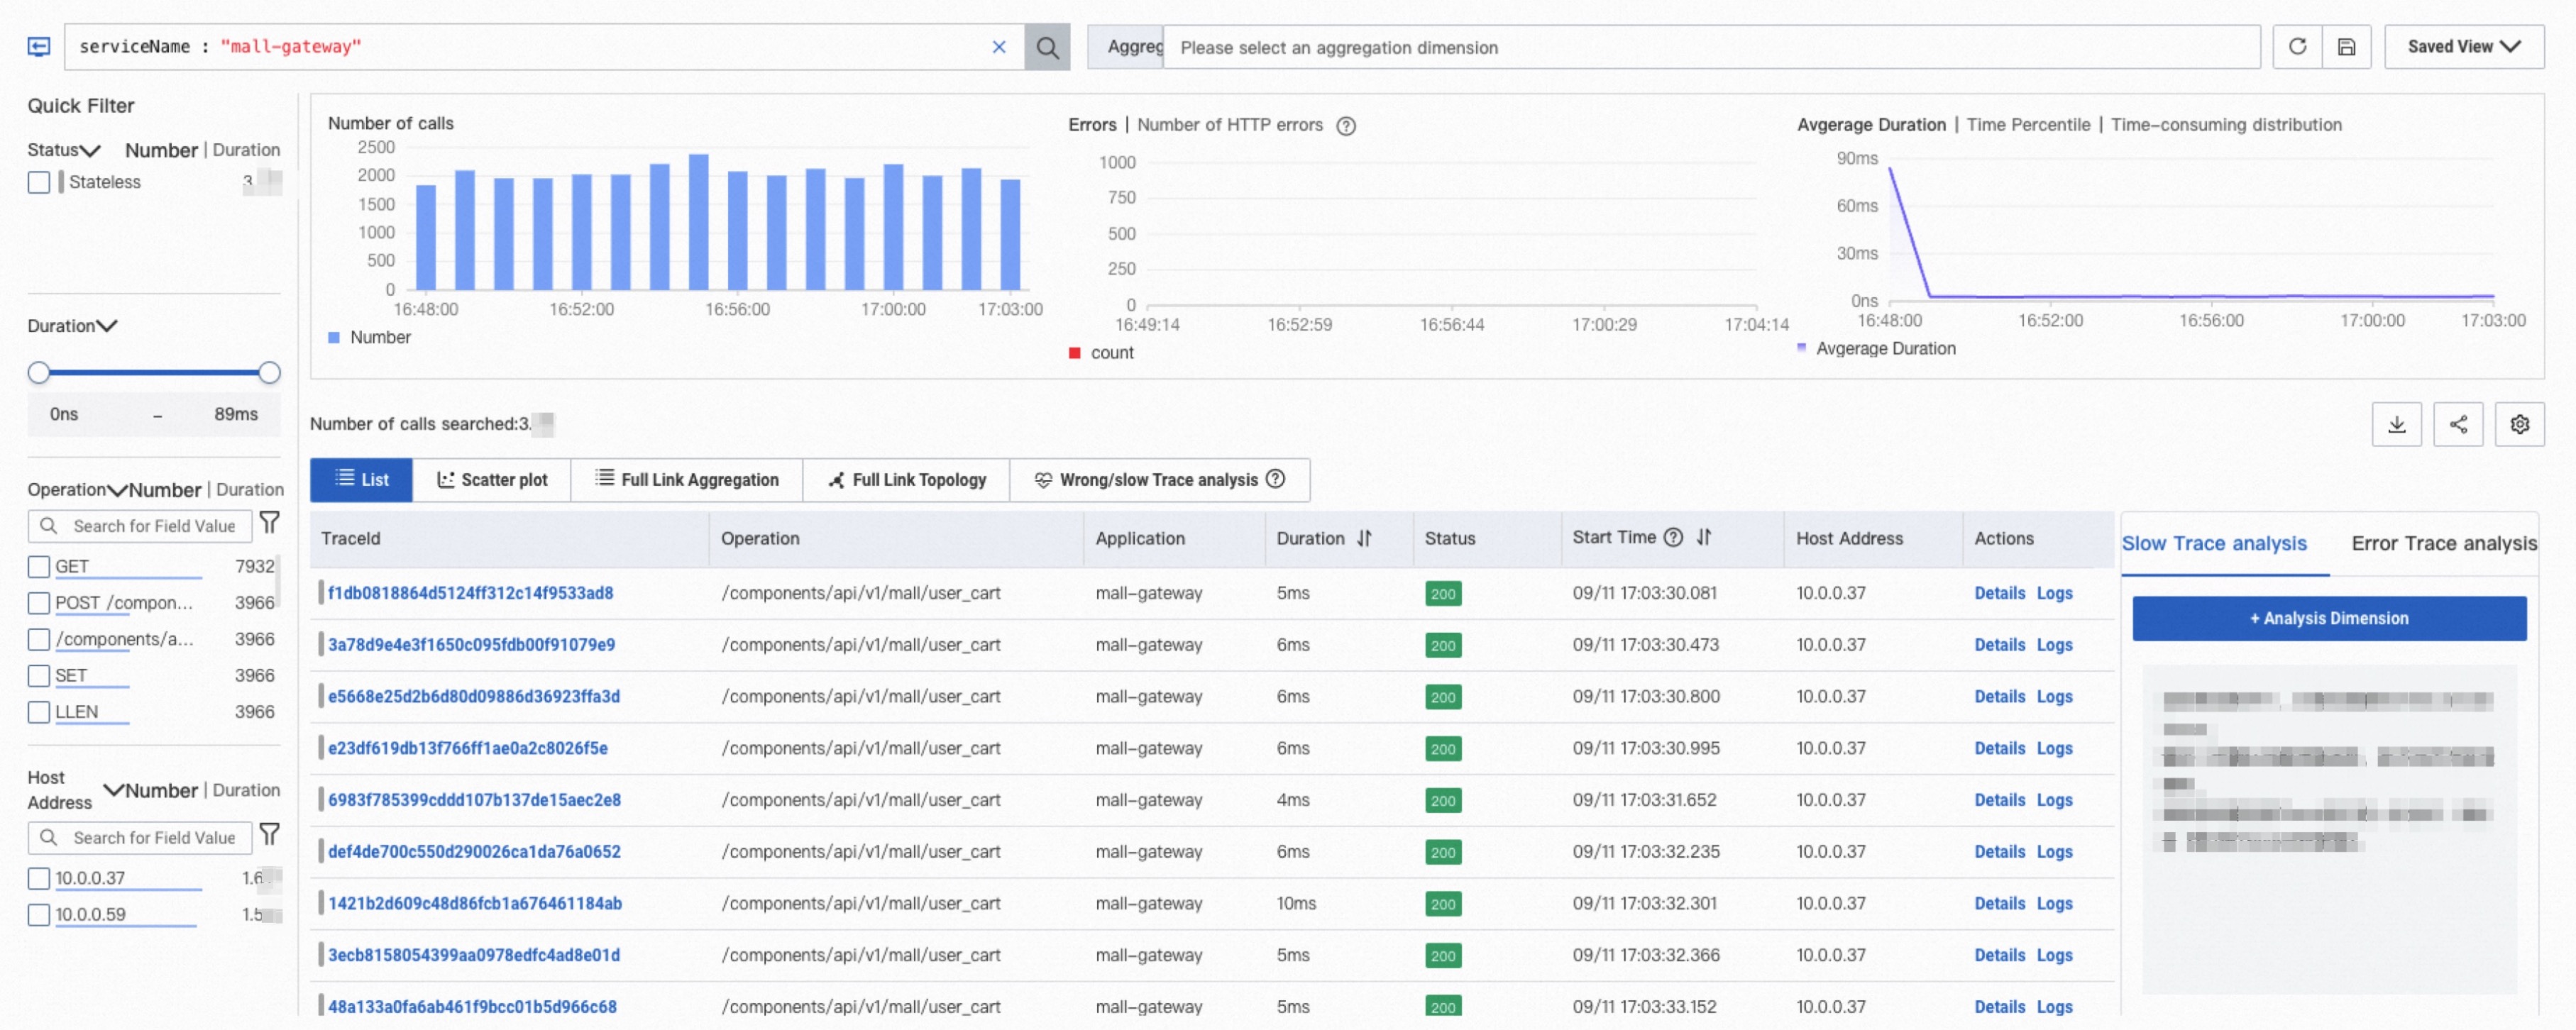
Message publishing
Message publishing for Python applications cannot be viewed.
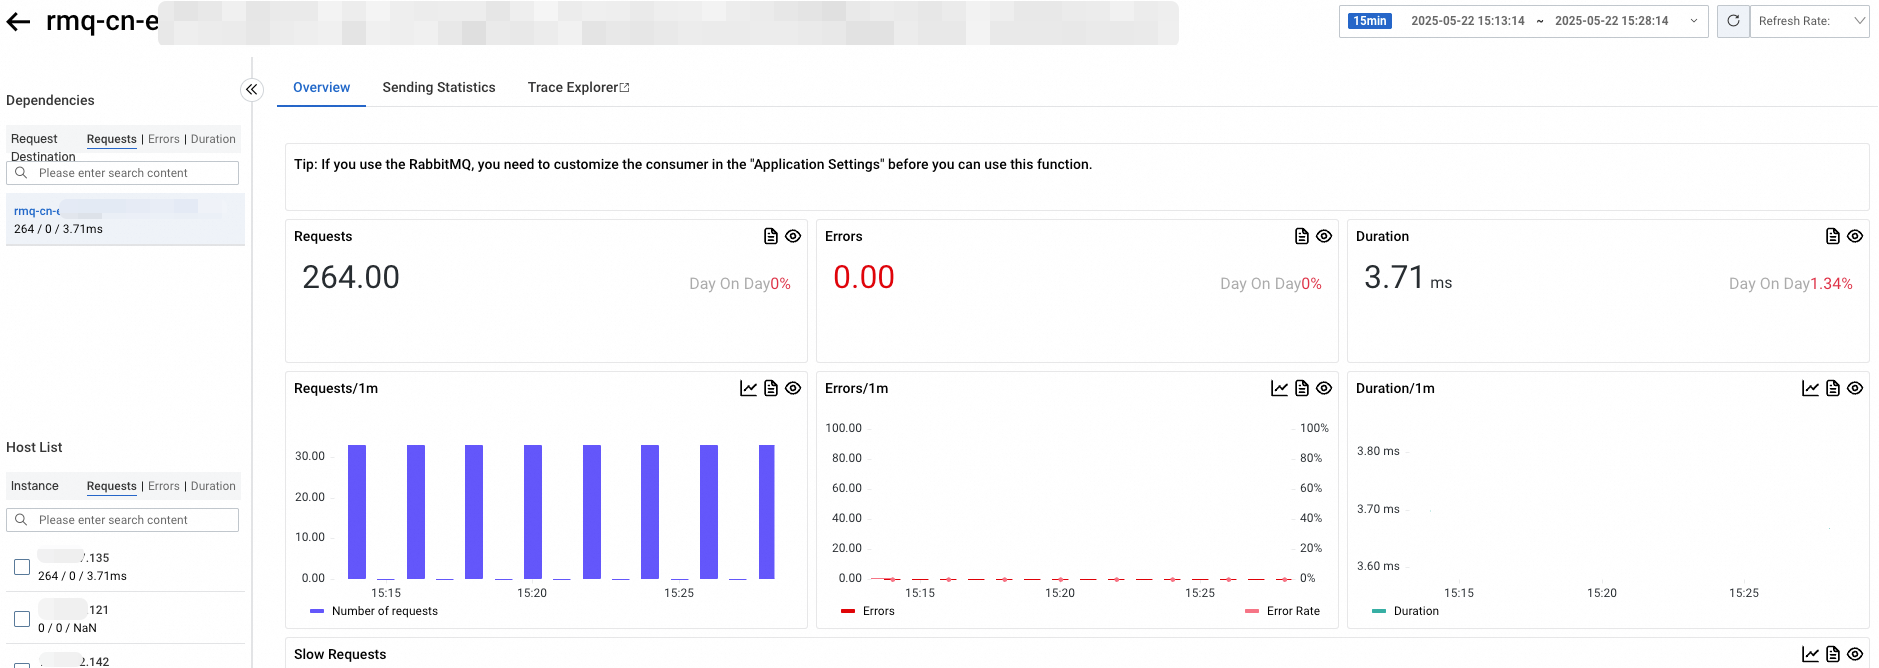
Overview
On the Overview tab, you can view the number of requests, number of errors, and average duration of a message, and time series of the slow calls.
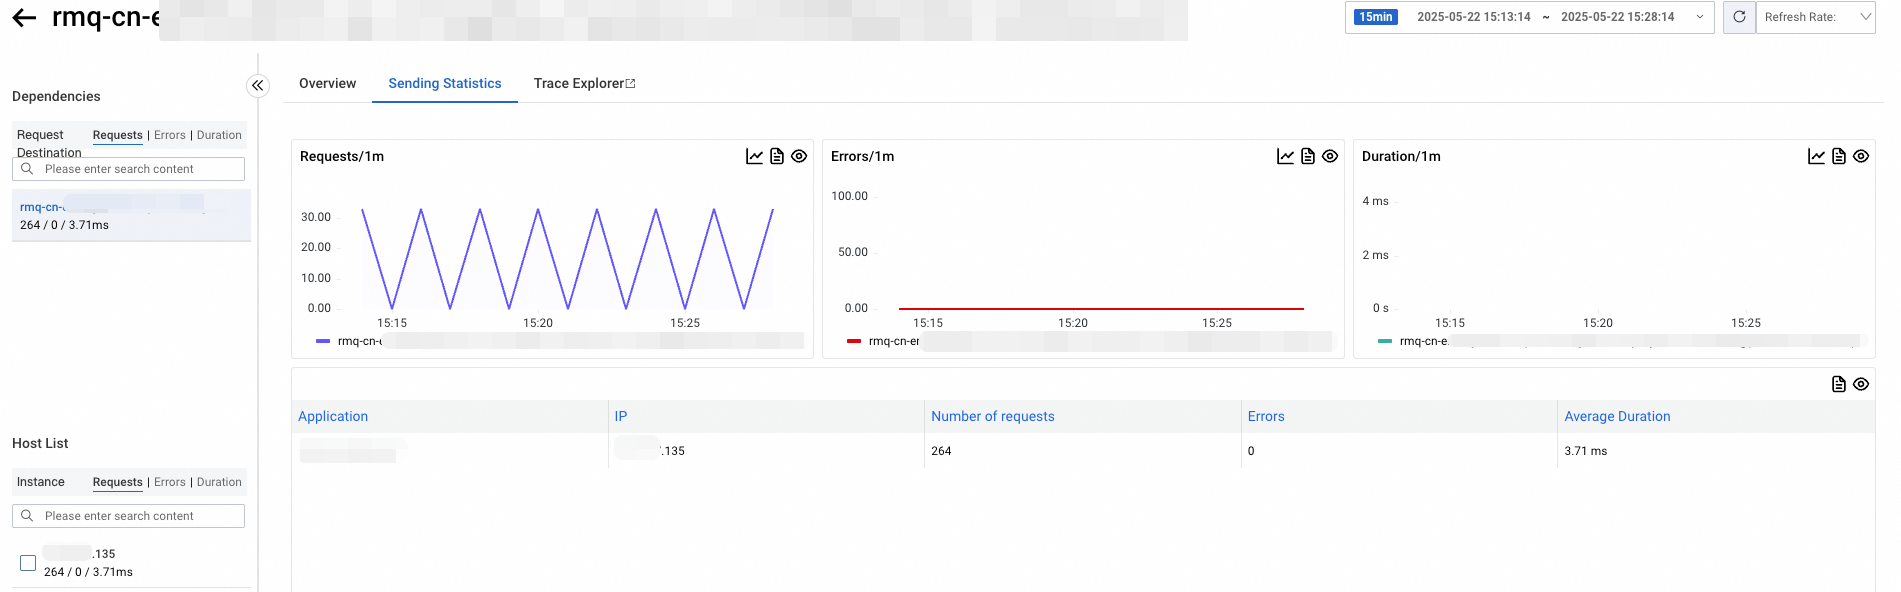
Sending statistics
On the Sending Statistics tab, you can view the details of sending messages to the topic from the perspective of the message sender, including the number of requests, the number of errors, and the duration.
Trace explorer
Trace Explorer allows you to combine filter conditions and aggregation dimensions for real-time analysis based on the stored full trace data. This can meet the custom diagnostics requirements in various scenarios. For more information, see Trace Explorer.
Database calls
Database calls for Python applications cannot be viewed.
Overview
On the Overview tab, you can view the number of requests, number of errors, and average duration of a database instance called by the application, and time series of the slow calls.

SQL analysis
On the SQL analysis tab, you can view trends in the number of requests, number of errors, and average duration of a database instance, and time series of SQL statements. On this tab, you can discover the SQL statement that causes the service to respond slowly.
The Return Size field is available only to MySQL v5.x and only supported by the ARMS agent v2.7.1.3 or later.
You can click Traces in the Actions column to view the trace of a SQL statement. For more information, see Trace Explorer.

Exceptions
On the Exceptions tab, you can view the number of times each exception is thrown when the application calls databases within the specified time period, and the details of the exception. For more information, see Exception analysis.

Source of Request
On the Source of Request tab, you can view the time series of the response time, number of requests, and number of errors of interfaces from which the application calls databases.

Trace explorer
Trace Explorer allows you to combine filter conditions and aggregation dimensions for real-time analysis based on the stored full trace data. This can meet the custom diagnostics requirements in various scenarios. For more information, see Trace Explorer.
FAQ
Databases
Why do database calls have no data?
Possible causes:
The database is not on the list of databases supported by ARMS. For information about supported databases, see Java components and frameworks supported by ARMS.
The ARMS agent earlier than v4.x does not support databases called asynchronously or without an entry point.
Why does the ARMS console show slow database calls that are not visible on the database server side?
ARMS monitors from the perspective of the client, encompassing the entire process from when a request is initiated within the application, transmitted over the network to the server, processed by the server, and the response is sent back to the client. Therefore, the database metrics collected by ARMS can be influenced by factors such as garbage collection and network latency, which can result in higher values compared to those observed on the server side. Additionally, ARMS determines whether a call is slow based on the Slow SQL Threshold configured on the Custom Configuration page, with a default threshold of 500 ms, which may differ from the settings on the server side.

Why does the database call volume seen in the ARMS console differ from the call volume observed by the database server monitoring?
A database might be accessed by multiple applications. The ARMS console can only display the call volume from the current application and does not show the call volume from other applications accessing the same database.
Why are some external calls not recorded?
In the 3.x agent, the causes may be as follows:
External calls without an entry point.
By default, the 3.x agent only collects external calls executed within the processing flow of HTTP interfaces, RPC interfaces, scheduled tasks, and message consumption. For example, accessing a database or sending HTTP requests. External calls directly executed through thread pools on a schedule will be ignored during collection.
External calls with an entry point, but thread switching occurs when executing the actual external call.
Because the 3.x agent does not support automatic asynchronous context propagation, there is no trace context after thread switching, and in this case, collection will also be ignored.
Both situations can be resolved by upgrading the agent to 4.x.
Why do external calls have undefined data?
Agent versions 3.1.x and earlier have defects in Dubbo instrumentation, causing failures when obtaining the peer IP address. This issue has been fixed in version 3.2.x.
Why are Redis call keys showing garbled text?
This is caused by an instrumentation issue in the Lettuce framework that results in incorrect key values. You can ignore the garbled parts, as the other parts are valid values.
Why is there no data when jumping from an SQL statement to the Trace Explorer page?
Cause: To avoid the cost and performance overhead of reporting large amounts of data in extreme scenarios, the ARMS agent enables Span compression by default. When multiple child Spans of a ParentSpan have the same SpanName, only one child Span will be recorded, and the attributes of that child Span will record the number of similar child Spans, the sum of their durations, the maximum duration, and the minimum duration. This situation leads to the loss of information from compressed Spans, and similarly, SQL statements in compressed Spans cannot be directly queried on the Trace Explorer page.
Solution: Disable trace compression.
After disabling compression, when an application interface performs many operations on components such as databases or Redis, it will cause an increase in the amount of data reported, and the error and slow sampling logic of ARMS will become ineffective.
Message publishing
What is the difference between the data on the Message Subscription/Message Publishing page and the data from the self-monitoring panel of the message queue instance?
The data on the Message Subscription/Message Publishing page reflects various performance metrics when the selected application acts as a consumer or producer, presenting monitoring data from the perspective of the client. The monitoring panel data for the message queue instance, on the other hand, shows performance metrics related to topics, which is data from the perspective of the server.
What are the SpanName formats for sending and receiving messages?
Message type | ARMS agent earlier than v4.x | ARMS agent v4.x and later |
RocketMQ/ONS message sending | No span is created. Only method stacks are recorded. |
|
RocketMQ/ONS message receiving |
|
|
Kafka message sending | No span is created. Only method stacks are recorded. |
|
Kafka message receiving |
|
|
RabbitMQ message sending | No span is created. Only method stacks are recorded. |
|
RabbitMQ message receiving |
|
|
Does the ARMS agent for Java support Spring Cloud Alibaba RocketMQ?
The ARMS agent v4.x and later supports this framework. If the agent version is earlier than 4.x, upgrade it.
What is the meaning and unit of the "Message Delay" metric in message queue monitoring?
Message delay refers to the total time taken from when a message is generated until it is consumed by the Consumer. The unit for this metric is milliseconds (ms). Currently, this metric is only supported for collection by RocketMQ Client and ONS Client.
Why does the application have consumer logic but no associated trace or metric data for the consumers?
It might be because the agent version is lower than 4.x, and lambda expressions were used to define the consumption logic within the messageListener.
Due to class enhancement failures for lambda expressions in agent versions 2.x and 3.x, you can avoid this issue by upgrading the agent to v4.x.
Why did I receive the "Magic v1 does not support record headers" error message when I connected Kafka Clients to the ARMS agent for Java?
The ARMS agent for Java uses the Header field of Kafka messages to pass trace context. However, in Kafka versions earlier than 0.11.0.0 (both Client and Broker), the Kafka message body does not support Header fields. If your Kafka-broker or Kafka-clients are below this version, please migrate to version 0.11.0.0 or higher as soon as possible.
If you cannot migrate at this time, for agents earlier than v4.x, you can disable the enhancement of the Kafka component (the kafka-plugin switch) in the Probe switch settings section on the Custom Configuration tab. For agents v4.x and later, you can add the JVM parameter -Dotel.instrumentation.kafka.producer-propagation.enabled=false when starting the service to prevent such issues.
Why are traces missing Spans for receiving or sending messages?
Check whether the message queue Client SDK used by your Producer and Consumer applications is within the range supported by ARMS. For more information, see Java components and frameworks supported by ARMS.
Make sure that both your Producer and Consumer applications are being monitored by Application Monitoring or Managed Service for OpenTelemetry, with agent switches and plug-in switches correctly enabled, and that they report to the same region. Spans for sending messages are generated in the Producer, while Spans for receiving messages are generated in the Consumer. If an application has not been properly monitored, the corresponding Spans will be missing.
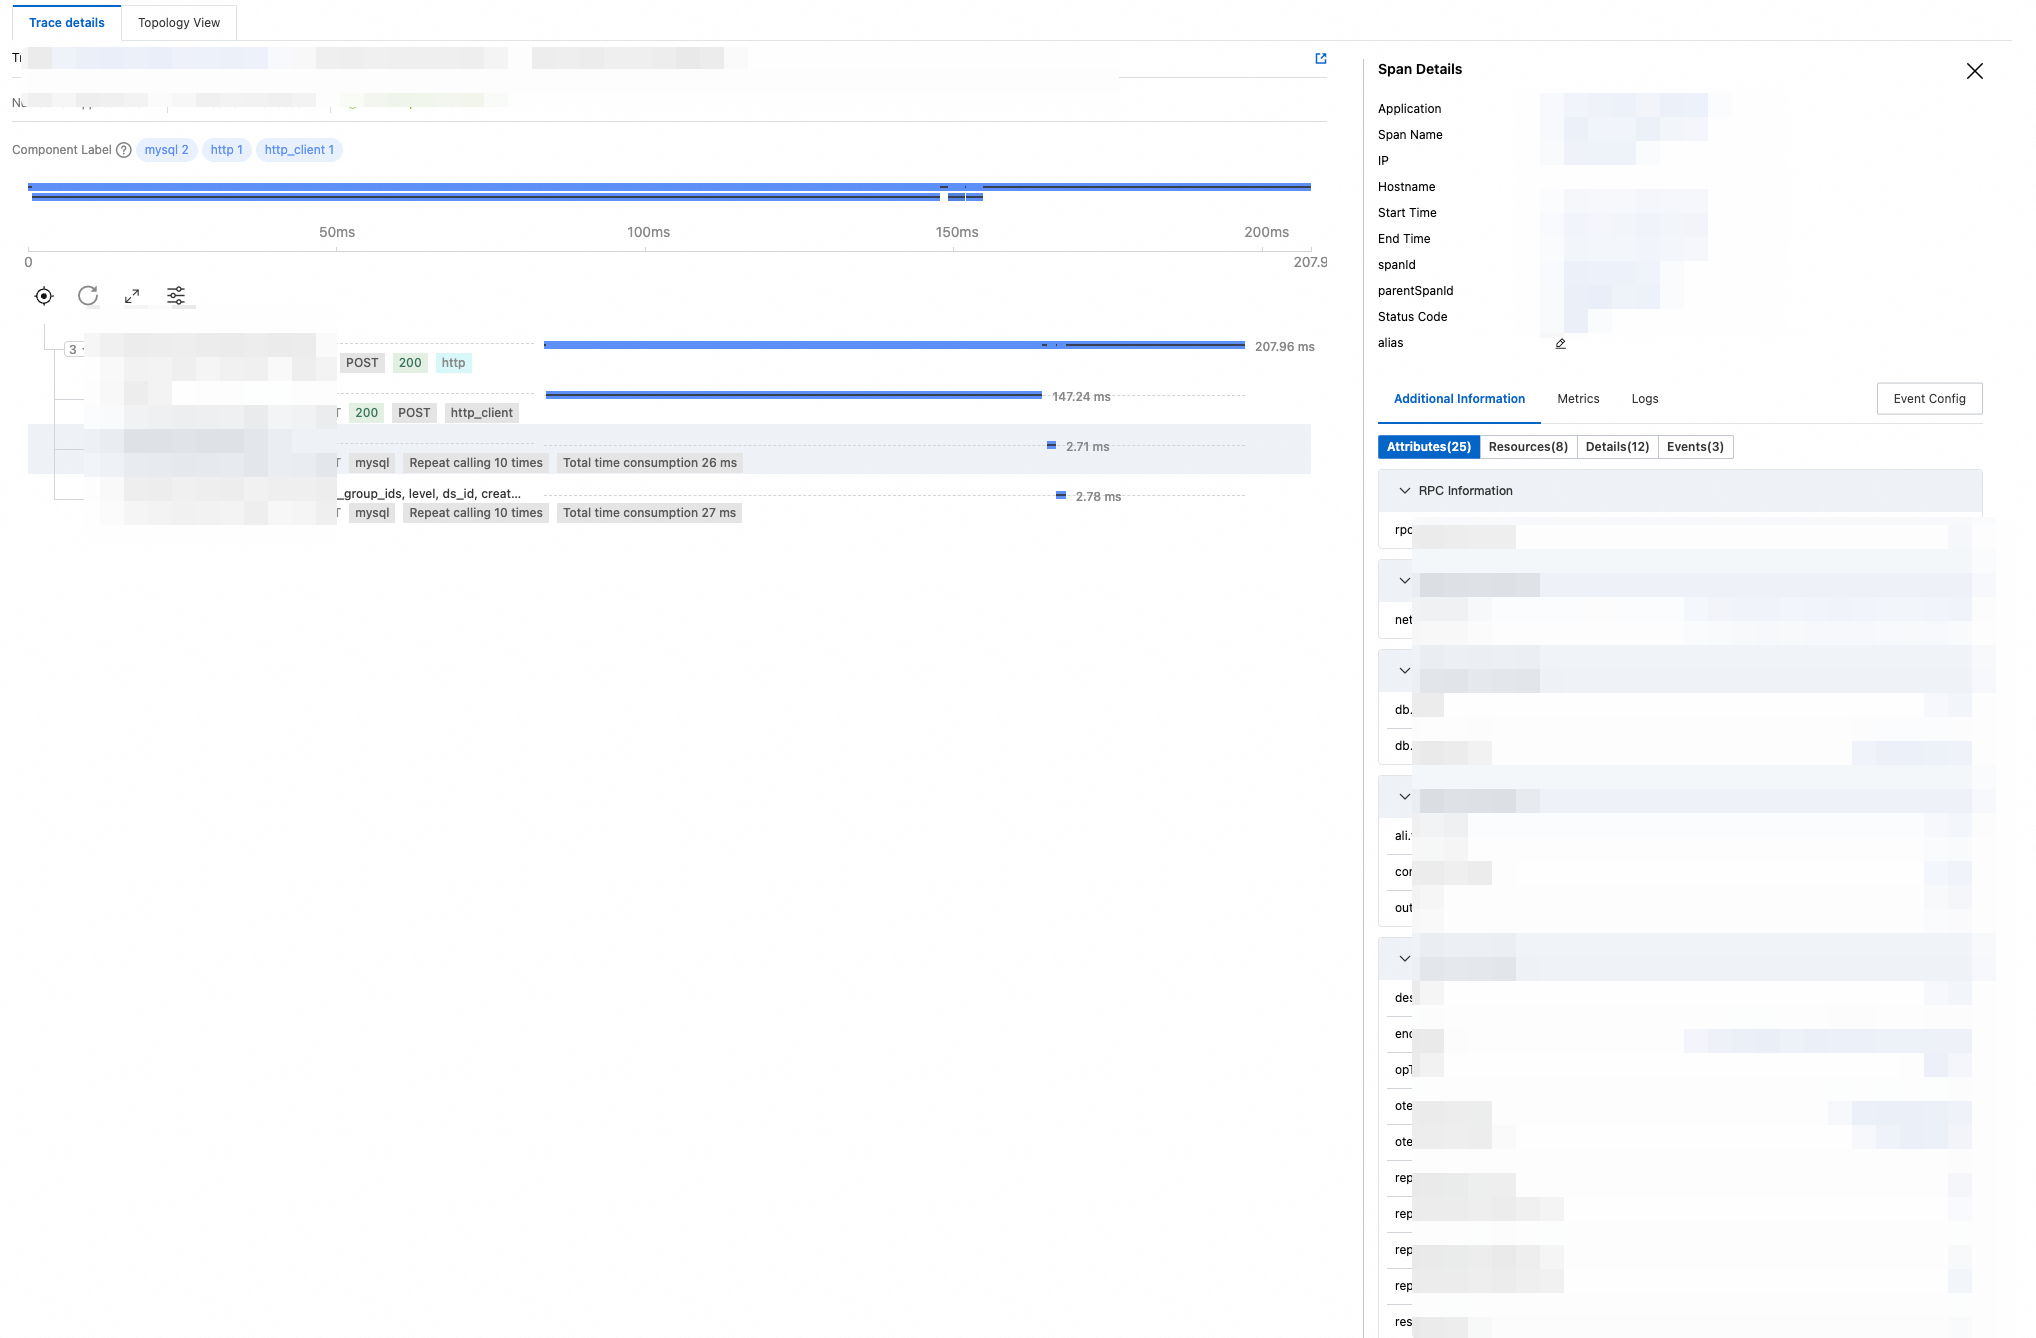
If you cannot see Spans for sending messages, check whether the agent version of the Producer application is 4.x or later. In agent versions earlier than 4.x, sending messages does not generate a separate Span but is instead recorded within the method stack of the parent Span. You can click the
 icon to the right of the parent Span to view the actual call method stack.
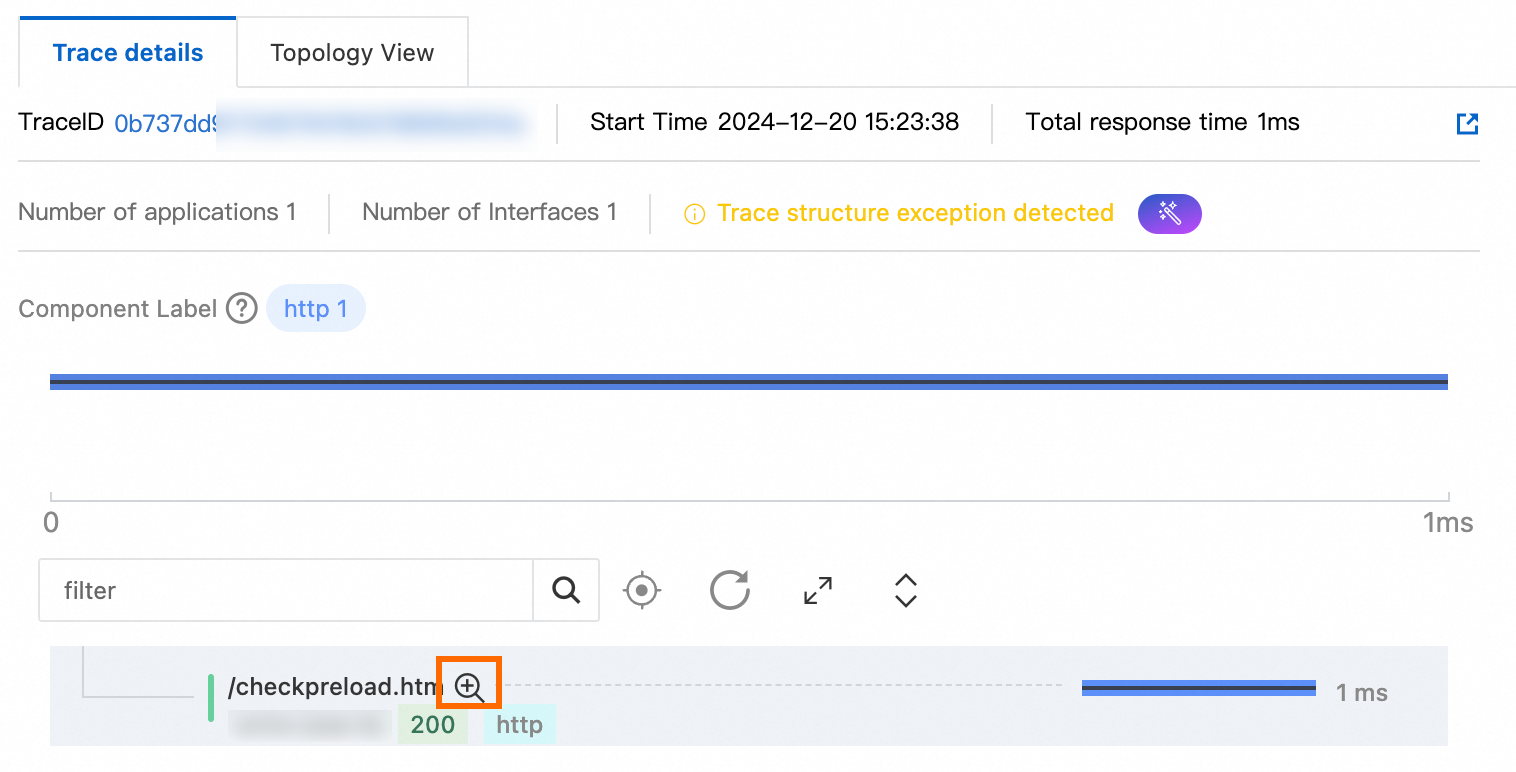
If you cannot see Spans for receiving messages, check whether Invalid Interface Filter is enabled in the Interface Call Configurations section of the Custom Configuration tab. This option filters out Spans that you are not concerned with.
Why is there a large difference in Kafka response times between agent versions 4.x and earlier?
Issue: Response times changed from several seconds to 0.x milliseconds.
Cause:
In agent version 3.x and earlier, when processing BatchMessageListener, a batch of messages is considered as a single call, and all durations are aggregated together.
In agent version 4.x and later, these operations are separated, with each message counted as an individual call. Therefore, when upgrading from agent version 3.x to 4.x, it is expected that the duration of a single call will decrease significantly while the number of calls will increase significantly.
The statistical method in version 3.x was unreasonable, and version 4.x has been optimized.