
A Complete Metric Monitoring System in the Cloud
Managed Service for Prometheus is a cloud-native metric monitoring platform that is compatible with the open source Prometheus ecosystem. Managed Service for Prometheus provides an all-in-one metric monitoring platform for different roles such as O&M engineers and site reliability engineers (SREs). It also provides monitoring and alerting services for various scenarios, such as custom business monitoring, application component monitoring, cloud service monitoring, container monitoring, and system monitoring.
Better Performance
Compared with open source Prometheus, Managed Service for Prometheus improves the performance of data collection by 20 times. Managed Service for Prometheus supports data queries of long time intervals within seconds and globally aggregate queries.
Cost-effectiveness
Managed Service for Prometheus provides fully managed services that reduce O&M costs by 90%. You are charged based on the number of metrics, and a large number of free metrics are provided.
Higher Availability
Multiple replicas can be deployed to support the scale-out of data collection components. Distributed storage in the cloud ensures data reliability.
Features
Specialized Containers for Full-stack Monitoring and Integrated Metric Monitoring Dashboards
Covers business monitoring, application component monitoring, cloud service monitoring, container monitoring, and system monitoring.
Metrics for the System Layer
Provides basic metrics such as CPU utilization, memory usage, disk usage, and I/O.
Multi-cloud and Multi-cluster Metrics
Provides metrics for Alibaba Cloud clusters such as Kubernetes clusters and Elastic Compute Service (ECS) clusters, and hybrid cloud clusters.
Metrics for the Container Layer
Deeply integrates with Alibaba Cloud Container Service for Kubernetes (ACK), and provides basic metrics free of charge.
Metrics for Cloud Services
Provides metrics for cloud services such as databases, message queues, microservices, and storage.
Metrics for the Self-managed Application Component Layer
Provides metrics for self-managed application components such as middleware, databases, and message queues.
Metrics for Application Performance
Deeply integrates with the application monitoring and browser monitoring features of Application Real-Time Monitoring Service (ARMS) and complies with the OpenTelemetry standard.
Custom Business Metrics
Supports custom metrics such as the transaction rate, order placement rate, and click-through rate.
Improved Grafana Dashboards
Integrates various dashboards and alerts with a few clicks.
Preset Dashboard Templates for Common Cloud Services and Application Components
Provides data source configurations and preset dashboards for cloud services to display monitoring data in a unified manner.
Custom Extension of Grafana Plug-ins
Allows you to add Grafana plug-ins, visual templates, and data sources to meet personalized O&M and monitoring requirements.
Prometheus Dashboard Templates for Mainstream Cloud Services
Provides Prometheus Grafana dashboards for mainstream cloud services, such as ACK and Message Queue for Apache Kafka, to help O&M teams perform finer-grained metric monitoring.
More Secure Permission Management Systems
Supports Alibaba Cloud single sign-on (SSO) and Resource Access Management (RAM), and allows you to access services by using Alibaba Cloud accounts and as RAM users.
Enhanced Intelligent Alert Management
Improves the troubleshooting collaboration efficiency and alert accuracy.
Multi-channel Data Push
Supports more than 10 notification methods, such as Slack, DingTalk, emails, text messages, and webhooks, for timely message notifications.
Improved Alert Collaboration Efficiency
Allows you to collaborate on alert handling, trace alerts, and collect statistics on alerts by using the alert management, alert recording, and alert history features based on DingTalk-based ChatOps.
Intelligent Noise Reduction
Provides algorithm capabilities, such as exception check and intelligent noise reduction, to effectively reduce invalid alerts.
Root Cause Analysis of Alerts
Helps you analyze the root causes of alerts based on the application context to improve the troubleshooting efficiency.
Globally Aggregate Queries of Multiple Instances
Provides capabilities such as globally aggregate queries, unified Grafana data sources, and centralized alerting.
Comparison between Alibaba Cloud Managed Service for Prometheus and open source Prometheus
| Item | Alibaba Cloud Managed Service for Prometheus | Self-managed Prometheus |
|---|---|---|
| Resource purchase and system deployment | Resources are fully managed by Alibaba Cloud. | You must purchase resources and deploy systems on your own. |
| O&M costs | No O&M operations are required. | Routine O&M operations are required. |
| High availability | Multiple replicas can be deployed to support the scale-out of data collection and storage components. This provides high availability. | You can run only one process at a time. Scale-out is not supported for data collection and storage components. |
| Data access | You can integrate common cloud services, mainstream application components such as databases and middleware, and applications that are developed by using mainstream programming languages such as Java and Go. You can monitor middleware hosted on ECS clusters without the need to install an agent. | To collect the data of a component, you must create an exporter for the component. |
| Data storage | Cloud-based storage has unlimited storage capacity. | The storage capacity is limited. |
| Data visualization | Grafana is integrated into the console, and all kinds of common monitoring templates are available out of the box. | You must deploy Grafana and configure dashboards on your own. |
| Alert management | The alert center of ARMS is integrated with Managed Service for Prometheus to improve the alert efficiency and accuracy. | You must install the Alertmanager plug-in on your own. |
| Collection performance of a single replica (2 CPU cores, 4 GB memory) | 6 million data points. | 1 million data points. |
| Data query performance (0.6 billion points in time) | 8 to 10 seconds. | 180 seconds. |
| Security management | Managed Service for Prometheus is integrated with Alibaba Cloud security capabilities to meet the security and compliance requirements of enterprises. | Not supported. |
| Other capabilities | Managed Service for Prometheus supports pre-aggregation and downsampling capabilities. | Not supported. |
Scenarios
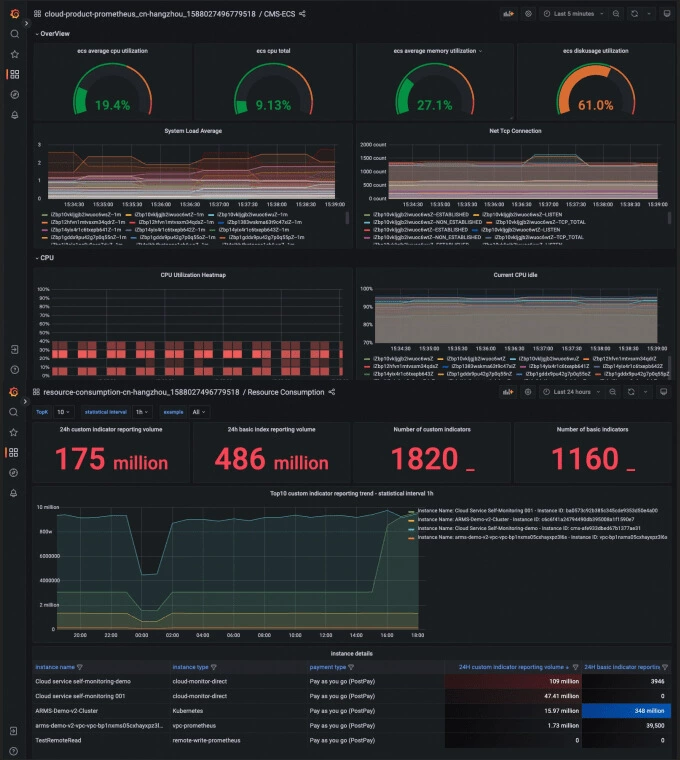
Metrics for Cloud Services
Managed Service for Prometheus monitors cloud services, displays monitoring data on dashboards, supports data queries, and provides alerting services. This allows O&M teams to perform routine O&M operations in a convenient manner. Managed Service for Prometheus supports more than 50 cloud services and will support more cloud services in the future.


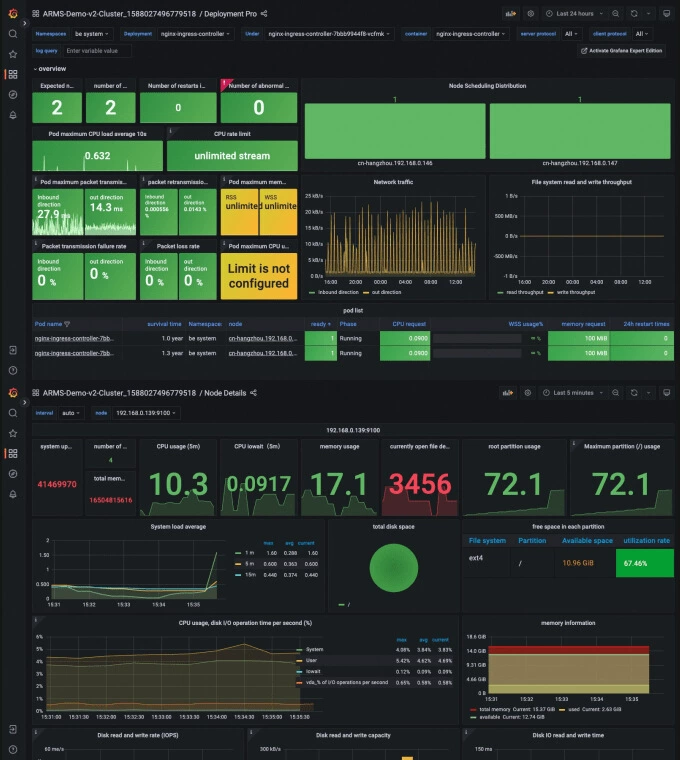
Metrics for the Container Layer
Managed Service for Prometheus is deeply integrated with ACK. You can enable Managed Service for Prometheus as a feature when you are configuring an ACK cluster. Managed Service for Prometheus provides containers with components for workload performance monitoring, Ingress performance monitoring, and CoreDNS performance monitoring. It also provides dedicated dashboards to monitor the metrics of container services, application components, cloud services, and applications, and displays monitoring data based on cloud resource tags.
Monitored Objects


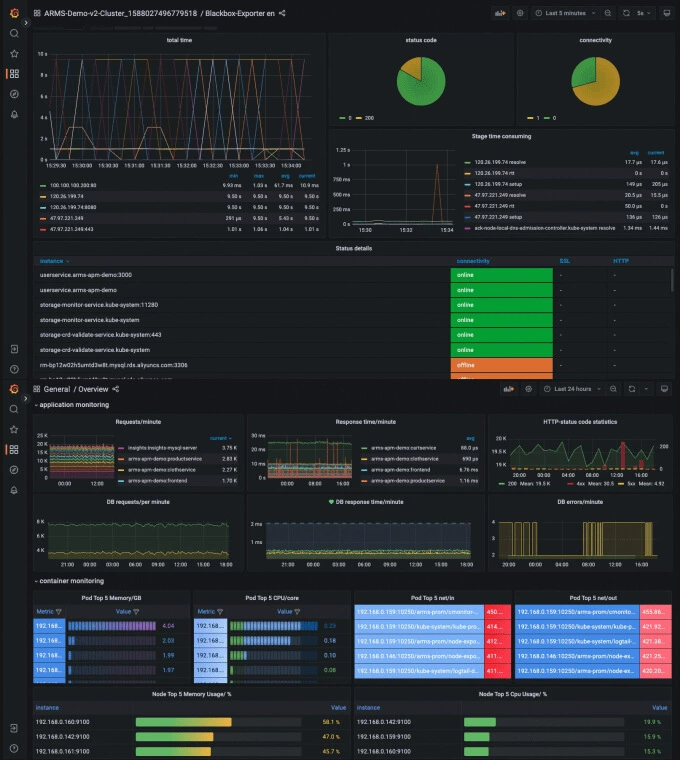
Metrics for Application Performance
Managed Service for Prometheus is integrated with ARMS. It provides preset dashboards for application performance metrics and allows you to monitor the metrics with simple configurations. It also allows you to collect application performance data by using service discovery configurations.
Monitored Objects

Metrics for Multi-cloud Application Components
Managed Service for Prometheus provides solutions to install exporters for third-party clouds and data centers to meet their metric monitoring requirements.
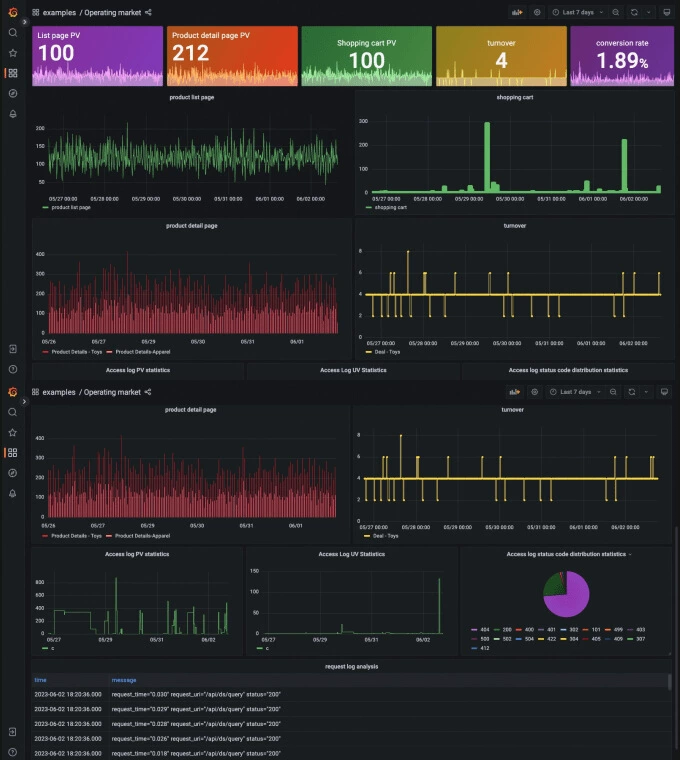
Custom Business Metrics
Managed Service for Prometheus allows you to customize business objective metrics, service quality metrics, technical component metrics, and basic resource metrics based on your business requirements. After data capture tasks are configured, all metrics are centrally displayed to improve data relevance.


