
Announcements and Updates
Application monitoring and Managed Service for OpenTelemetry now offer a monthly free quota of 50 GB. Real User Monitoring (RUM) provides a monthly free quota of 100 Observability Compute Units (OCUs).
Learn more >ARMS agent for Go capabilities have been upgraded to include performance profiling, effectively diagnosing bottlenecks in Go applications caused by CPU, memory, and I/O issues.
Learn more >Trace association with application logs now supports Simple Log Service (SLS) data sets of the StoreView type, meeting the need for unified correlation queries when application logs are output to multiple Logstores.
Learn more >Build a Full-stack Monitoring System
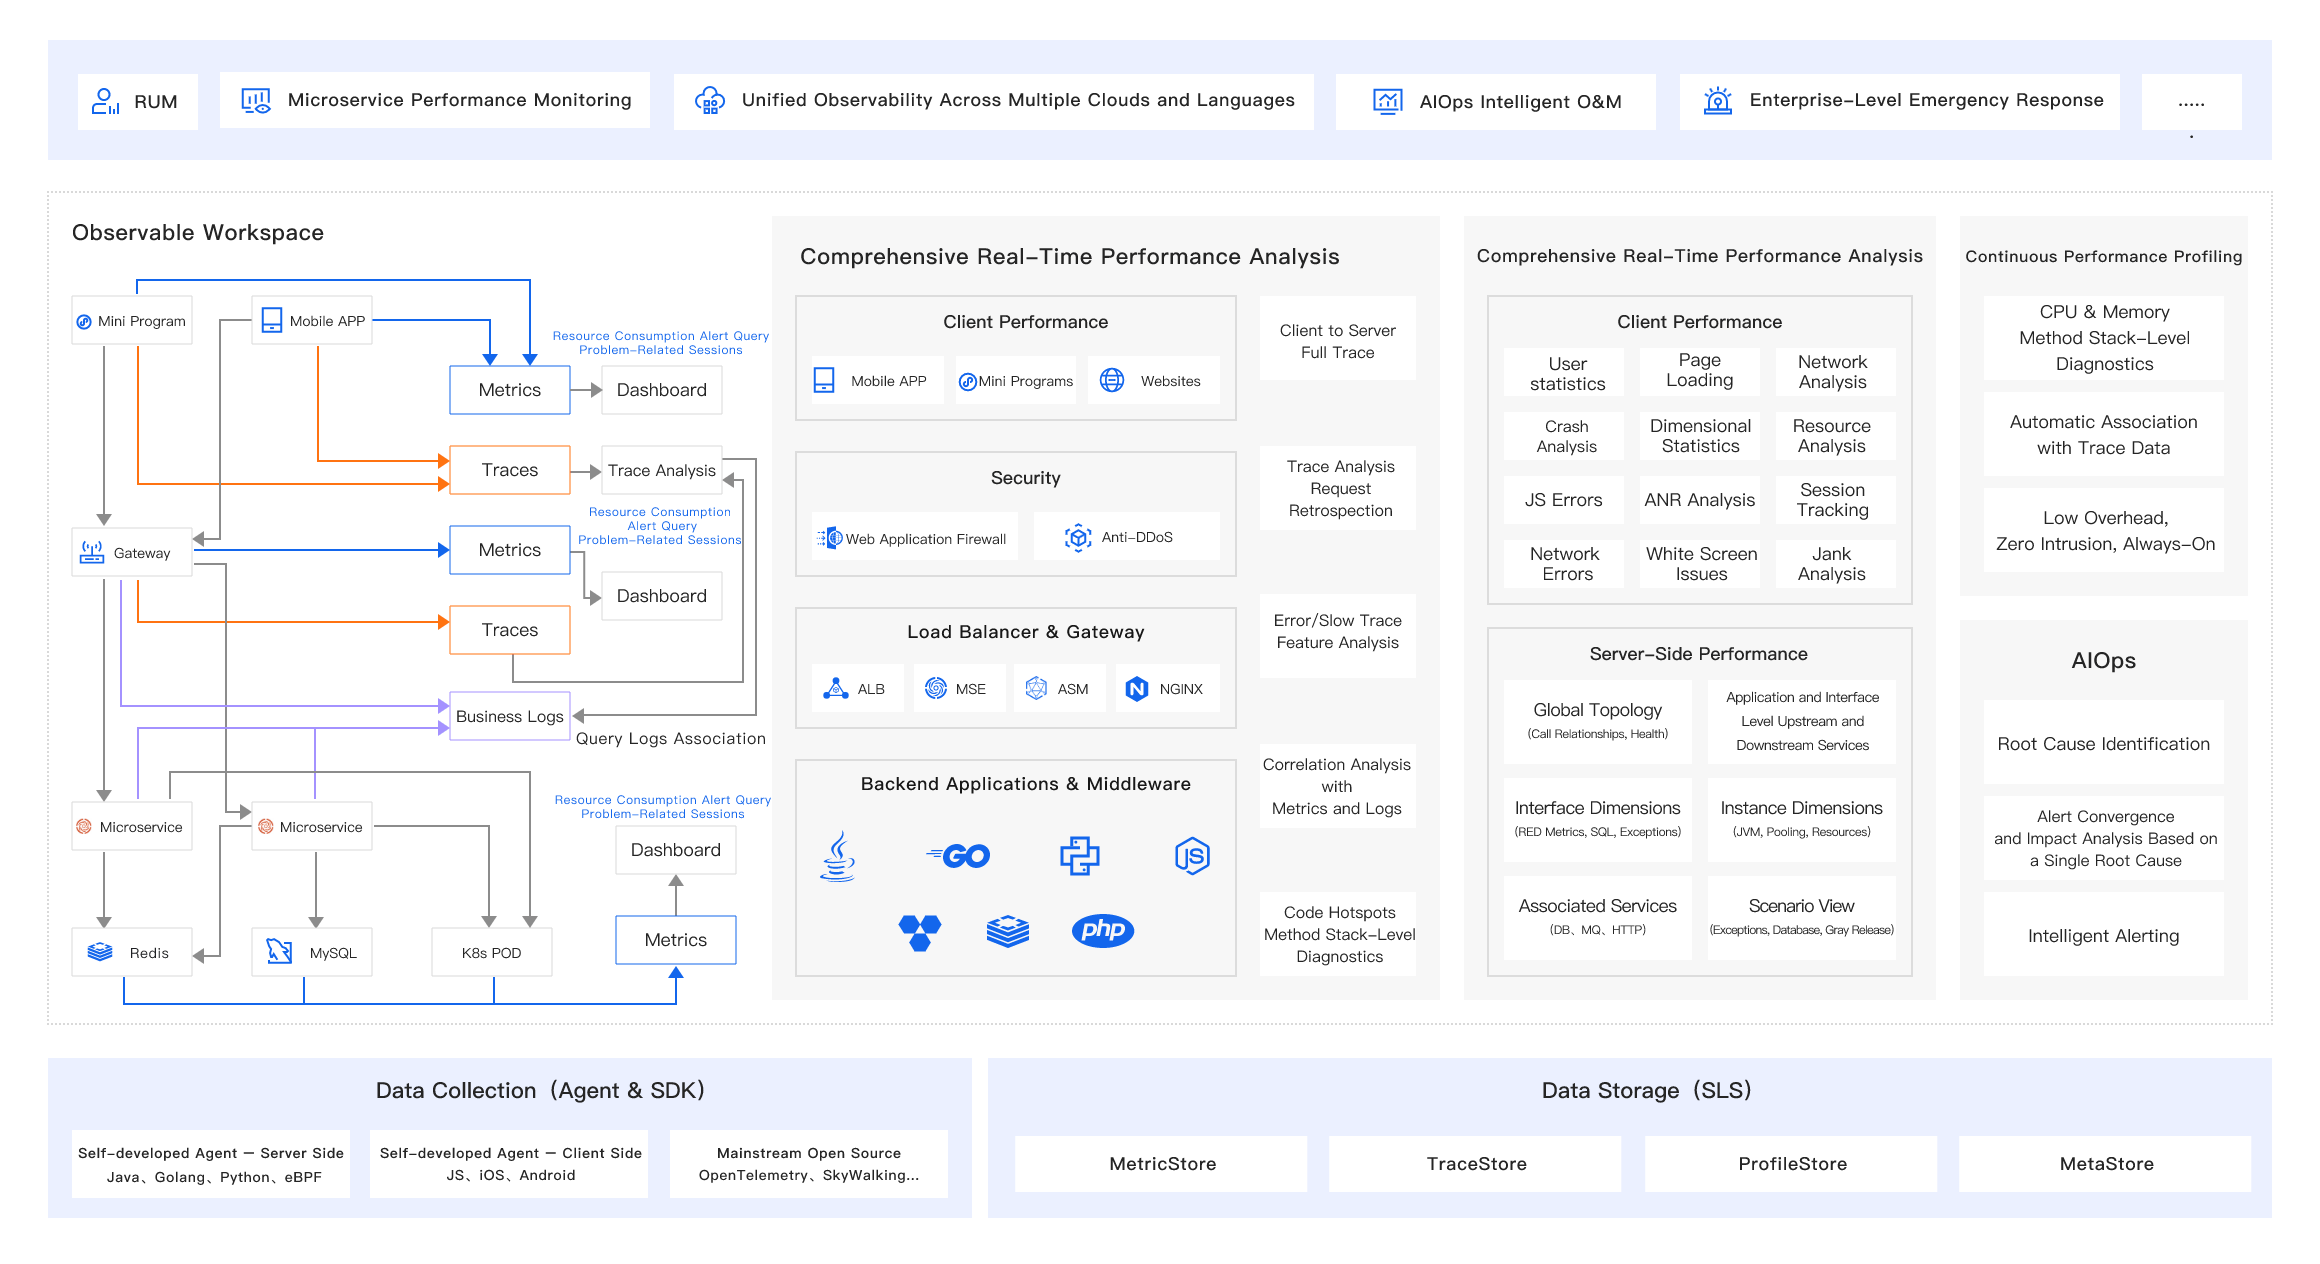
As a one-stop application performance monitoring platform, ARMS includes sub-services such as Real User Monitoring (RUM), Application Monitoring, and Managed Service for OpenTelemetry. It covers terminal applications of various types including web, HTML5, mini programs, PC, mobile apps, and server-side applications developed in languages like Java, Go, Python, supporting distributed and microservices architectures. ARMS meets the performance monitoring needs of applications across different languages, architectures, and deployment environments. With unified observability based on full-stack application performance data, end-to-end tracing analysis, and continuous code-level profiling capabilities, along with AI-driven alert convergence, fault insight, and impact analysis based on large language models (LLMs), it efficiently and accurately identifies and locates abnormal root causes. Additionally, it fully supports industry open standards like OpenTelemetry and Prometheus, enabling unified management and application of observability data to effectively enhance comprehensive insights and optimization of application performance.
Comprehensive Terminal Types and Development Languages Coverage
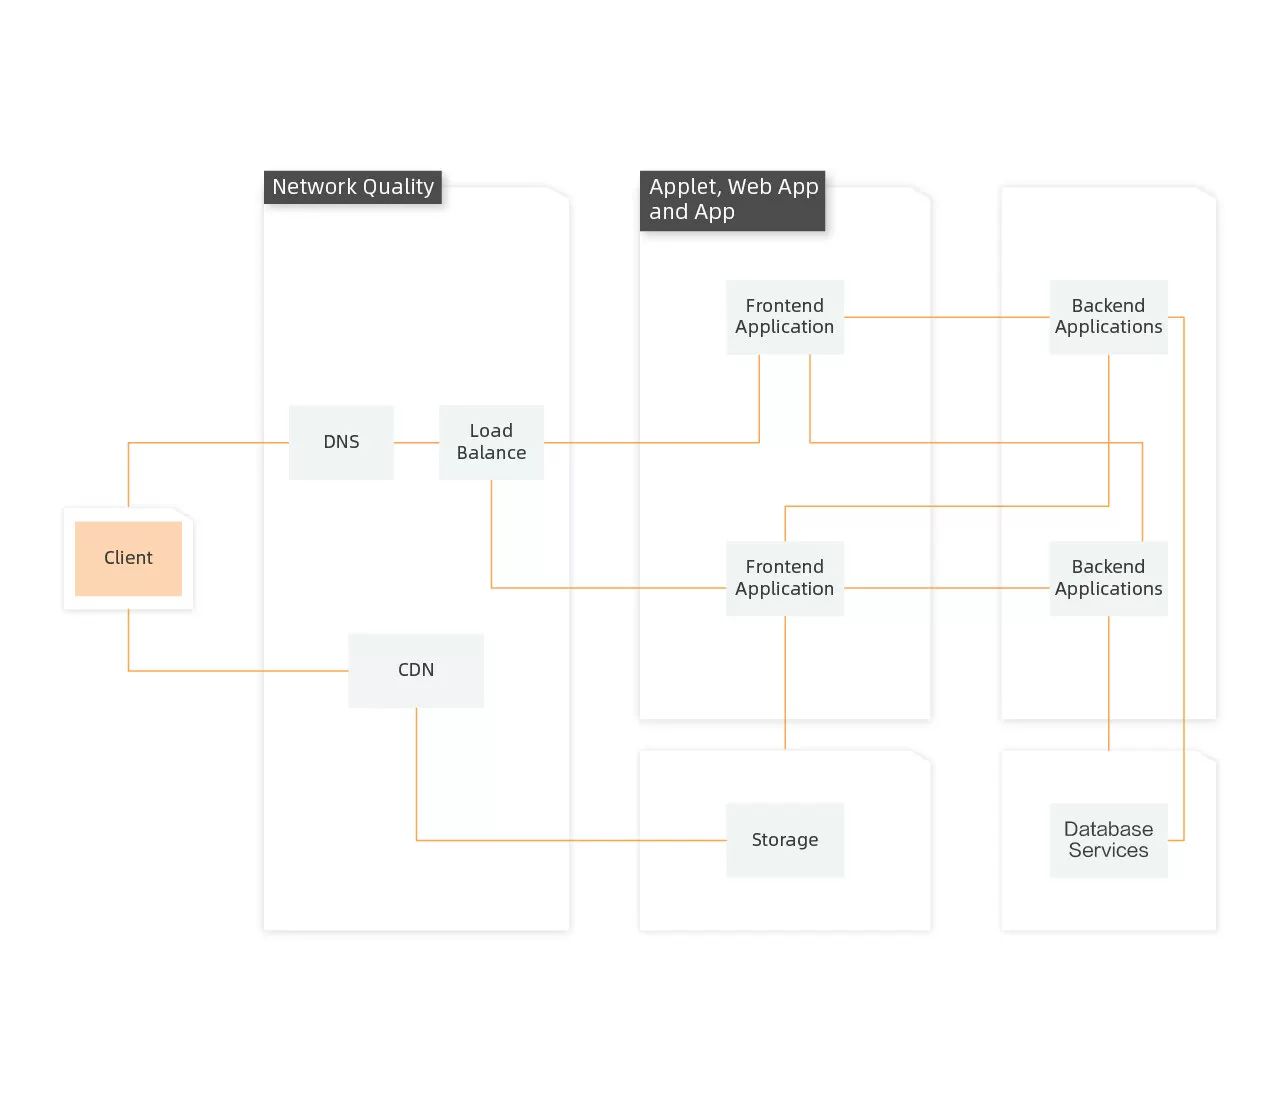
ARMS covers terminal applications of various types including web & HTML5, mini programs, PC, mobile apps, and server-side applications developed in languages like Java, Go, Python, supporting distributed and microservices architectures, and provides unified monitoring and analysis of full-stack application performance data from end to end.
End-to-End Full Trace Data Integration
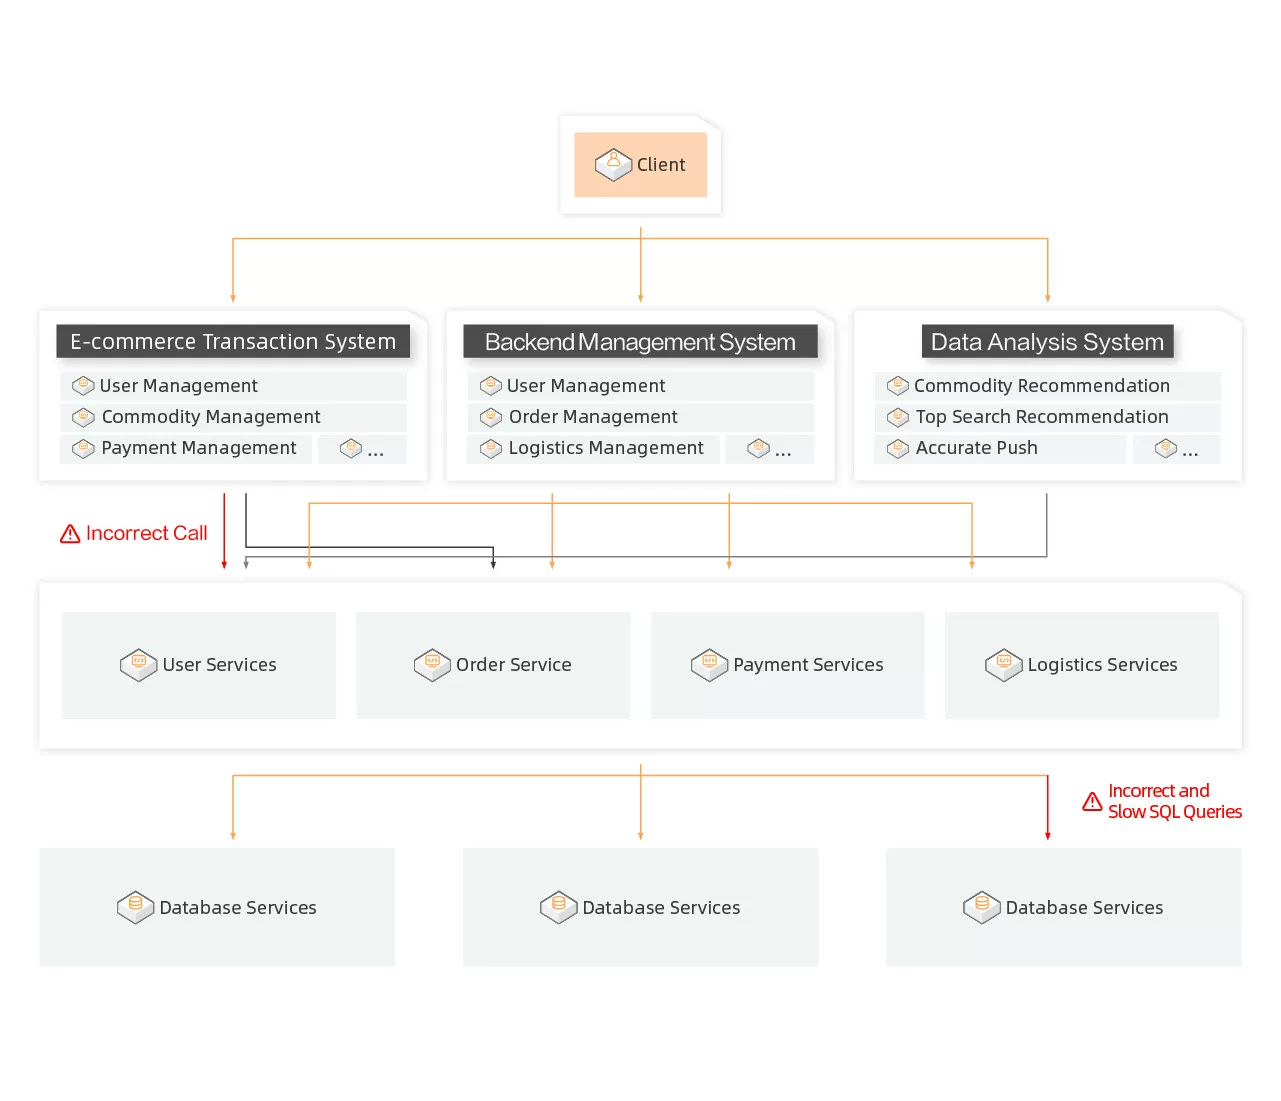
ARMS provides full collection and multi-dimensional analysis of end-to-end trace data, connecting front-end requests with back-end service call data for comprehensive fault root cause identification and efficiency improvement.
AIOps Intelligent Enhancement
AI-driven features based on LLMs, including alert convergence, fault insight, and impact analysis, help discover and locate abnormal root causes promptly. ARMS supports Copilot self-service exploration to deeply mine hidden performance bottlenecks.
Open Source Ecosystem Compatibility
ARMS is fully compatible with industry open standards like OpenTelemetry and Prometheus, enabling unified data management and application.
Panorama
Features
Real User Monitoring (RUM)
Data Collection
Supports easy integration for terminal applications such as web & HTML5, mini programs, and mobile apps. By integrating dependency packages into your front-end application projects and configuring initialization code, you can collect performance data from the client side without any additional instrumentation.
Web & HTML5 Application Monitoring
Provides performance data analysis capabilities including page access, resource loading, API request calls, and JS errors for browser pages and mobile HTML5 pages. It supports single-user session tracking to recreate real user operation scenarios, collecting problem stacks and context information to quickly trace the root cause of issues and efficiently resolve performance problems.
Application Performance Management (APM)
Data Collection
Supports easy integration for distributed and microservices architecture applications developed in languages such as Java, Go, Python, and is compatible with data reporting and importing in the OpenTelemetry format.
Application Overview
Provides various diagnostic tools including Application Overview, Application Topology, Trace Explorer, Instance GC & JVM Memory Monitoring, Continuous Profiling, Thread Analysis, Arthas Diagnostics, Exception Analysis, and Log Analysis. These tools meet common operational fault localization and performance bottleneck analysis scenarios.
Trace Explorer
Supports freely combining filtering conditions and aggregation dimensions based on stored full trace data for real-time analysis to meet customized diagnostic needs for different scenarios such as error/slow trace analysis and full-trace topology.
Continuous Profiling
Supports continuous profiling for effectively identifying bottlenecks in Java programs caused by CPU, memory, and I/O issues. It provides detailed statistics by method name, class name, and line number, ultimately assisting developers in optimizing programs, reducing latency, increasing throughput, and saving costs.
Intelligent Insights
Performs threshold periodic inspections on application performance metrics such as Response Time (RT), Error Count, and Queries Per Second (QPS) based on historical application data and combined with intelligent algorithms. It also provides specific root cause analysis and optimization suggestions based on LLMs.
Open Source Reporting
Managed Service for OpenTelemetry supports integration through open-source OpenTelemetry Agent/SDK, Jaeger SDK/Agent, Zipkin, and SkyWalking clients. Data can be reported directly or forwarded via the OpenTelemetry Collector to Managed Service for OpenTelemetry, significantly reducing the cost of application monitoring integration.
Application Security
Application Security
Safeguards applications against various security threats including but not limited to SQL injection, malicious file read/write, malicious file upload, command execution, arbitrary file reading, malicious outbound connections, thread injection, malicious DNS queries, and memory horse injection by utilizing Runtime Application Self-Protection (RASP) technology.
Sub-services
ARMS - Application Monitoring
For Java, Go, and Python applications
Features
-
![]() Satisfies requirements for Java, Go, and Python applications.
Satisfies requirements for Java, Go, and Python applications.
-
![]() Monitors application performance at code level to facilitate tracing analysis.
Monitors application performance at code level to facilitate tracing analysis.
-
![]() Provides continuous profiling and intelligent diagnosis capabilities.
Provides continuous profiling and intelligent diagnosis capabilities.
 Satisfies requirements for Java, Go, and Python applications.
ARMS - Managed Service for OpenTelemetry
For applications like .NET, Node.js, PHP, and C++
Features
-
![]() Meets requirements for applications like .NET, Node.js, PHP, and C++.
Meets requirements for applications like .NET, Node.js, PHP, and C++.
-
![]() Monitors application performance of various languages to facilitate tracing analysis.
Monitors application performance of various languages to facilitate tracing analysis.
-
![]() Compatible with open-source OpenTelemetry capabilities.
Compatible with open-source OpenTelemetry capabilities.
ARMS - Real User Monitoring
For clients like web applications, websites, and mini programs
Features
-
![]() Applies to mobile apps such as iOS and Android apps, web applications, and mini programs.
Applies to mobile apps such as iOS and Android apps, web applications, and mini programs.
-
![]() Supports session statistics and exception tracking.
Supports session statistics and exception tracking.
-
![]() Associates API requests with backend services.
Associates API requests with backend services.
Scenarios
Scenarios and Requirements
Provides performance monitoring and user experience analysis for web applications, websites, mini programs, and mobile apps.
Benefits
-
User Experience Analysis
Analyzes the key performance metrics of applications during network request initiation, page loading, and resource loading, and traces stack details for the exceptions that affect user experience, such as application crashes, Application Not Responding (ANR) errors, and stuttering issues. This helps locate the scope of the impacts that may be caused by these exceptions and improve user experience and application performance.
-
Tracing Analysis
Associates API requests with backend services, and allows you to analyze the traces between frontend requests and backend services to identify the performance bottlenecks of network requests.
Scenarios and Requirements
Provides performance monitoring and tracing analysis for multi-language, distributed, and microservices applications. Multiple programming languages such as Java, PHP, and Node.js are supported.
Benefits
-
Multiple Programming Languages and Access Methods
Provides multiple access methods for different deployment environments such as ECS instances, serverless architectures, and containers, and supports multiple programming languages including Java, PHP, and Node.js.
-
Global Topology
Displays the health status of applications, services, and servers, displays the upstream and downstream dependencies of applications, and allows you to quickly identify the services that caused failures, applications affected by the failures, and associated servers.
-
Application Details
Monitors JVMs, thread pools, servers, and pods to identify service exceptions at the earliest opportunity.
-
Application Diagnostics
Provides capabilities such as real-time diagnostics, exception analysis, log analysis, and Arthas diagnostics to quickly identify root causes.
-
End-to-End Tracing Analysis
Allows you to analyze the stored full trace data in real time based on filter conditions or aggregation dimensions. This way, the requirements for custom diagnostics in various scenarios can be met.


