Application Real-Time Monitoring Service (ARMS) has introduced new billing rules. You are charged based on the observability data or enabled features. This topic describes the billing modes, billable items, and billing cycles of different sub-services.
This billing plan is available to all new ARMS users. Existing users can switch to this model by using the billing change wizard in the console. If you have any questions, join the DingTalk group (group ID: 37120013838) for assistance.
Billing modes and billable items
If you use the pay-as-you-go billing method, you are charged based on the observability data or enabled features.
By ingestion data volume
Savings plans are not supported. To use a savings plan, submit a ticket.
Sub-service | Billable item | Monthly free tier | Free storage (days) | Price | Rule |
Application Monitoring | Metric | 50 GB | 90 |
| |
Trace | 30 | ||||
Profiling | 7 | ||||
Managed Service for OpenTelemetry | Metric ① | 50 GB | 90 |
| |
Trace | 30 | ||||
Profiling | 7 | ||||
Managed Service for Prometheus | Standard Edition metric ② | 50 GB | 90 |
| |
Ultimate Edition metric ② | 180 |
|
The ingestion data volume is the data stored in the ARMS platform after processing, such as cleaning, aggregation, conversion, and analysis, not the raw traffic reported by ARMS agents or open-source agents/SDKs.
This billing model includes a free storage period for each data type. These storage periods are fixed and cannot be modified.
The free tier is granted at the Alibaba Cloud account level upon activating a paid plan, and is shared across different applications/instances of sub-services under the account.
The monthly free tier for Managed Service for Prometheus cannot be used across regions. For example, if you first use the product in the China (Hangzhou) region, the free tier is automatically allocated to that region.
The monthly free tier for Application Monitoring/Managed Service for OpenTelemetry can be used across regions and is deducted based on the billing order of the region or application; the first item billed receives the deduction.
①Starting from 00:00 on July 1, 2024, Managed Service for OpenTelemetry bills for its default performance statistics metrics. Custom metrics are billed based on their ingestion data volume. All metrics share the 25 GB monthly free tier of Managed Service for OpenTelemetry.
The free tiers for metrics and traces in Application Monitoring/Managed Service for OpenTelemetry cannot be transferred or combined. For example, if you ingest 40 GB of trace data and 5 GB of metric data in a single month, you will be billed for 15 GB of trace data, and you forfeit the remaining free tier for metrics.
②Managed Service for Prometheus provides basic metrics and custom metrics.
You can store the basic metrics of Container Service for Kubernetes (ACK) clusters for seven days free of charge. The default storage duration of custom metrics cannot be modified. For more information about basic metrics, see Metrics.
Custom metrics refer to non-basic metrics. You are charged based on the ingestion data volume for custom metrics.
Profiling data consists of files generated by Continuous Profiling and Application Diagnosis, which include memory snapshots, performance analysis flame graphs, and thread status and call stack information from thread analysis.
For Application Monitoring/Managed Service for OpenTelemetry, the minimum daily usage for each billable data type per application is 0.1 GB. For example, if an application uses 20 MB of metrics, 10 MB of traces, and 0 MB of profiling data in a day, it is billed for 0.1 GB of metrics, 0.1 GB of traces, and 0 GB of profiling data.
For Managed Service for Prometheus, the minimum daily usage for each instance is 0.1 GB per day. For example, if an instance collects 20 MB of metric data in a day, it is billed for 0.1 GB of metrics.
By observability feature
Sub-service | Billable item | Monthly free tier | Price (Chinese mainland) | Rule |
Application Security | Agent | None | USD 0.015/Agent/Hour | |
Managed Service for Grafana | Number of managed workspaces |
| As low as USD 37.74/dedicated workspace/per month |
If you are charged based on the enabled features, free quotas are automatically provided for your Alibaba Cloud account.
Billing cycle
The billing cycle of ARMS is one day. ARMS generates the bills of the previous day at 00:00 every day. Generally, bills are generated before 08:00. If your Alibaba Cloud account has sufficient balance, the system deducts fees from the balance. You can view bills in the Expenses and Costs console and view resource usage in the ARMS console.
View data volume
You can view data volume on the Usage Statistics tab of the Overview page in the ARMS console.
Set the usage limit
Both ARMS and Managed Service for OpenTelemetry charge fees based on the actual amount of observability data written to the system. You can set an upper limit for the ingestion data volume.
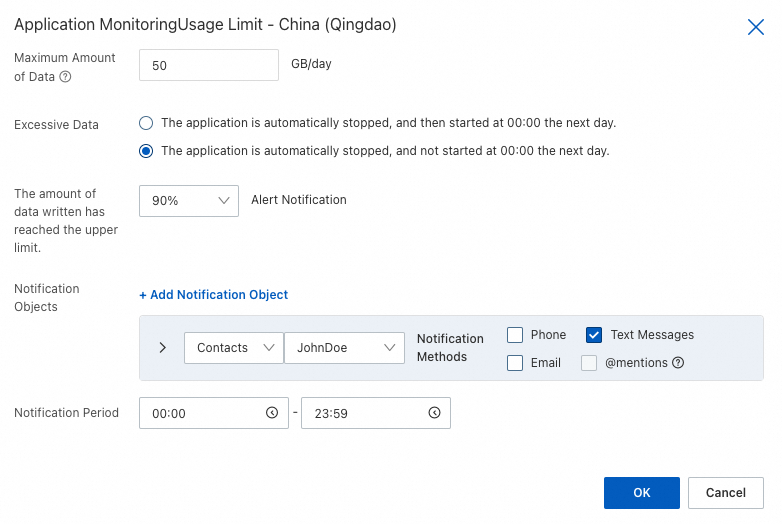
On the Usage Statistics page, find the product that you want to manage in the corresponding region, and click Configure Quota in the Actions column. In the dialog box that appears, set the Maximum Amount of Data parameter, and set the Notification Objects and Notification Period parameters when the maximum amount of data is configured.
Parameter | Description |
Maximum Amount of Data | The maximum amount of data that can be written to ARMS metrics per day. Unit: GB. |
Excessive Data |
|
The amount of data written has reached the upper limit. | An alert notification is triggered when the ingestion data reaches a specified percentage of the upper limit. |
Notification Objects | For information about how to create notification objects, see Notification objects. |
Notification Period | The period during which an alert notification is sent. |
Estimate fees
Estimate fees based on data volume
If you have not monitored an application in ARMS, connect a test application to ARMS. Then, you can view data volume on the Usage Statistics tab of the Overview page to estimate the overall cost.
If you have applications monitored in ARMS, directly view data volume on the Usage Statistics tab of the Overview page to estimate the overall cost.
Assume that you use Application Monitoring to monitor your applications. In a month, applications deployed in the China (Hangzhou) region generate 1,000 GB of observability data and applications deployed in the China (Beijing) region generate 800 GB of observability data. Considering that you have a 50-GB free quota per month, the fee of the month is calculated based on the following formula: USD 0.062 × (1,000 + 800 - 50) = USD 108.5.
Estimate fees based on the business scale
You can estimate fees based on the following data models. Estimated fees are not accurate, and are for reference only.
Application Monitoring
Assume that queries per second (QPS) are 100, sampling rate is 10%, convergence is enabled for interface metrics, and profiling is disabled. Each agent collects about 2 GB of data. The following table lists the differences between previous and current prices.
Application scale | Estimated monthly data volume | Current price (pay-as-you-go) | Previous price (pay-as-you-go) | Previous price (resource plan) (The purchase method below is for reference only. You can enjoy a higher discount by purchasing a resource plan with higher specifications based on your business requirements.) |
Small (50 nodes = 50 agents) | 3,000 GB | USD 186/month | USD 1,490.4/month 88% costs saved | USD 776/month, 76% costs saved Two 28,800 Agent × Hour resource plans that cost USD 1,241.9 are required. |
Medium (200 nodes = 200 agents) | 12,000 GB | USD 744/month | USD 5,961.6/month 88% costs saved | USD 2,328.57/month, 68% costs saved One 230,400 Agent × Hour resource plan that costs USD 3,725.71 is required. |
Large (500 nodes = 500 agents) | 30,000 GB | USD 1,860/month | USD 14,904/month 88% costs saved | USD 4,657/month, 60% costs saved Two 230,400 Agent × Hour resource plans that cost USD 7,451.42 are required. |
Managed Service for OpenTelemetry
In the new billing rules, you are charged for Managed Service for OpenTelemetry based on the volume of observability data that is written. The average size of a span is 1.27 KB. Assume that 0.1 billion spans are generated each day, and spans are stored for 30 days. The following table describes the comparison between the daily fees calculated based on the new and previous versions of billing rules.
Business scale | Estimated daily data volume | Pay-as-you-go fee based on the new billing rules | Pay-as-you-go fee based on the previous billing rules | Cost down by |
0.1 billion spans stored for 30 days | 121 GB | USD 7.5 per day | USD 10.75 per day | 30% |
In the new billing rules of Managed Service for OpenTelemetry, you are not separately charged the reporting fee, storage fee for traces, and storage fee for each metric.
Managed Service for Prometheus
Assume that the average size of a metric entry is 0.5 KB. The following table lists the differences between previous and current prices of Managed Service for Prometheus.
Number of reported metric entries per day | Estimated daily data volume | Previous price (pay-as-you-go) | Current price (pay-as-you-go) | Cost saved |
0 - 50 million | 0 - 25 GB | 0 - USD 1.55/day | 0 - USD 6.299/day | 75% |
50 million - 150 million | 25 GB - 75 GB | USD 1.55 - USD 4.65/day | USD 6.299 - USD 16.535/day | 71% - 75% |
150 million - 300 million | 75 GB -150 GB | USD 4.65 - USD 9.3/day | USD 16.535 - USD 29.528/day | 68% - 71% |
300 million - 600 million | 150 GB - 300 GB | USD 9.3 - USD 18.6/day | USD 29.528 - USD 50.787/day | 63% - 76% |
600 million - 1200 million | 300 GB - 600GB | USD 18.6 - USD 37.2/day | USD 50.787 - USD 83.858/day | 55% - 63% |
More than 1200 million | More than 600 GB | More than USD 37.2/day | More than USD 83.858/day | 55% |