
お知らせと更新情報
アプリケーションモニタリングと Managed Service for OpenTelemetry で、月間 50 GB の無料枠を提供開始しました。リアルユーザーモニタリング (RUM) では、月間 100 Observability Compute Units (OCU) の無料枠を利用できます。
詳細を見る >ARMS の Go 向けエージェント機能がアップグレードされ、パフォーマンスプロファイリングに対応しました。CPU、メモリ、I/O に起因する Go アプリケーションのボトルネックを効果的に診断します。
詳細を見る >アプリケーションログとのトレース関連付けで、StoreView タイプの Simple Log Service (SLS) データセットに対応しました。アプリケーションログが複数の Logstore に出力される場合でも、統合的な相関クエリが可能です。
詳細を見る >フルスタックモニタリングシステムの構築
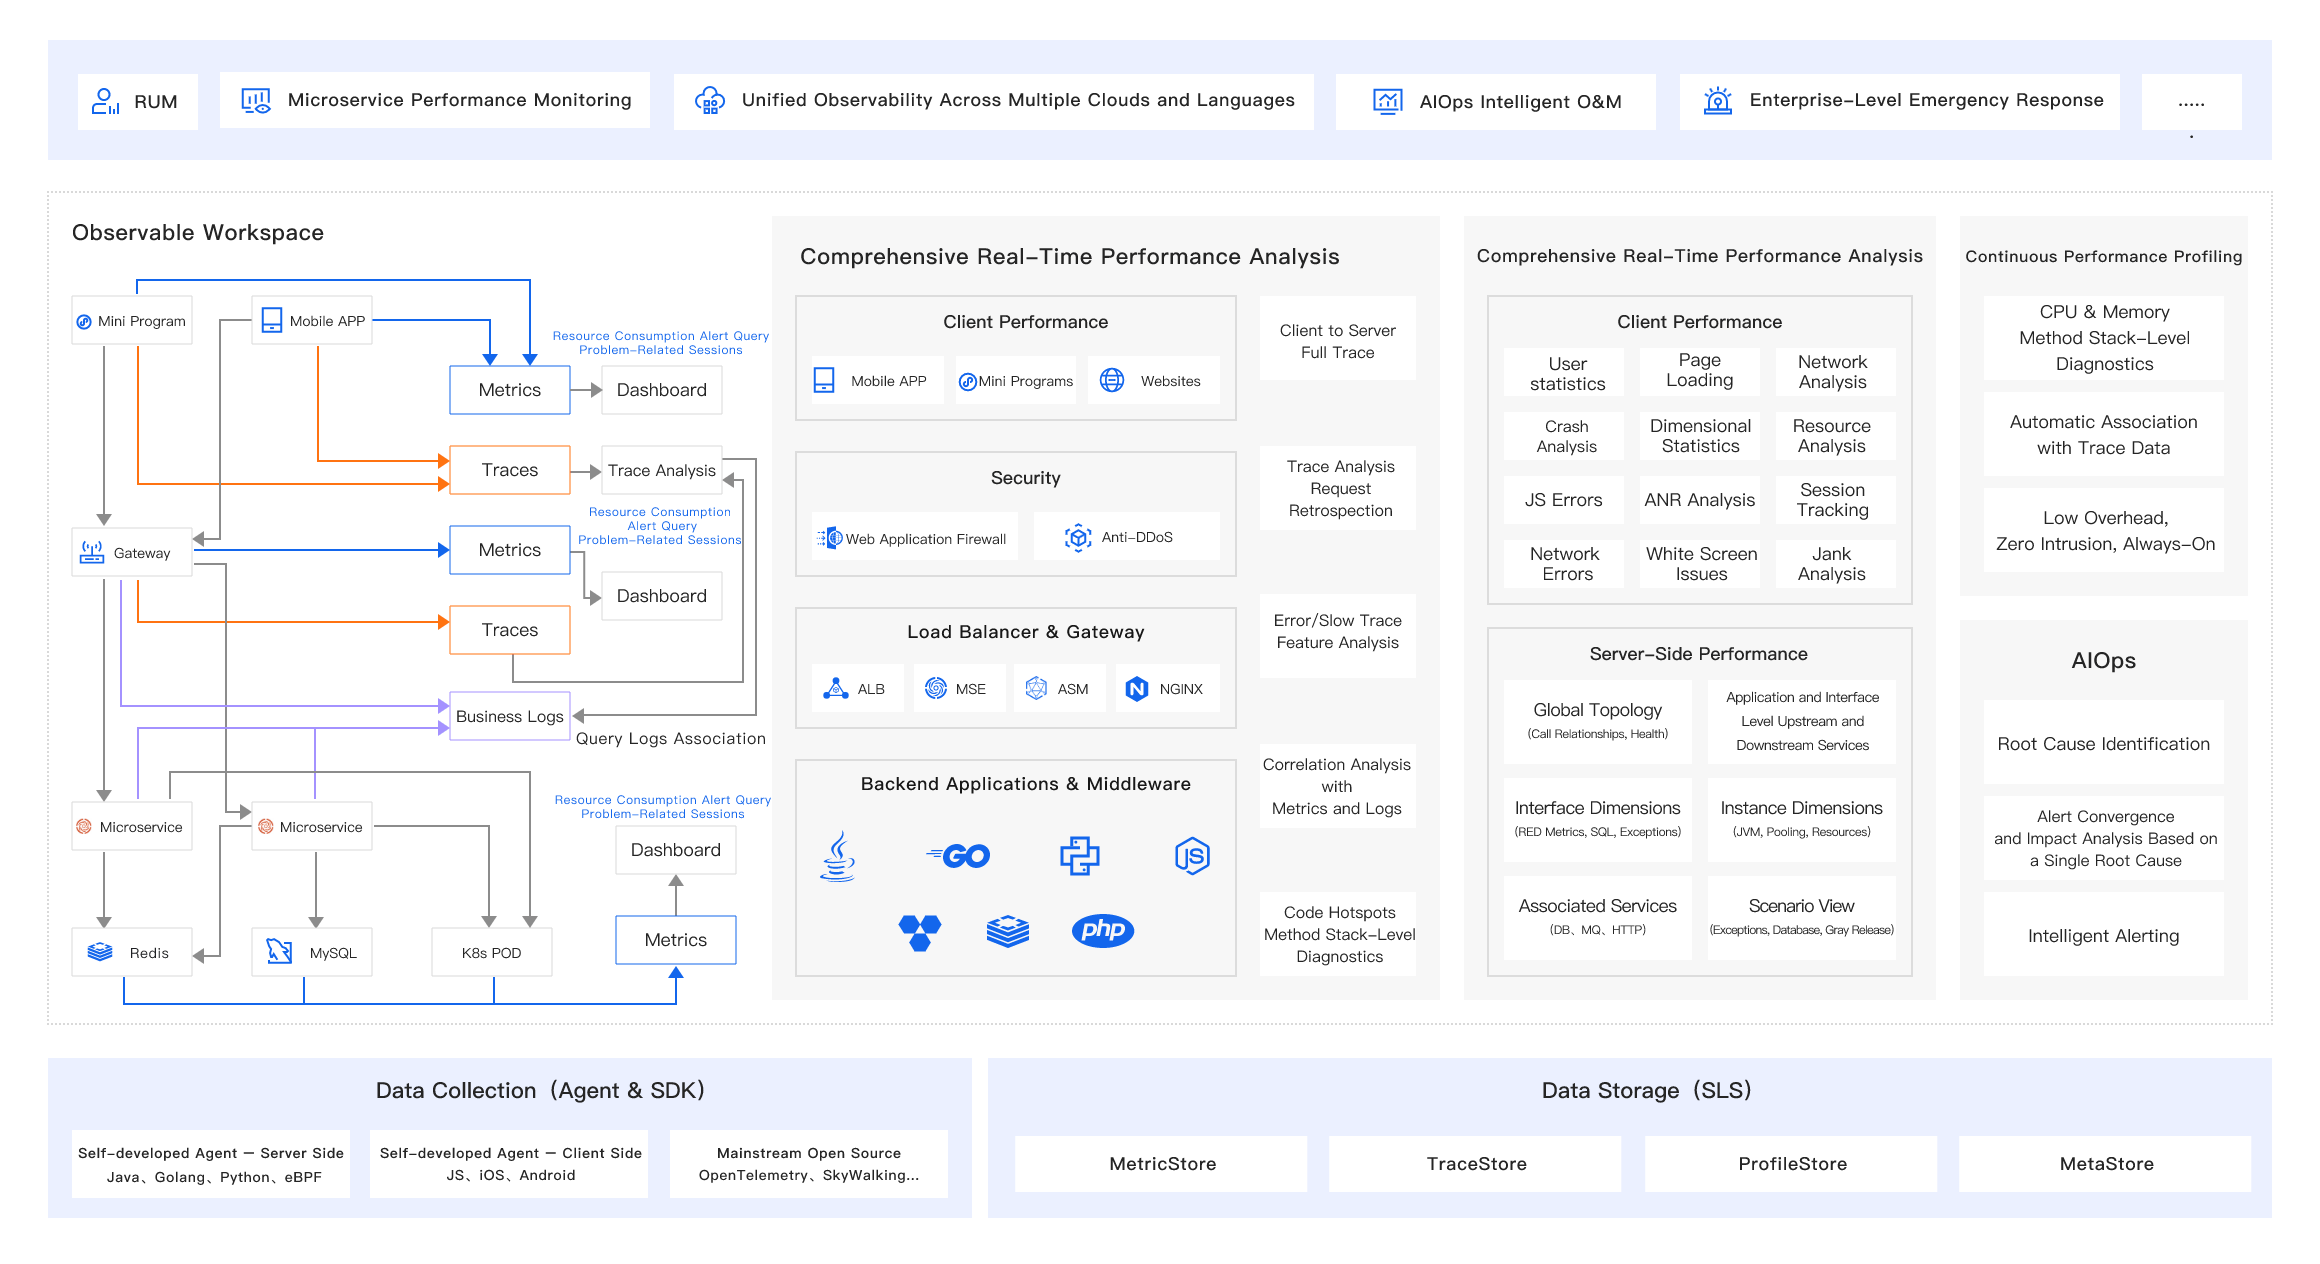
ワンストップのアプリケーションパフォーマンスモニタリングプラットフォームとして、ARMS はリアルユーザーモニタリング (RUM)、アプリケーションモニタリング、Managed Service for OpenTelemetry などのサブサービスを提供します。Web、HTML5、ミニプログラム、PC、モバイルアプリ、Java、Go、Python などの言語で開発されたサーバーサイドアプリケーションなど、さまざまな端末タイプをカバーし、分散アーキテクチャやマイクロサービスアーキテクチャに対応しています。ARMS は、異なる言語、アーキテクチャ、デプロイ環境にわたるアプリケーションのパフォーマンスモニタリングニーズを満たします。フルスタックのアプリケーションパフォーマンスデータに基づく統合オブザーバビリティ、エンドツーエンドのトレーシング分析、継続的なコードレベルのプロファイリング機能に加え、大規模言語モデル (LLM) に基づく AI 駆動のアラート収束、障害インサイト、影響分析により、異常の根本原因を効率的かつ正確に特定します。さらに、OpenTelemetry や Prometheus などの業界オープン標準に完全に対応し、オブザーバビリティデータの統合管理と活用を通じて、アプリケーションパフォーマンスの包括的な分析と最適化を実現します。
包括的な端末タイプと開発言語のカバレッジ
ARMS は Web、HTML5、ミニプログラム、PC、モバイルアプリ、Java、Go、Python などの言語で開発されたサーバーサイドアプリケーションなど、さまざまな端末タイプをカバーし、分散アーキテクチャやマイクロサービスアーキテクチャに対応しています。エンドツーエンドでフルスタックのアプリケーションパフォーマンスデータを統合的にモニタリング・分析します。
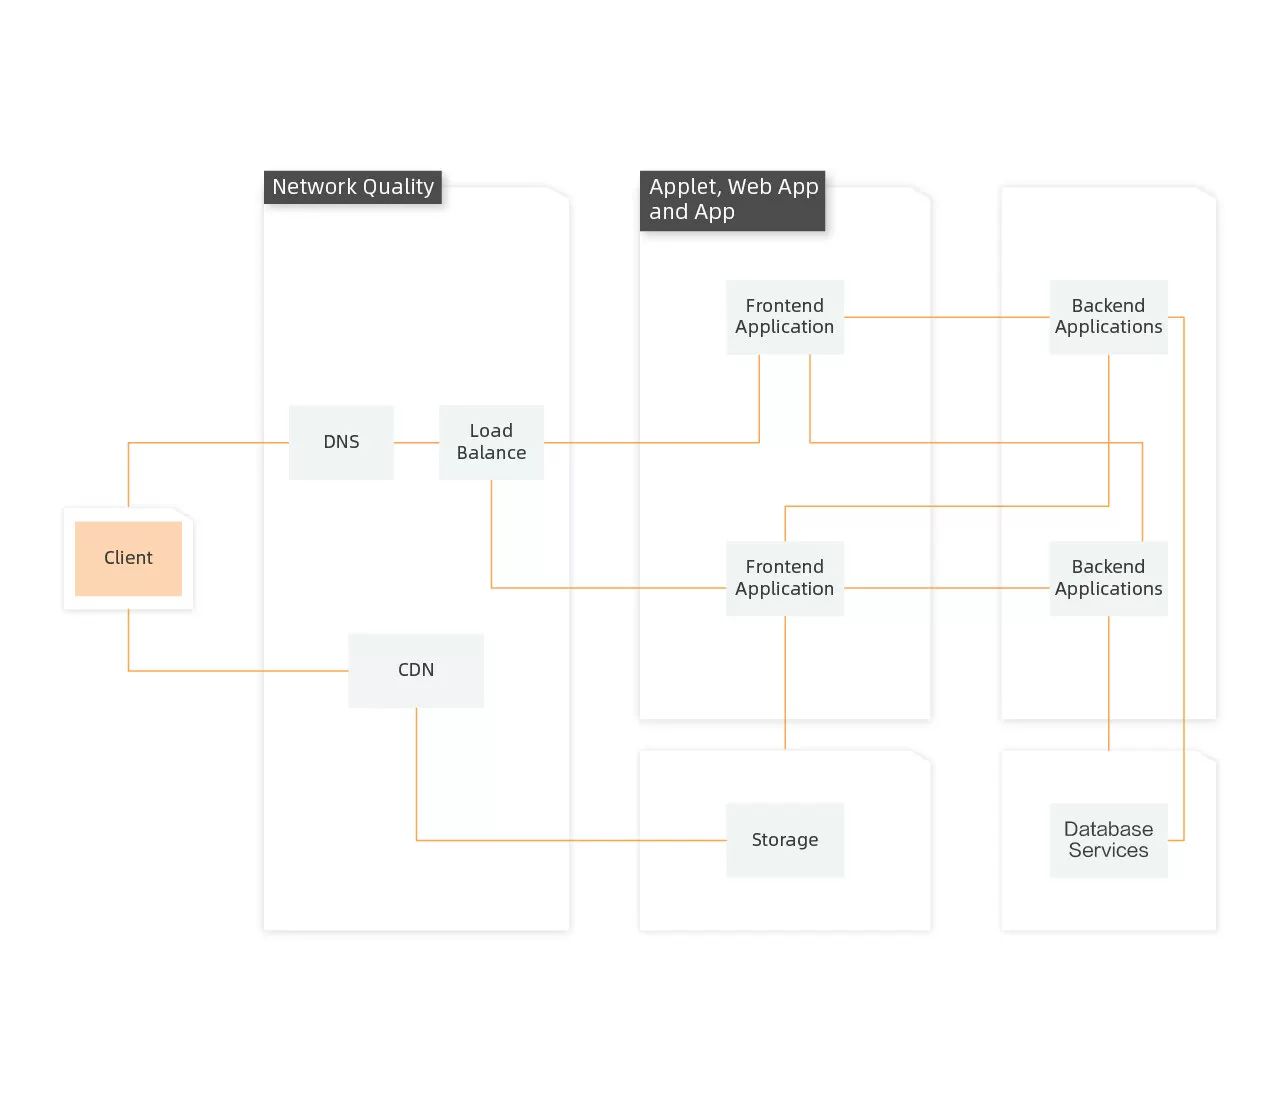
エンドツーエンドの全トレースデータ統合
ARMS はエンドツーエンドのトレースデータを全量収集し、多次元で分析します。フロントエンドのリクエストとバックエンドのサービスコールデータを接続することで、障害の根本原因を包括的に特定し、効率を向上させます。
AIOps インテリジェント強化
LLM に基づく AI 駆動機能として、アラート収束、障害インサイト、影響分析を提供し、異常の根本原因を迅速に発見・特定します。ARMS は Copilot によるセルフサービス探索をサポートし、潜在的なパフォーマンスボトルネックを深く掘り下げます。
オープンソースエコシステムの互換性
ARMS は OpenTelemetry や Prometheus などの業界オープン標準に完全に対応しており、オブザーバビリティデータの統合管理と活用を実現します。
パノラマ
機能
リアルユーザーモニタリング (RUM)
データ収集
Web & HTML5、ミニプログラム、モバイルアプリなどのターミナルアプリケーションに簡単に統合できます。依存パッケージをフロントエンドアプリケーションプロジェクトに組み込み、初期化コードを設定するだけで、追加の計装なしにクライアント側のパフォーマンスデータを収集できます。
Web & HTML5 アプリケーションモニタリング
ブラウザページやモバイル HTML5 ページにおけるページアクセス、リソース読み込み、API リクエスト、JS エラーなどのパフォーマンスデータ分析機能を提供します。シングルユーザーセッショントラッキングにより、実際のユーザー操作シナリオを再現し、問題のスタックやコンテキスト情報を収集して、根本原因の迅速な特定とパフォーマンス問題の効率的な解決を支援します。
アプリケーションパフォーマンス管理 (APM)
データ収集
Java、Go、Python などの言語で開発された分散アプリケーションやマイクロサービスアーキテクチャのアプリケーションに簡単に統合でき、OpenTelemetry 形式でのデータレポートとインポートに対応しています。
アプリケーション概要
アプリケーション概要、アプリケーショントポロジー、トレースエクスプローラー、インスタンス GC & JVM メモリモニタリング、継続的プロファイリング、スレッド分析、Arthas 診断、例外分析、ログ分析など、さまざまな診断ツールを提供します。これらのツールにより、一般的な運用障害の特定やパフォーマンスボトルネックの分析に対応できます。
トレースエクスプローラー
蓄積された全トレースデータに基づき、フィルタリング条件や集約ディメンションを自由に組み合わせたリアルタイム分析に対応します。エラー / スロートレース分析やフルトレーストポロジーなど、さまざまなシナリオのカスタム診断ニーズを満たします。
継続的プロファイリング
CPU、メモリ、I/O に起因する Java プログラムのボトルネックを効果的に特定する継続的プロファイリングに対応します。メソッド名、クラス名、行番号ごとの詳細な統計情報を提供し、開発者によるプログラムの最適化、レイテンシの削減、スループットの向上、コスト削減を支援します。
インテリジェントインサイト
過去のアプリケーションデータとインテリジェントアルゴリズムを組み合わせ、レスポンスタイム (RT)、エラー数、1 秒あたりのクエリ数 (QPS) などのアプリケーションパフォーマンスメトリクスに対するしきい値定期検査を実行します。また、LLM に基づく具体的な根本原因分析と最適化の提案も提供します。
オープンソースレポーティング
Managed Service for OpenTelemetry は、オープンソースの OpenTelemetry Agent/SDK、Jaeger SDK/Agent、Zipkin、SkyWalking クライアントを通じた統合に対応しています。データを直接レポートするか、OpenTelemetry Collector を経由して Managed Service for OpenTelemetry に転送でき、アプリケーションモニタリング統合のコストを大幅に削減します。
アプリケーションセキュリティ
アプリケーションセキュリティ
Runtime Application Self-Protection (RASP) 技術を活用し、SQL インジェクション、悪意のあるファイル読み書き、悪意のあるファイルアップロード、コマンド実行、任意のファイル読み取り、悪意のある外部接続、スレッドインジェクション、悪意のある DNS クエリ、メモリホースインジェクションなど、さまざまなセキュリティ脅威からアプリケーションを保護します。
サブサービス
ARMS - Application Monitoring
Java、Go、Python アプリケーション向け。
機能
-
![]() Java、Go、Python アプリケーションの要件に対応しています。
Java、Go、Python アプリケーションの要件に対応しています。
-
![]() コードレベルでアプリケーションパフォーマンスをモニタリングし、トレーシング分析を支援します。
コードレベルでアプリケーションパフォーマンスをモニタリングし、トレーシング分析を支援します。
-
![]() 継続的プロファイリングとインテリジェントな診断機能を提供します。
継続的プロファイリングとインテリジェントな診断機能を提供します。
 Java、Go、Python アプリケーションの要件に対応しています。
ARMS - Managed Service for OpenTelemetry
.NET、Node.js、PHP、C++ などのアプリケーション向け。
機能
-
![]() .NET、Node.js、PHP、C++ などのアプリケーション要件に対応しています。
.NET、Node.js、PHP、C++ などのアプリケーション要件に対応しています。
-
![]() さまざまな言語のアプリケーションパフォーマンスをモニタリングし、トレーシング分析を支援します。
さまざまな言語のアプリケーションパフォーマンスをモニタリングし、トレーシング分析を支援します。
-
![]() オープンソースの OpenTelemetry 機能と互換性があります。
オープンソースの OpenTelemetry 機能と互換性があります。
ARMS - Real User Monitoring
Web アプリケーション、Web サイト、ミニプログラムなどのクライアント向け。
機能
-
![]() iOS や Android のモバイルアプリ、Web アプリケーション、ミニプログラムに対応しています。
iOS や Android のモバイルアプリ、Web アプリケーション、ミニプログラムに対応しています。
-
![]() セッション統計と例外トラッキングをサポートします。
セッション統計と例外トラッキングをサポートします。
-
![]() API リクエストとバックエンドサービスを関連付けます。
API リクエストとバックエンドサービスを関連付けます。
シナリオ
シナリオと要件
Web アプリケーション、Web サイト、ミニプログラム、モバイルアプリのパフォーマンスモニタリングとユーザー体験分析を提供します。
メリット
-
ユーザー体験分析
ネットワークリクエスト開始時、ページ読み込み時、リソース読み込み時のアプリケーションの主要パフォーマンスメトリクスを分析し、アプリケーションクラッシュ、Application Not Responding (ANR) エラー、スタッターなどユーザー体験に影響する例外のスタック詳細をトレースします。これにより、例外が及ぼす影響範囲を特定し、ユーザー体験とアプリケーションパフォーマンスを改善できます。
-
トレーシング分析
API リクエストとバックエンドサービスを関連付け、フロントエンドリクエストからバックエンドサービスまでのトレースを分析して、ネットワークリクエストのパフォーマンスボトルネックを特定できます。
シナリオと要件
多言語、分散、マイクロサービスアプリケーションのパフォーマンスモニタリングとトレーシング分析を提供します。Java、PHP、Node.js など複数のプログラミング言語に対応しています。
メリット
-
多言語対応と多様なアクセス方法
ECS インスタンス、サーバーレスアーキテクチャ、コンテナなど、さまざまなデプロイ環境に対応する複数のアクセス方法を提供し、Java、PHP、Node.js をはじめとする多言語をサポートします。
-
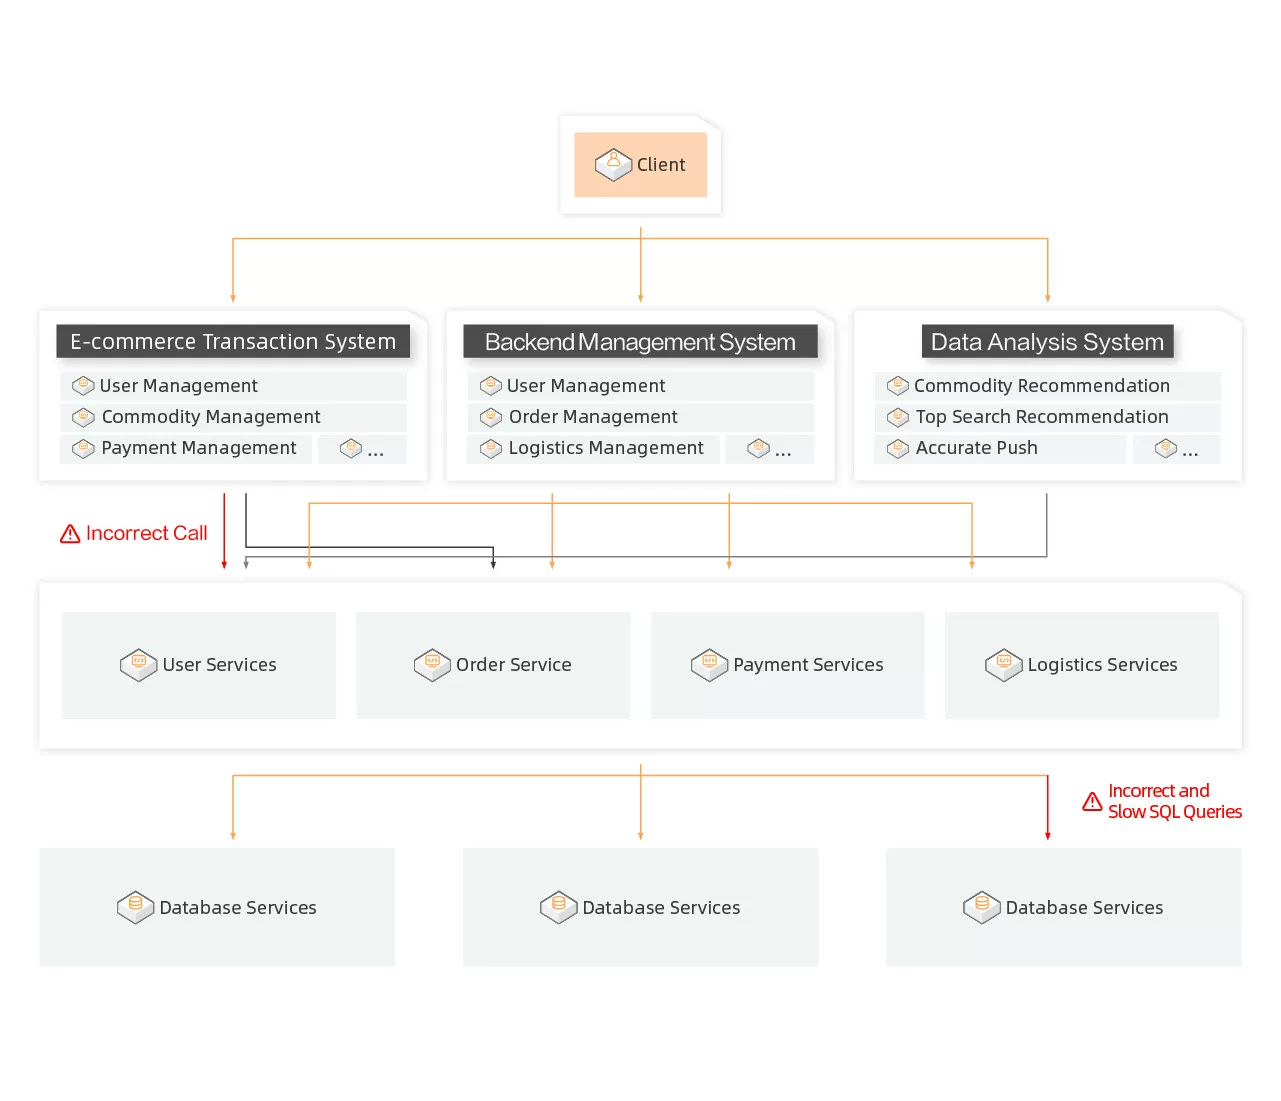
グローバルトポロジー
アプリケーション、サービス、サーバのヘルスステータスを表示し、アプリケーションの上流・下流の依存関係を可視化します。障害の原因となったサービス、影響を受けたアプリケーション、関連サーバを迅速に特定できます。
-
アプリケーション詳細
JVM、スレッドプール、サーバ、Pod をモニタリングし、サービス異常をいち早く検知します。
-
アプリケーション診断
リアルタイム診断、例外分析、ログ分析、Arthas 診断などの機能を提供し、根本原因を迅速に特定します。
-
エンドツーエンドトレーシング分析
フィルタ条件や集計ディメンションに基づいて、蓄積されたフルトレースデータをリアルタイムに分析できます。これにより、さまざまなシナリオでのカスタム診断要件に対応します。


