When a Go application experiences high latency, excessive memory consumption, or unexpected CPU spikes in production, standard metrics and logs rarely pinpoint the exact method or line of code responsible. Continuous profiling in ARMS Application Monitoring captures CPU, memory, and I/O bottleneck data at the method name, class name, and line number level, enabling you to optimize programs, reduce latency, increase throughput, and save costs without reproducing issues locally.
Prerequisites
Before you begin, make sure that you have:
-
A Go application monitored by Application Monitoring
-
ARMS agent for Go 1.3.0 or later. To check the version, open the application details page and choose
Enable continuous profiling
-
Log on to the ARMS console. In the left-side navigation pane, choose .
-
In the top navigation bar, select a region, then click the name of your application.
Icons in the Language column indicate the application language:
 : Java
 : Go
: Go : Python
Hyphen (-): application monitored in Managed Service for OpenTelemetry.
-
In the top navigation bar, choose .
-
In the Ongoing Profiling Settings section, turn on the Master switch and any additional profile-type switches as needed.
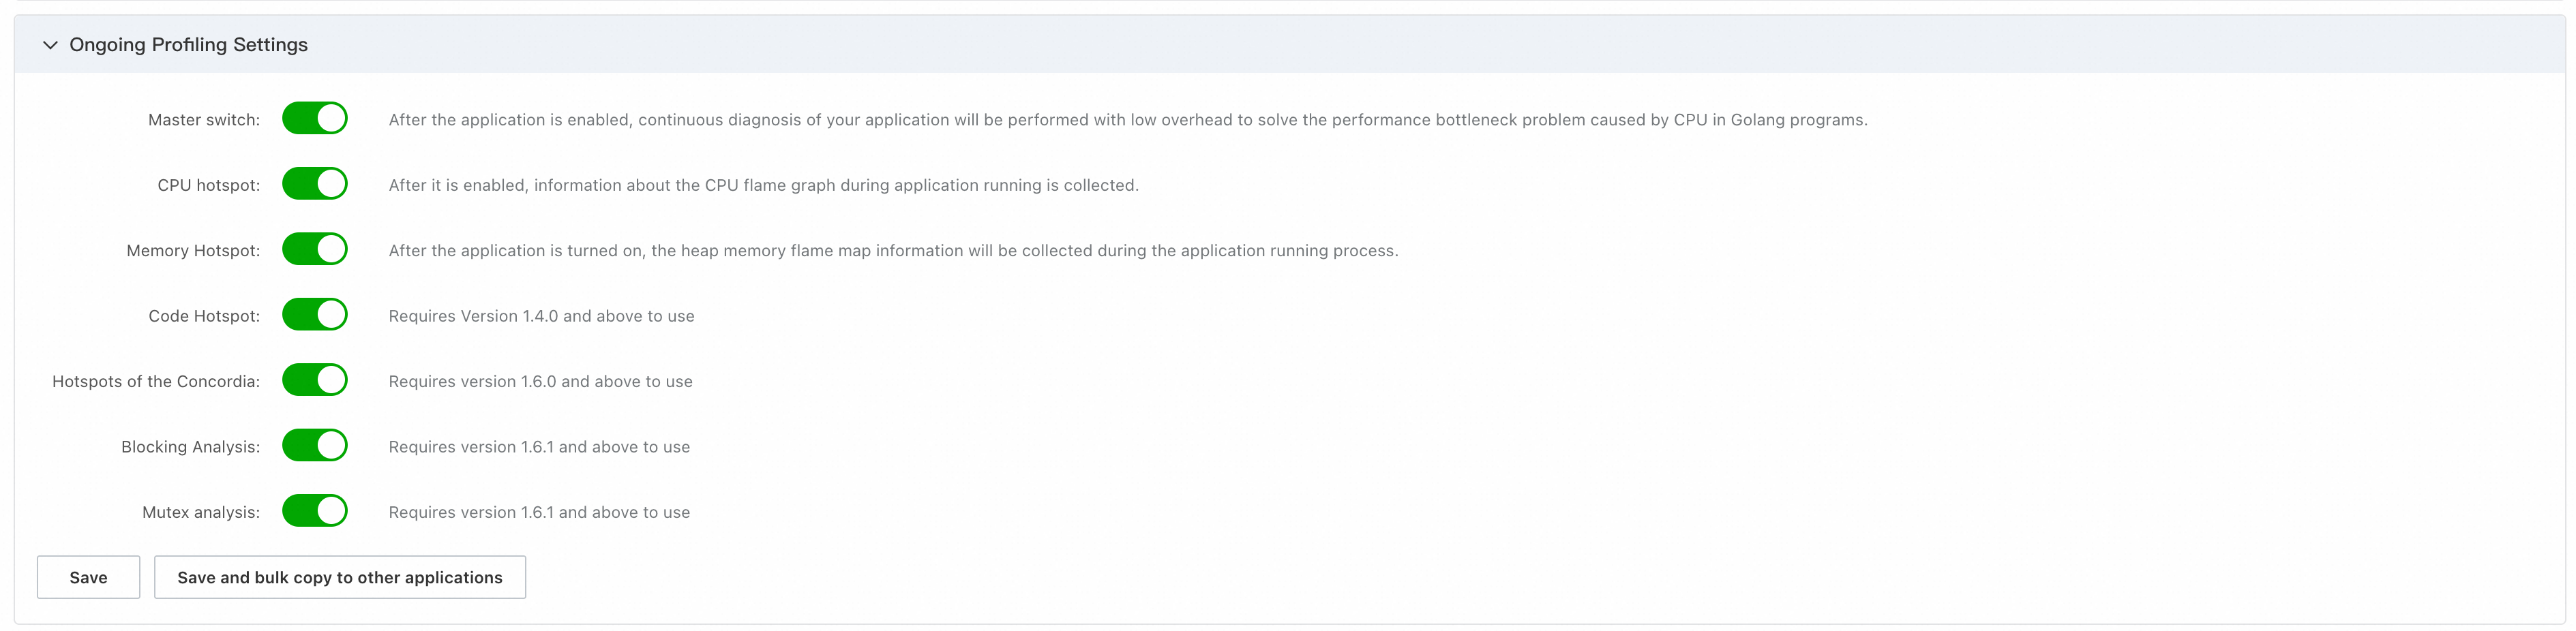
-
Click Save. Changes take effect within 2 minutes.
View and analyze profiling data
-
Log on to the ARMS console. In the left-side navigation pane, choose .
-
In the top navigation bar, select a region, then click the name of your application.
-
In the top navigation bar, choose .
In the instance list on the left, select a target instance. Then, on the right side of the page, set the time range for the data.
-
On the Single View tab, query and analyze profiling data:
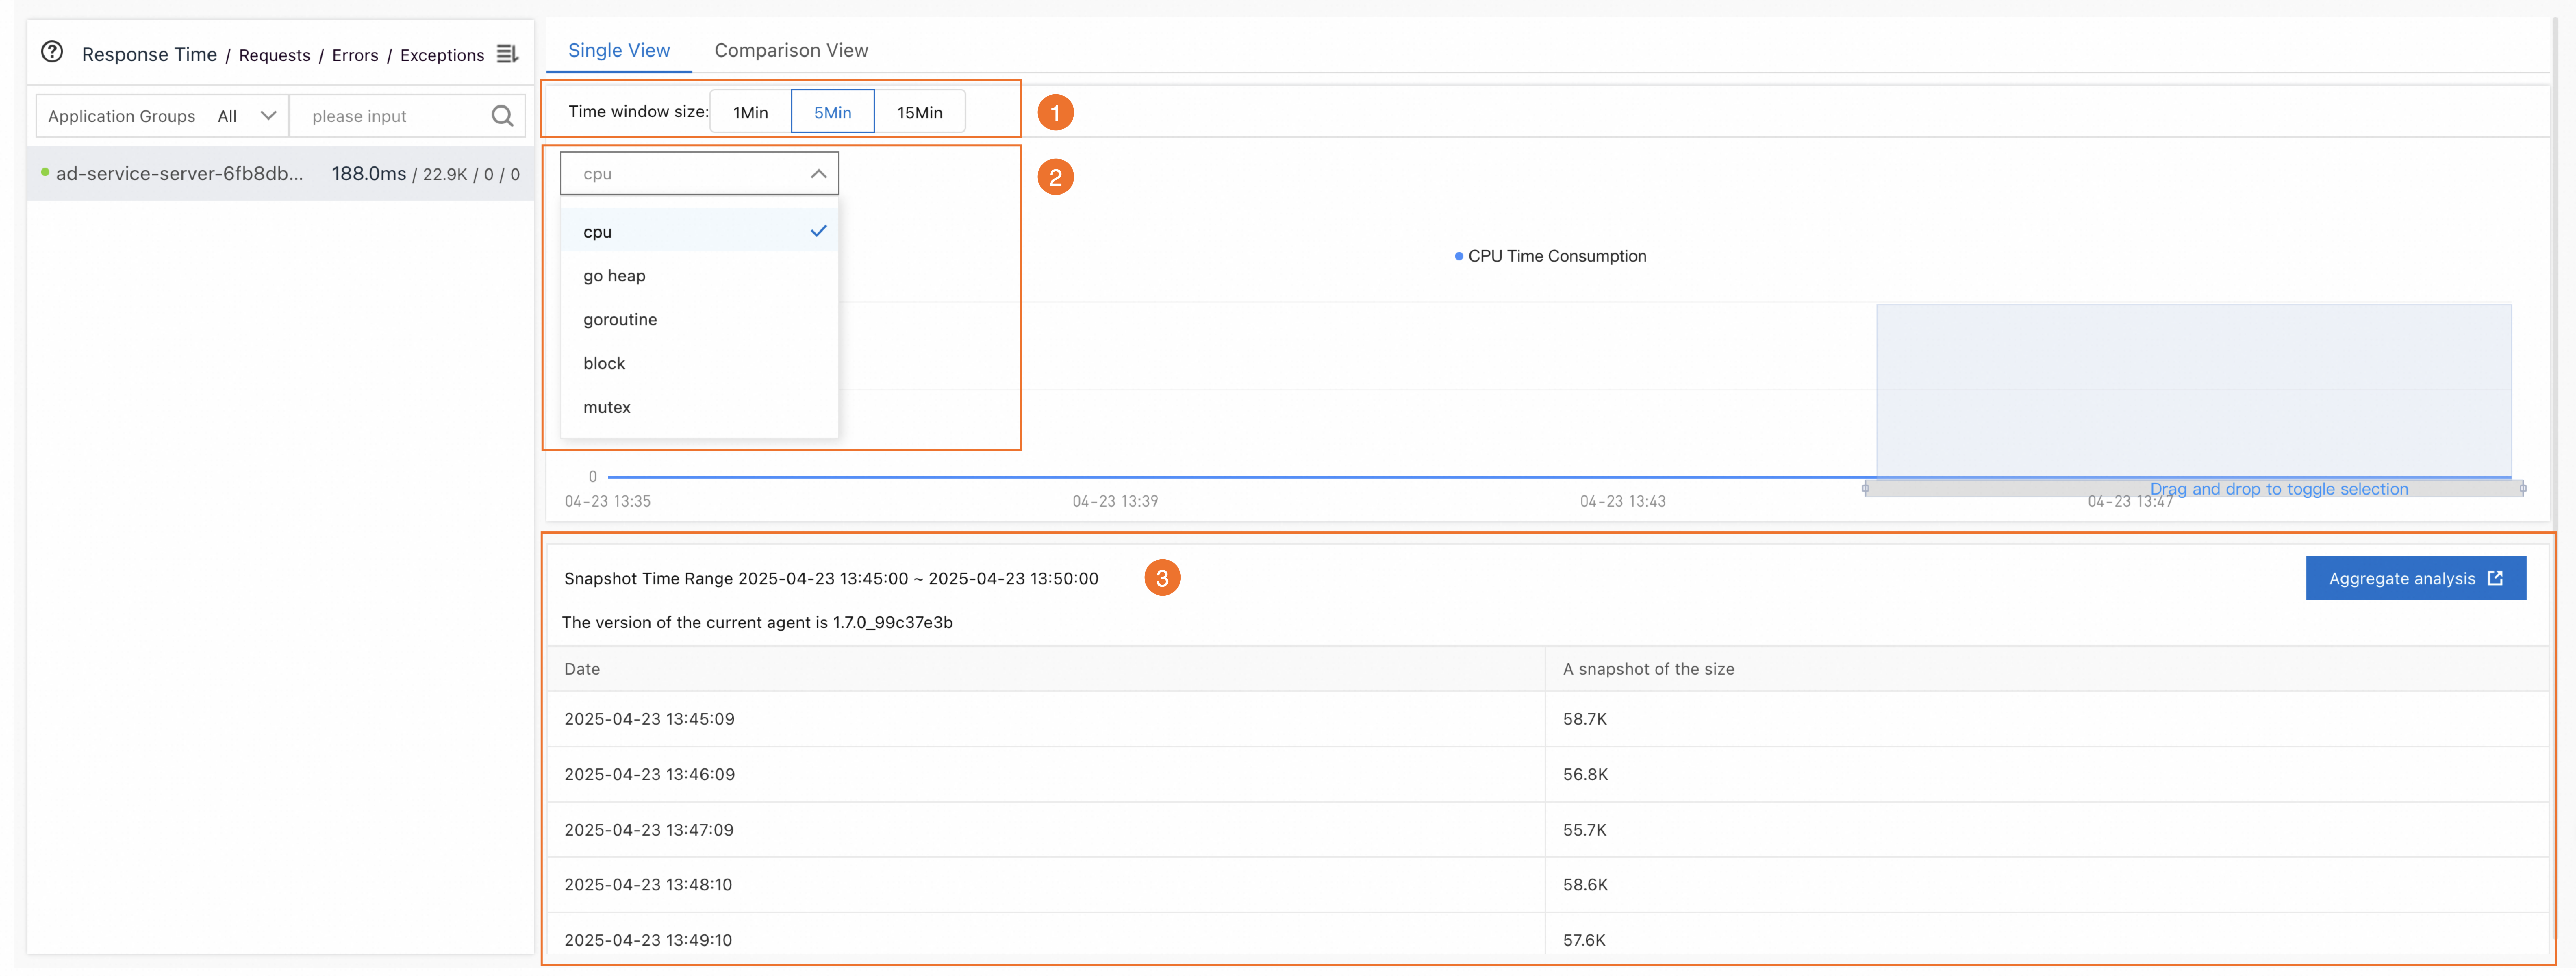
-
Select a snapshot duration -- In the Time window size section (icon 1), choose a duration and drag on the line chart to select a time range.
-
Select a profile type -- From the drop-down list (icon 2), select the data to view: CPU, Go heap, Goroutine, Mutex, and block.
-
Analyze the results -- The selected time range (icon 3) populates the data panel. Click Aggregate analysis to open snapshot details.
-
Performance analysis
Read the profiling results table
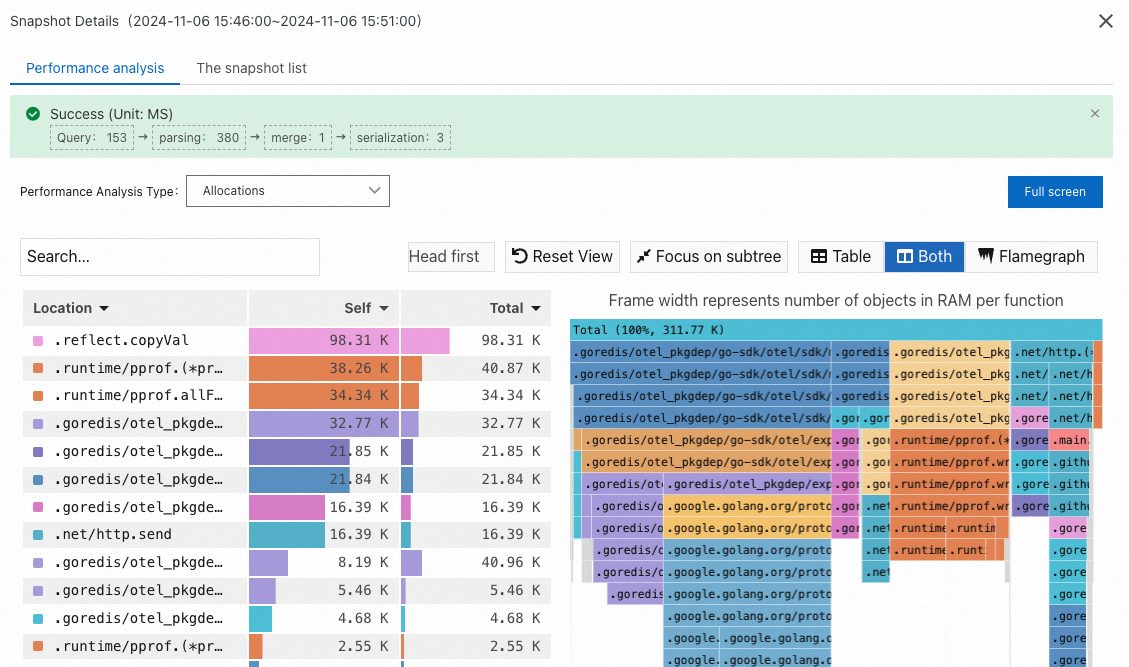
The profiling results table has two important columns:
Column Meaning When to use Self Time or resources a method consumes in its own code, excluding calls to child methods. Find methods that are individually expensive. Total Time or resources a method consumes including all child method calls. Find the biggest overall contributors to resource usage. Locate bottlenecks with flame graphs: In the flame graph on the right, look for wide bars at the bottom. A wide bar means that method consumes a disproportionate share of resources -- this is typically where the bottleneck lies. The Self column in the table highlights the same hotspots.
Profile types
Each profile type captures a different dimension of your application's runtime behavior. Select the profile type that matches the performance issue you are investigating.
CPU
Metric What it measures When to use CPU Time Number of CPU cores requested by each method. Identify compute-intensive code paths that drive high CPU utilization. 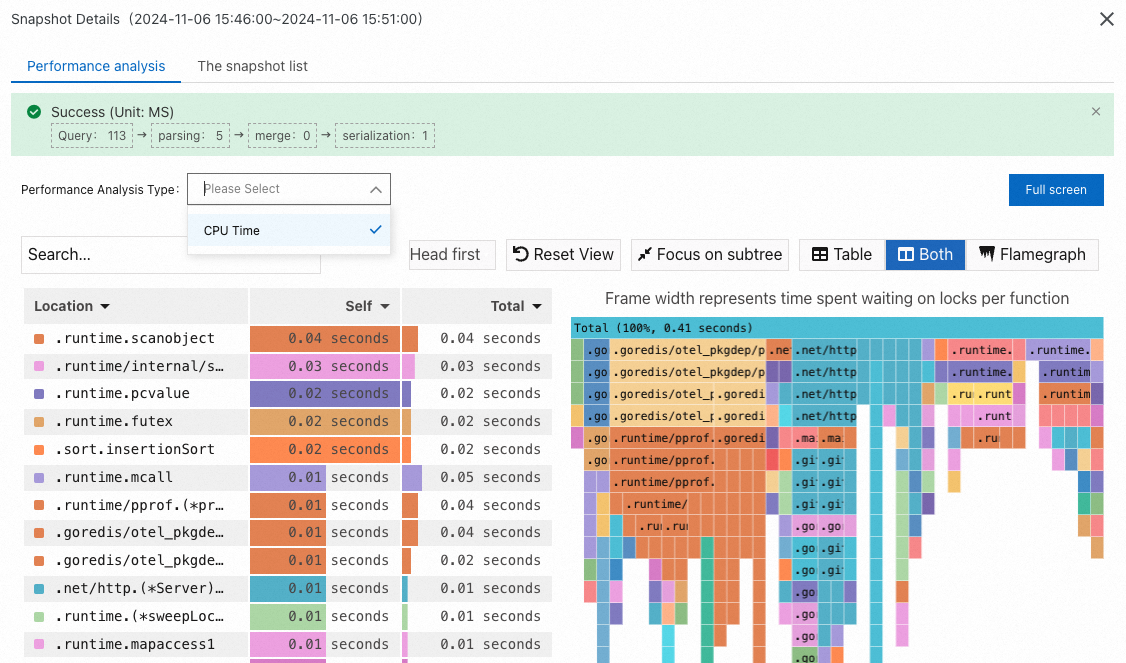
Memory (Go heap)
Metric What it measures When to use Allocated Memory The size of memory requested by each method. Find large or frequent allocations. Allocations Number of memory requests per method. Spot methods that request memory frequently, even if individual allocations are small. 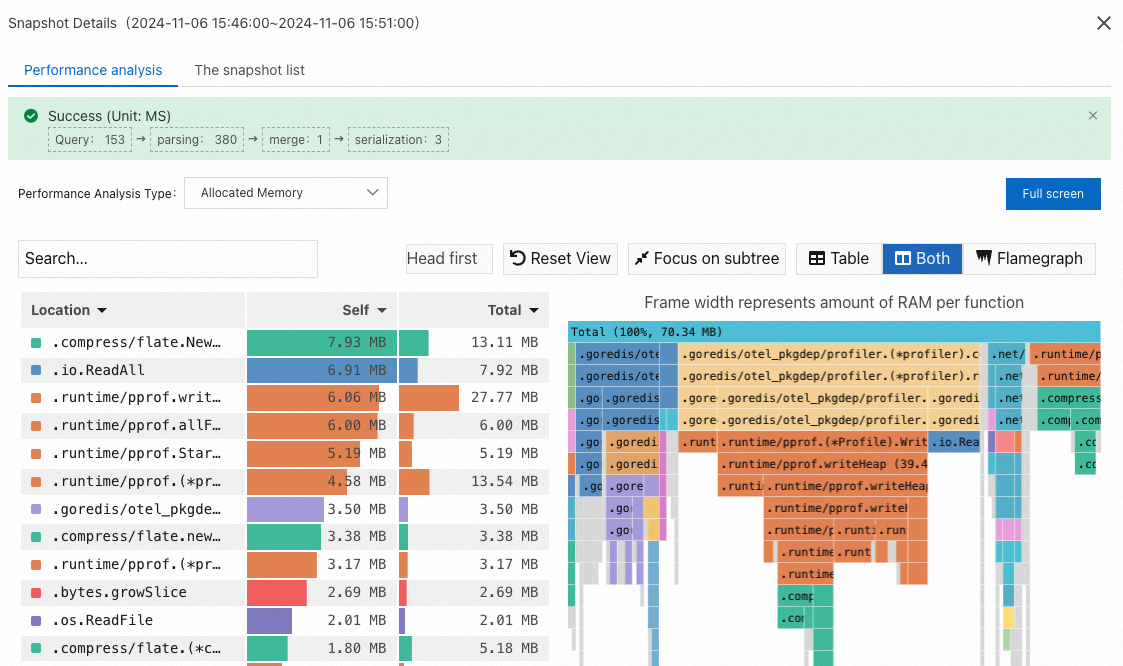
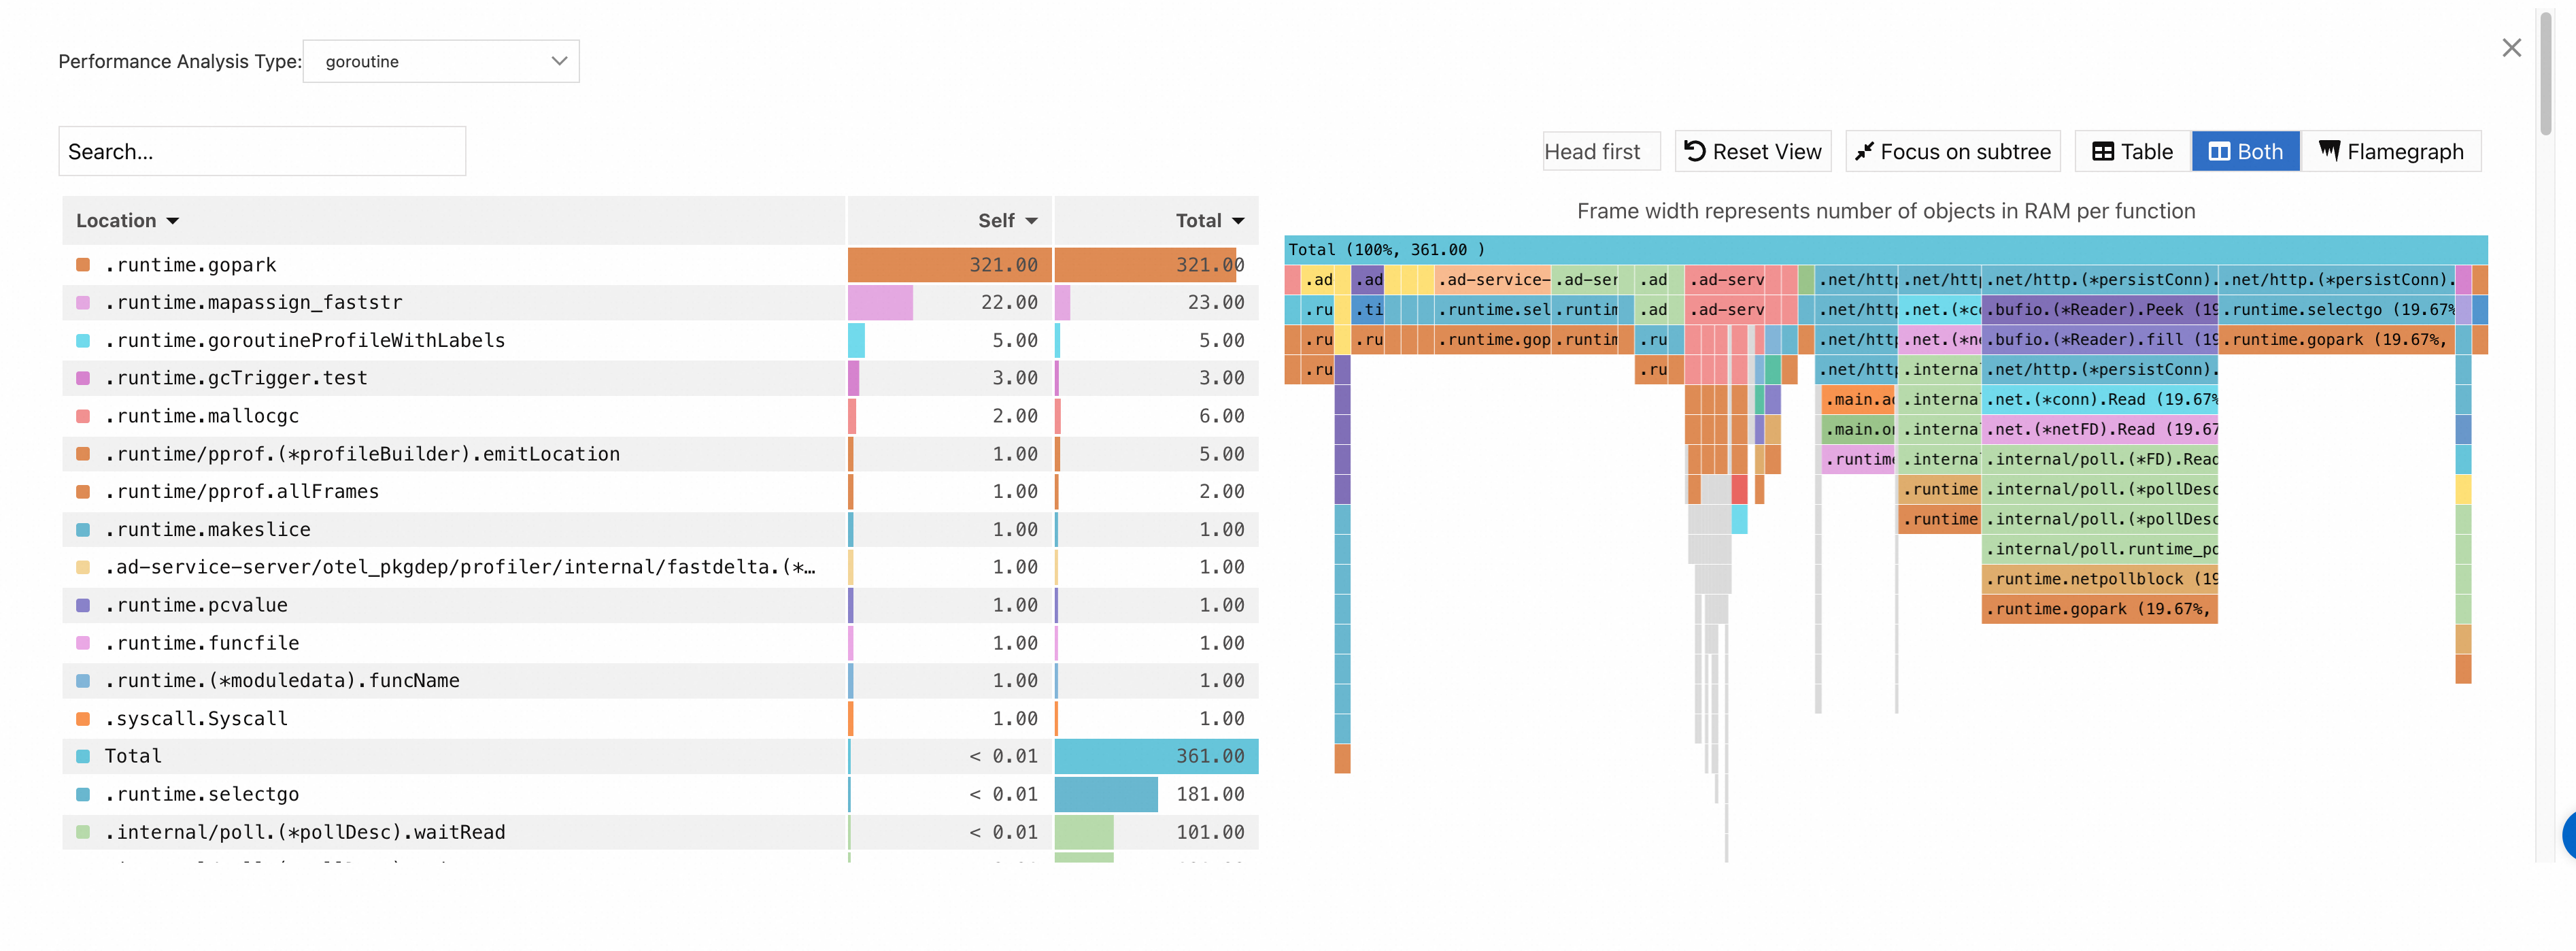
Goroutine
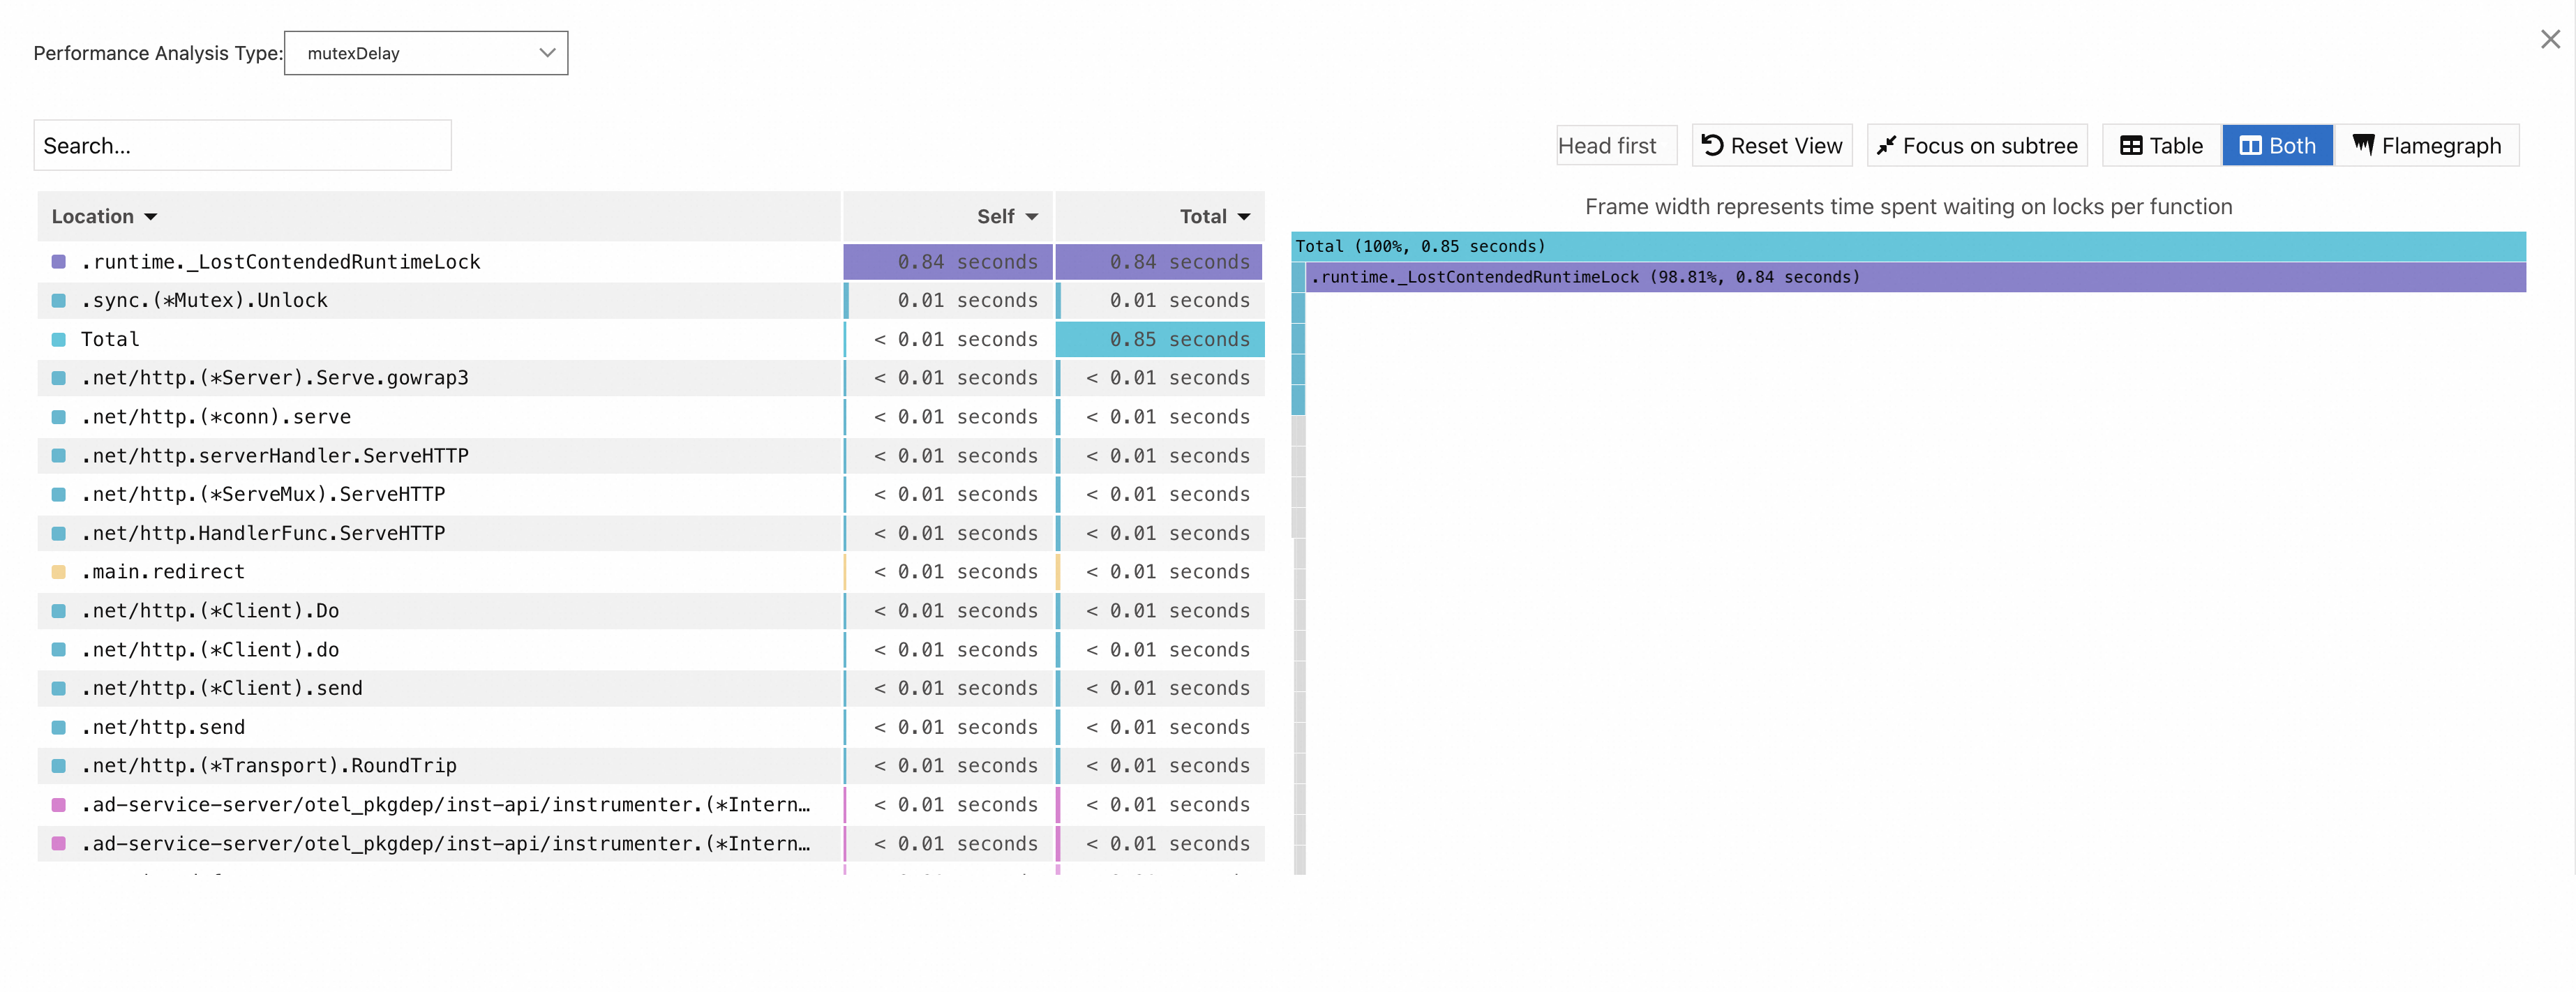
Mutex
Metric What it measures mutexContentions Mutex contention events. mutexDelay Mutex delay time. 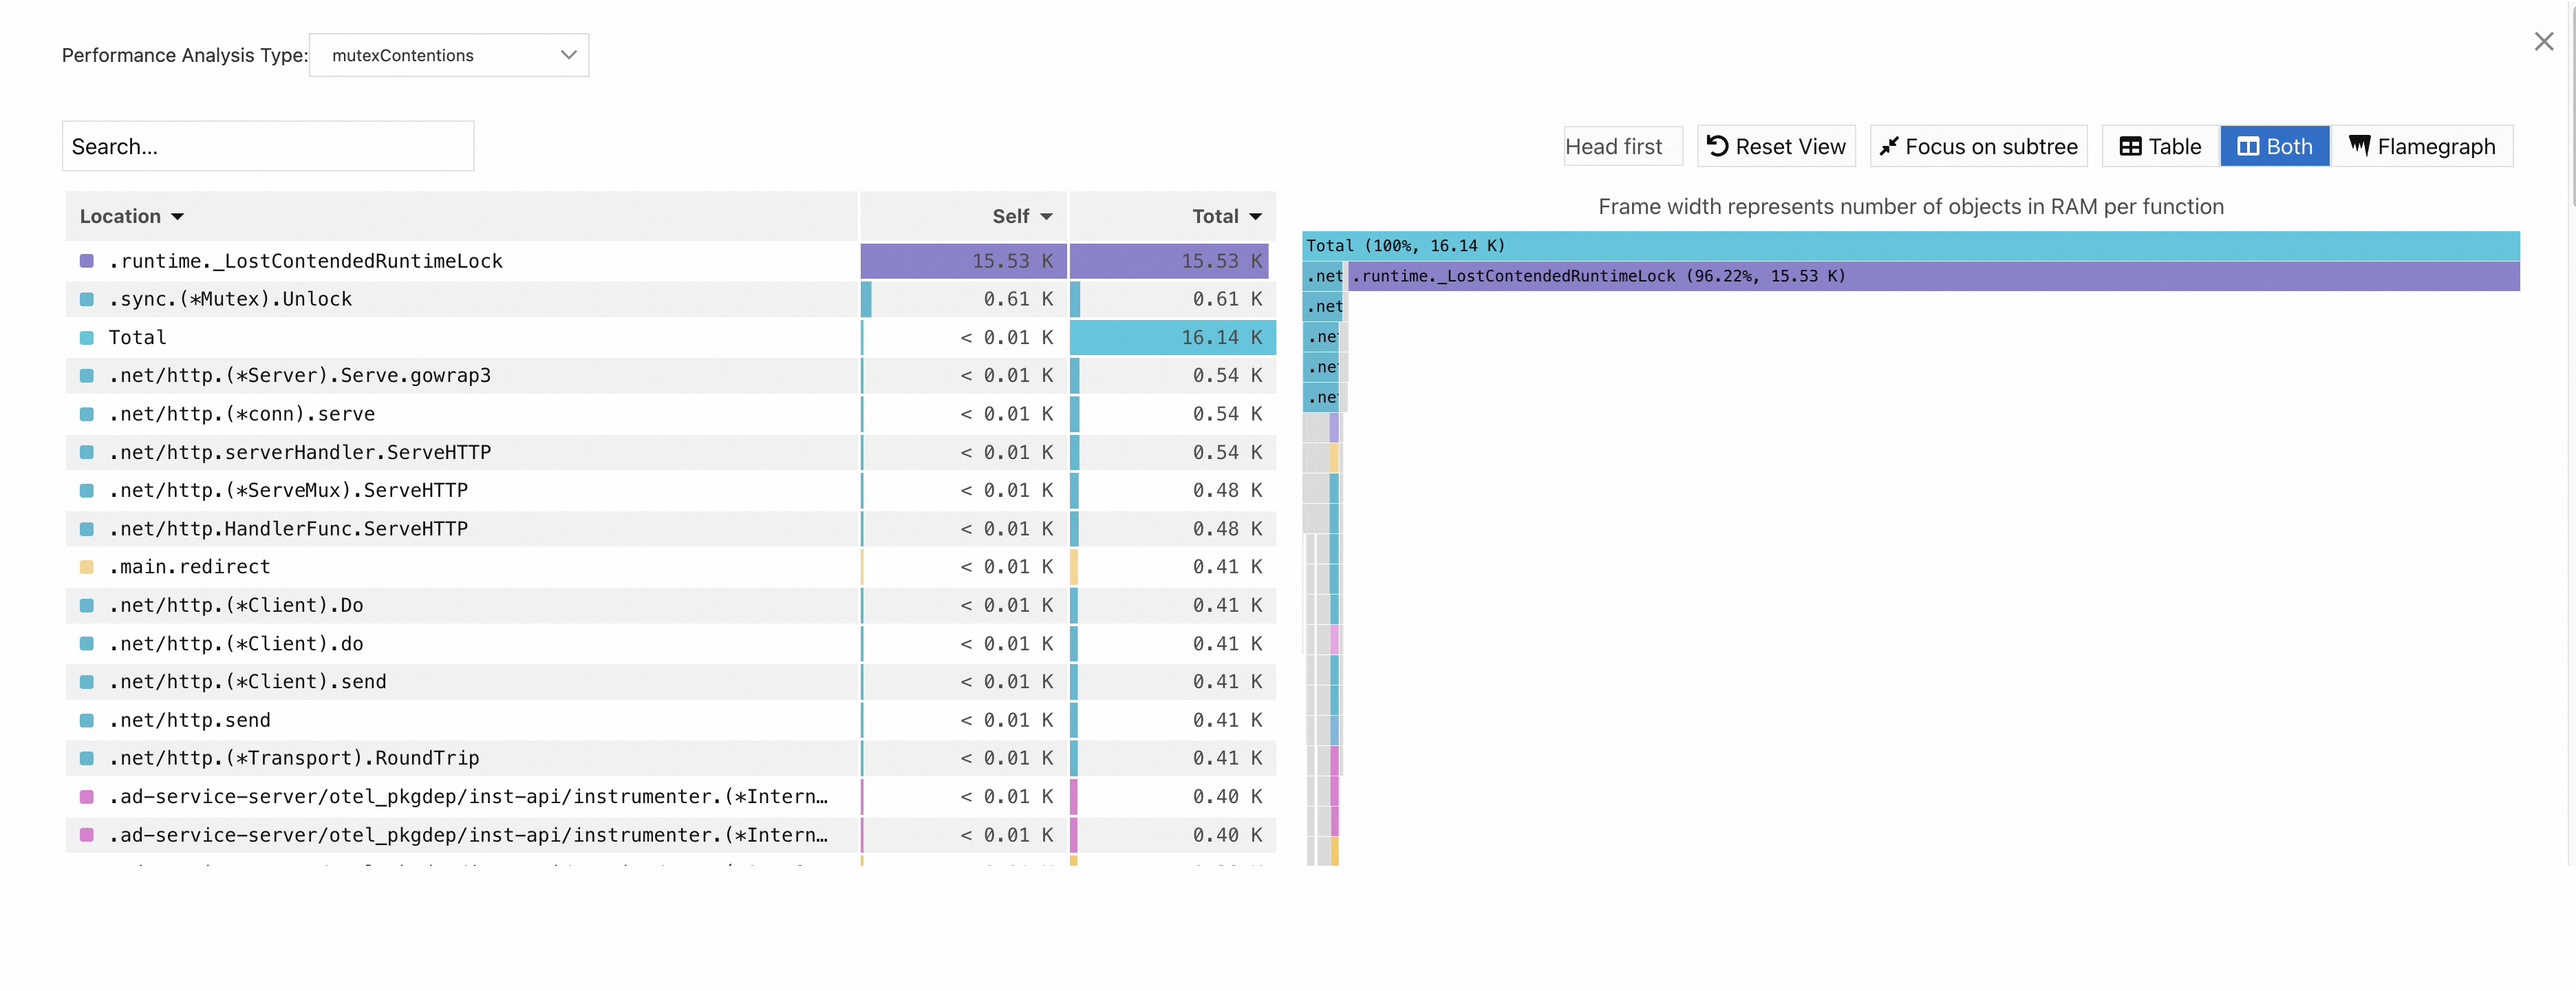
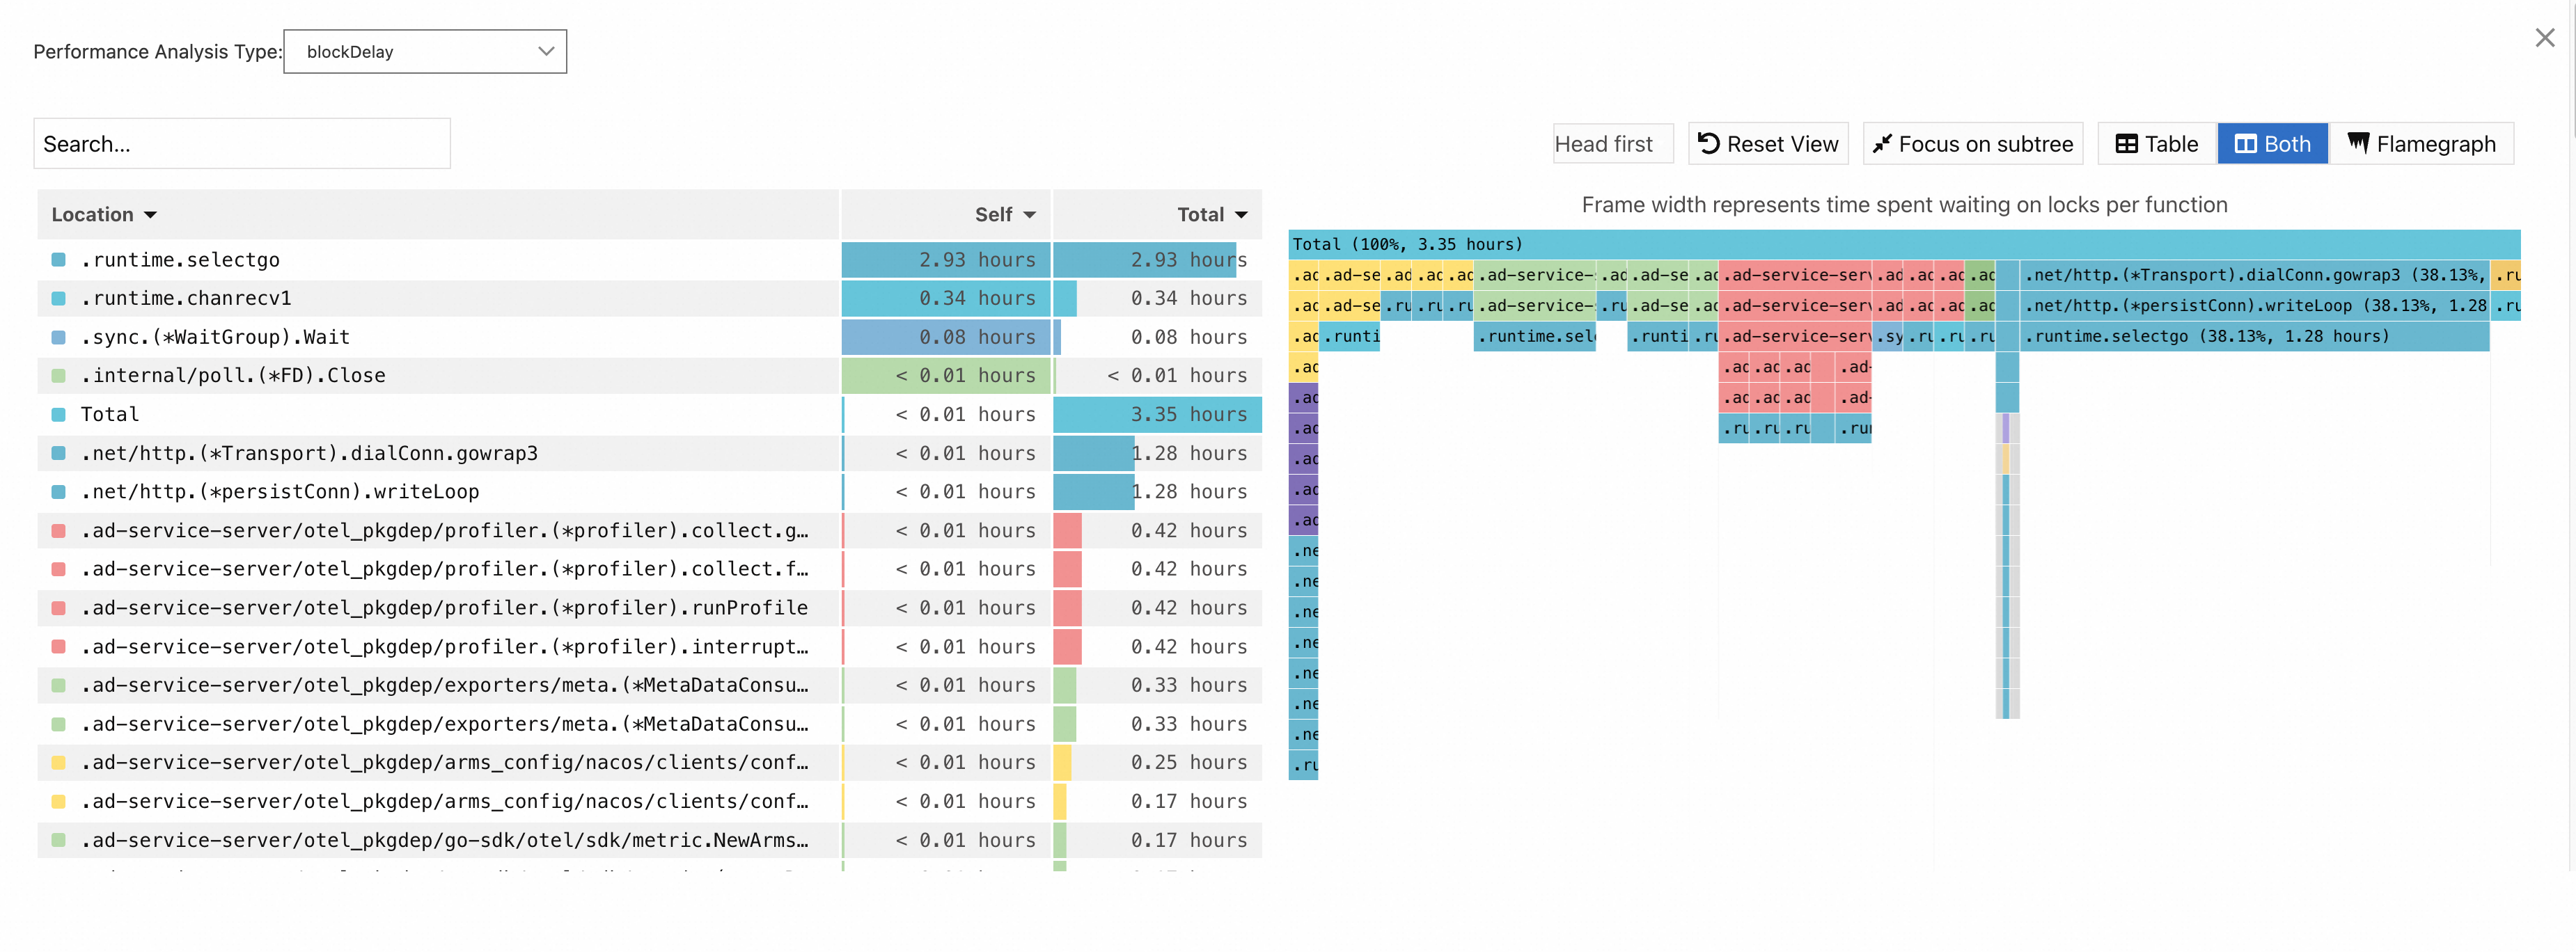
Block
Metric What it measures blockContentions Block contention events. blockDelay Block delay time. 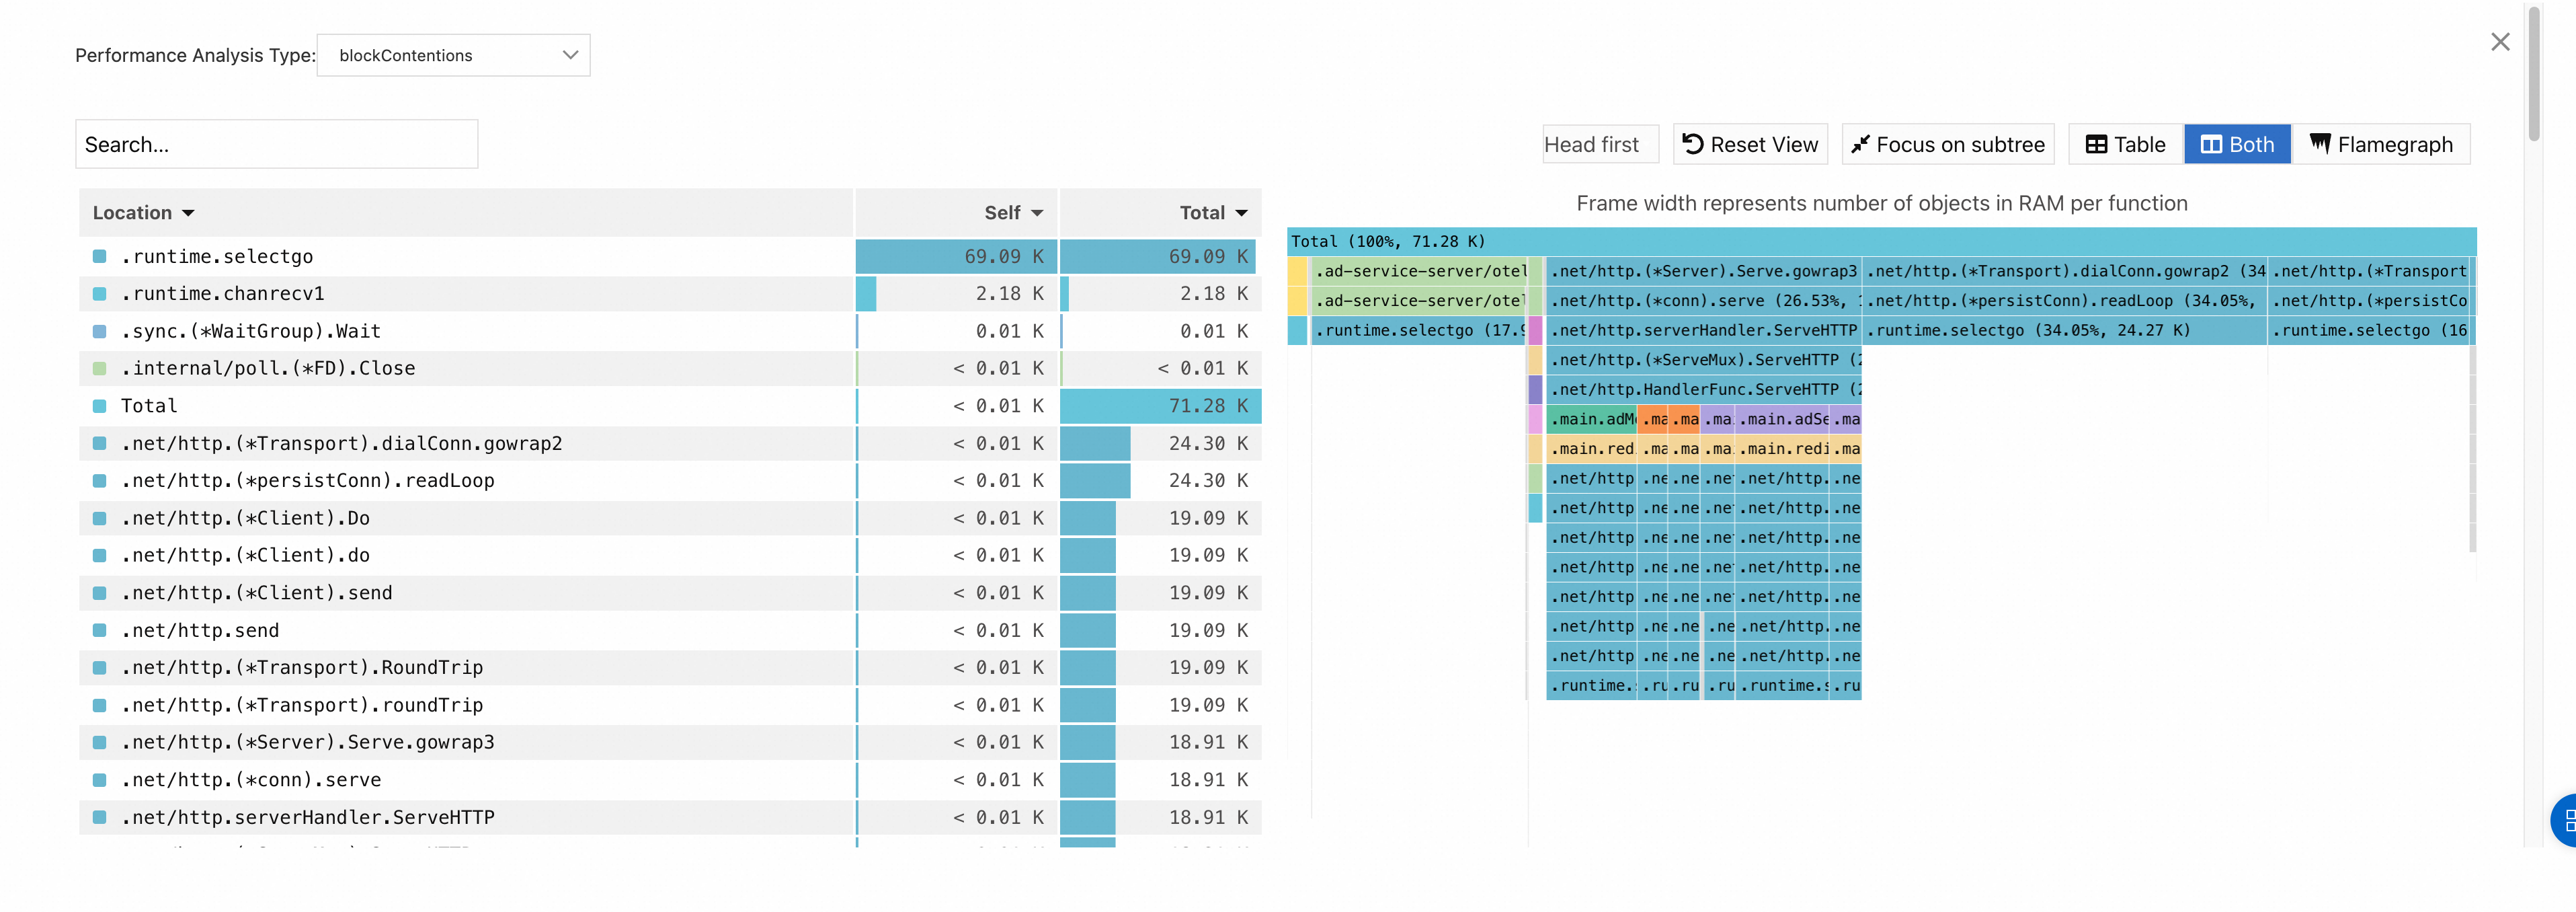
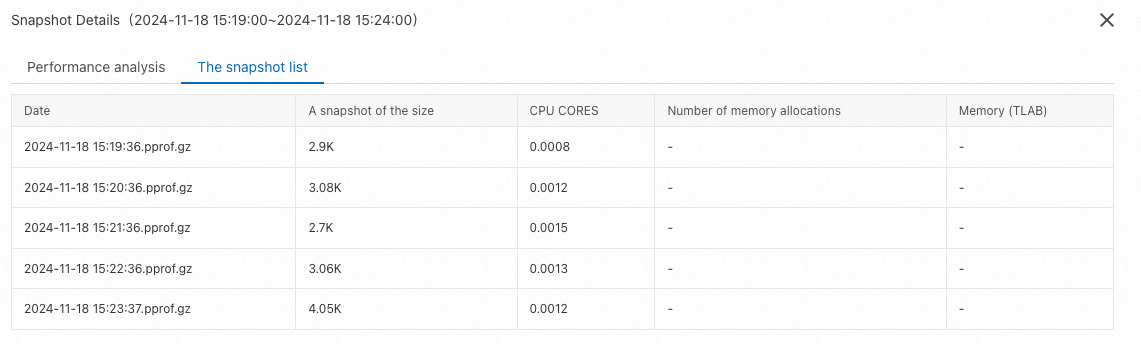
Snapshot list
The snapshot list shows all profiling snapshots captured during the selected time range. Click any snapshot to view its details.
-