Release date
June 29, 2023
data sources
Log Service data sources are supported.
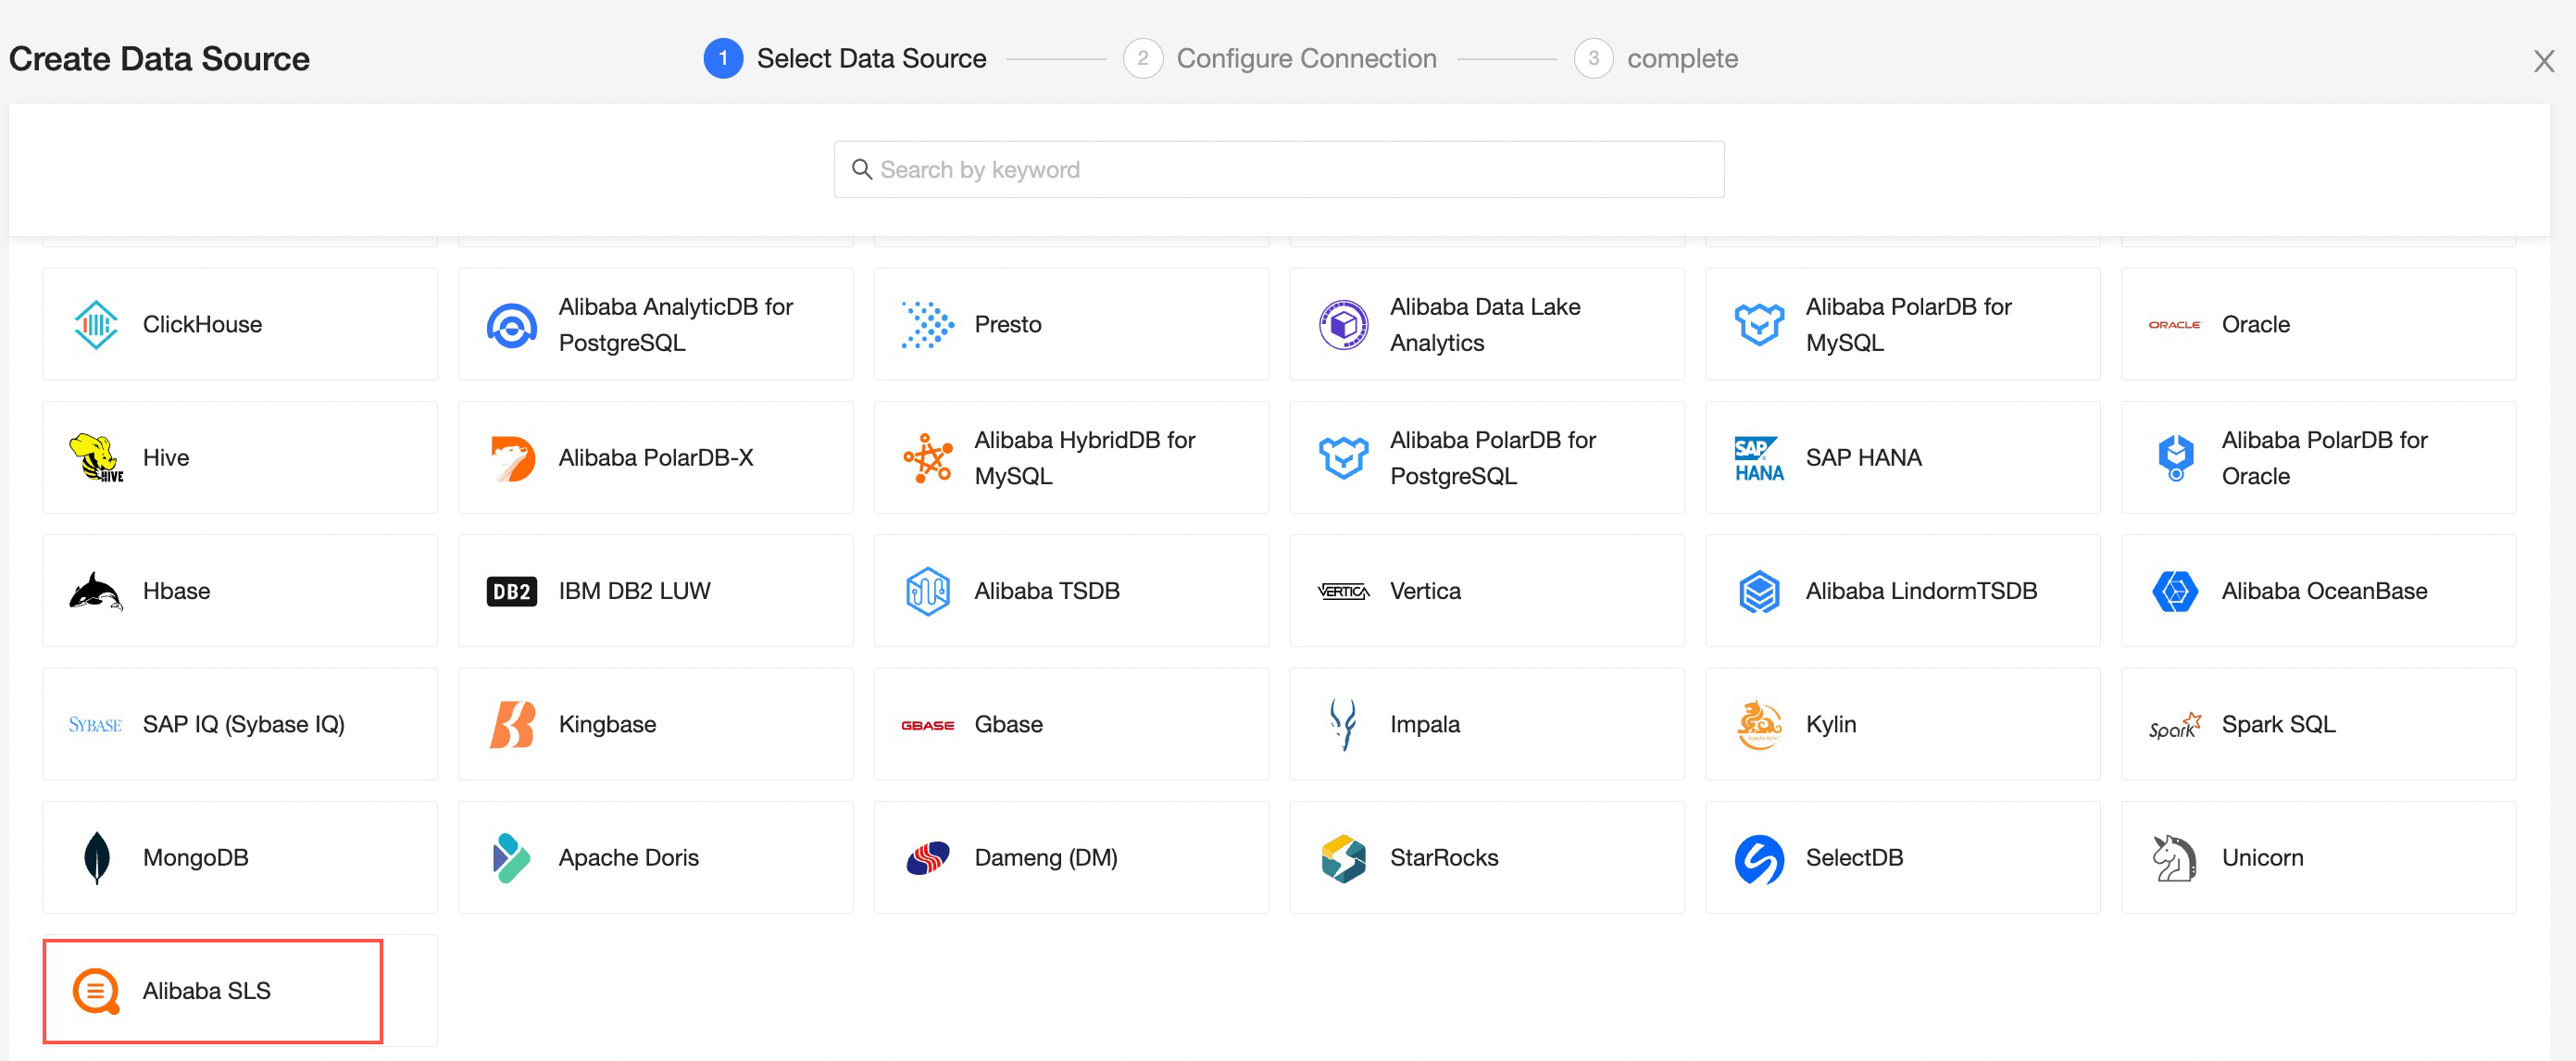
For more information, see Alibaba Cloud SLS.
Data filling supports Dameng database.
For more information, see Create a form.
Datasets
Datasets support HINT statements.
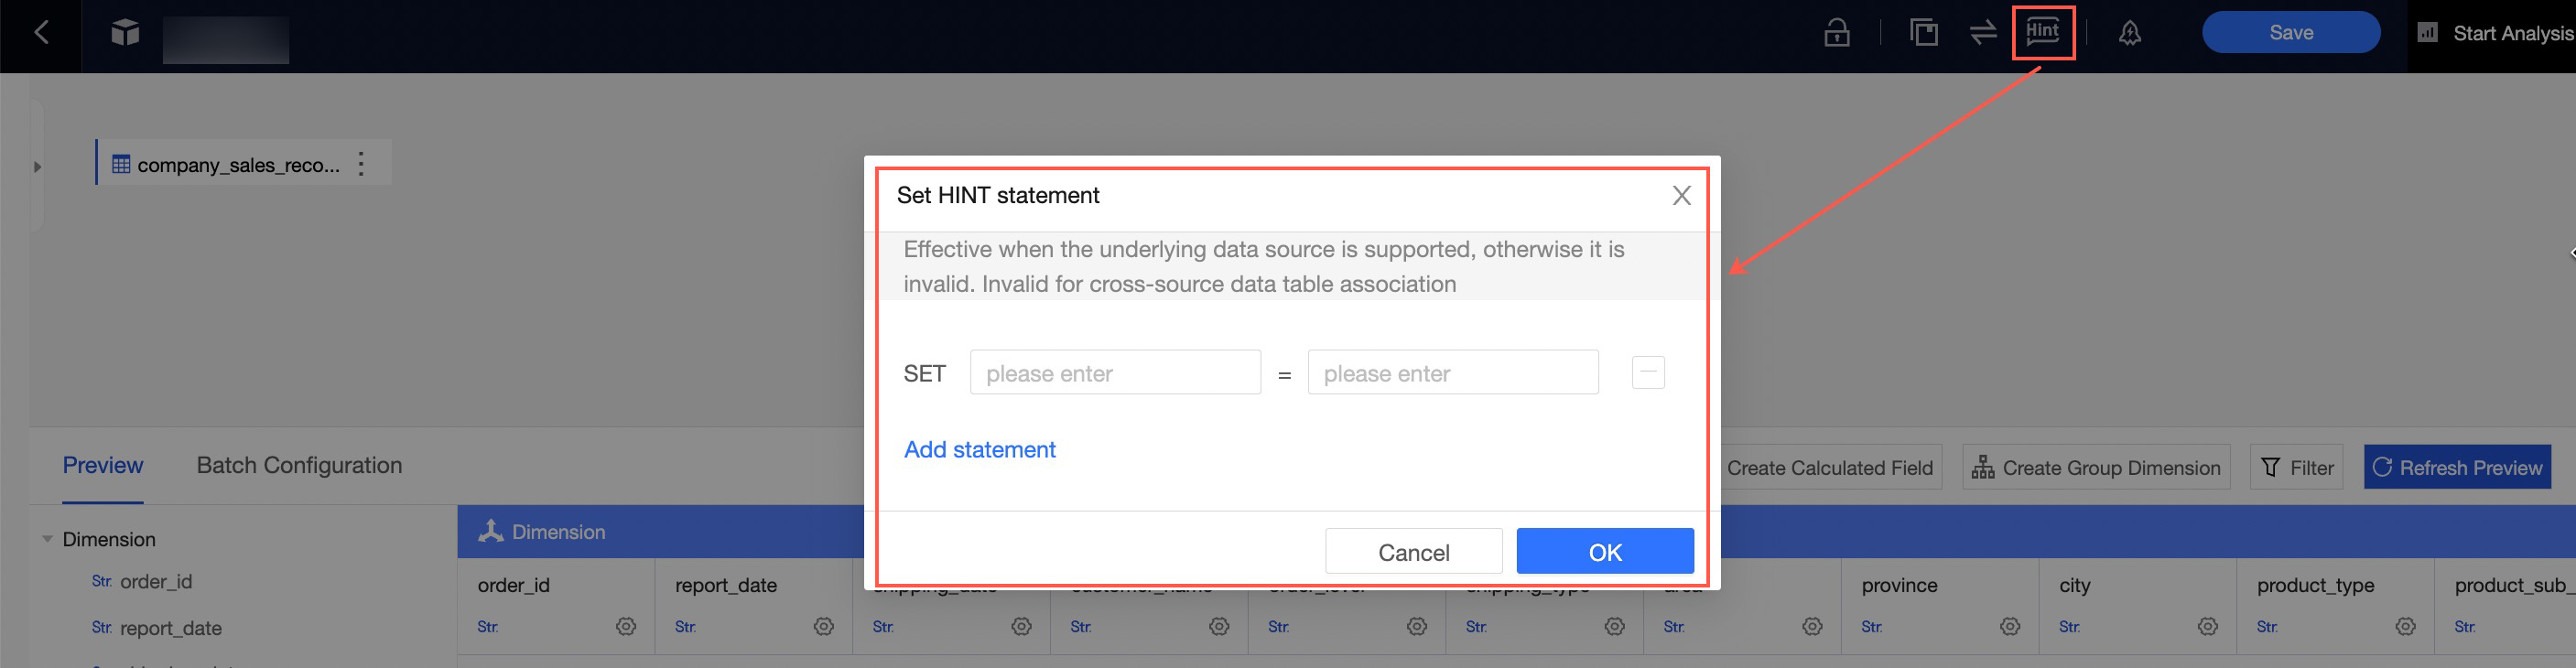
For more information, see Create and manage datasets.
Dataset field descriptions support synchronization to data works.
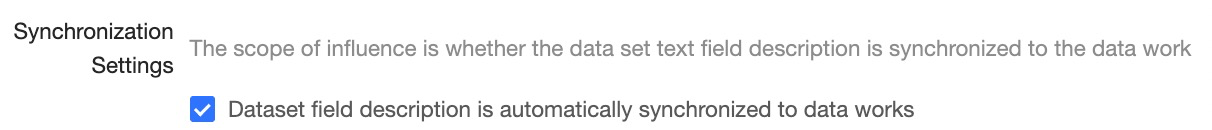
For more information, see Create and manage workspaces.
Dashboards
You can customize the chart guides in the dashboard. You can add the guides to the rankings.

The chart preview page allows you to hide more operation entries to improve the preview effect.

For more information, see Theme design.
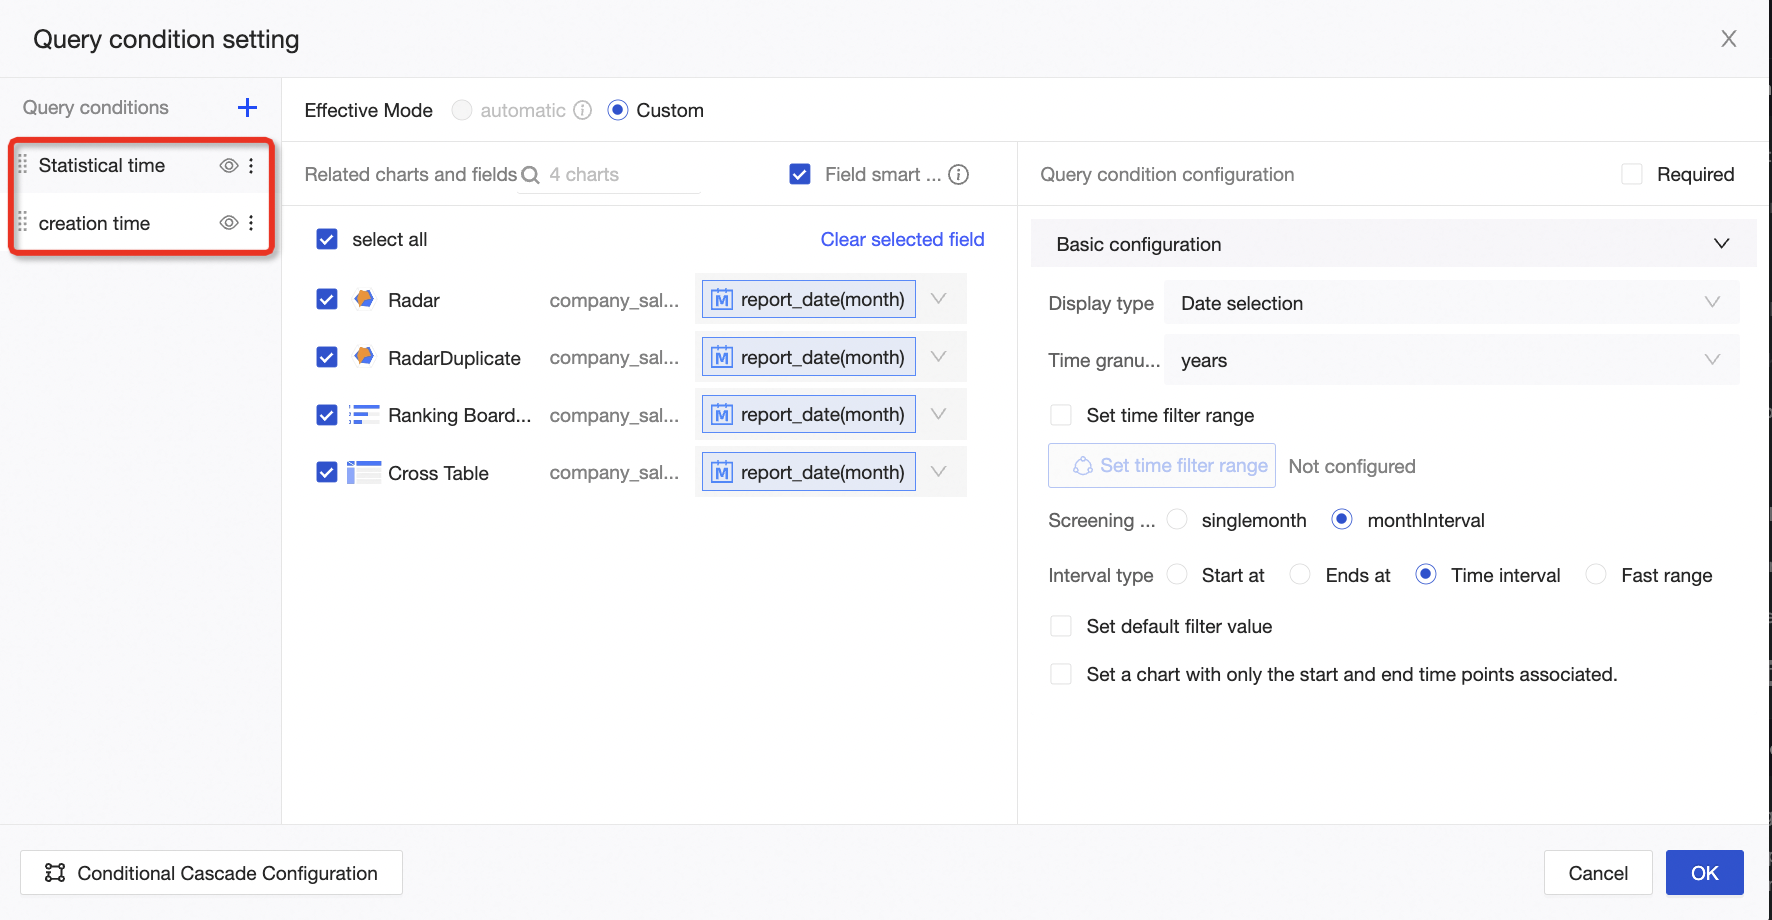
The query control allows you to customize whether to display null values.
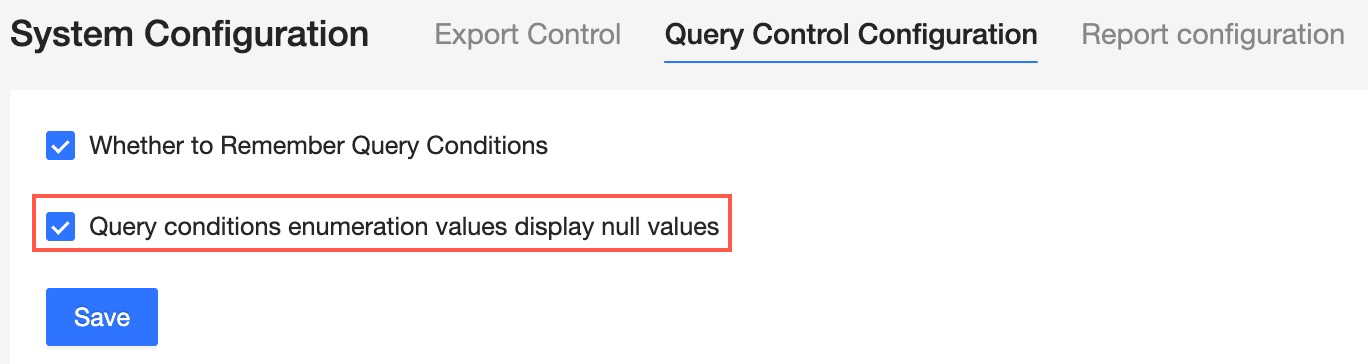
For more information, see Query control configurations.
In the Data Panel, you can customize the display format for negative numbers. The display format of negative numbers is data format supported in parentheses.
For more information, see Visualization configuration.
You can configure the number of grids in the dashboard layout. You can configure the size&draggable size&draggable position for the pop-up window.

For more information, see Raster settings.
You can set the background color for story lines.

See Story Builder.
The query control capability is enhanced. Controls of the same type can be associated with switch selection and tree drop-down support up to 10 layers.
For more information, see Create a filter bar.
Create a chart
You can configure a target value for a leaderboard.
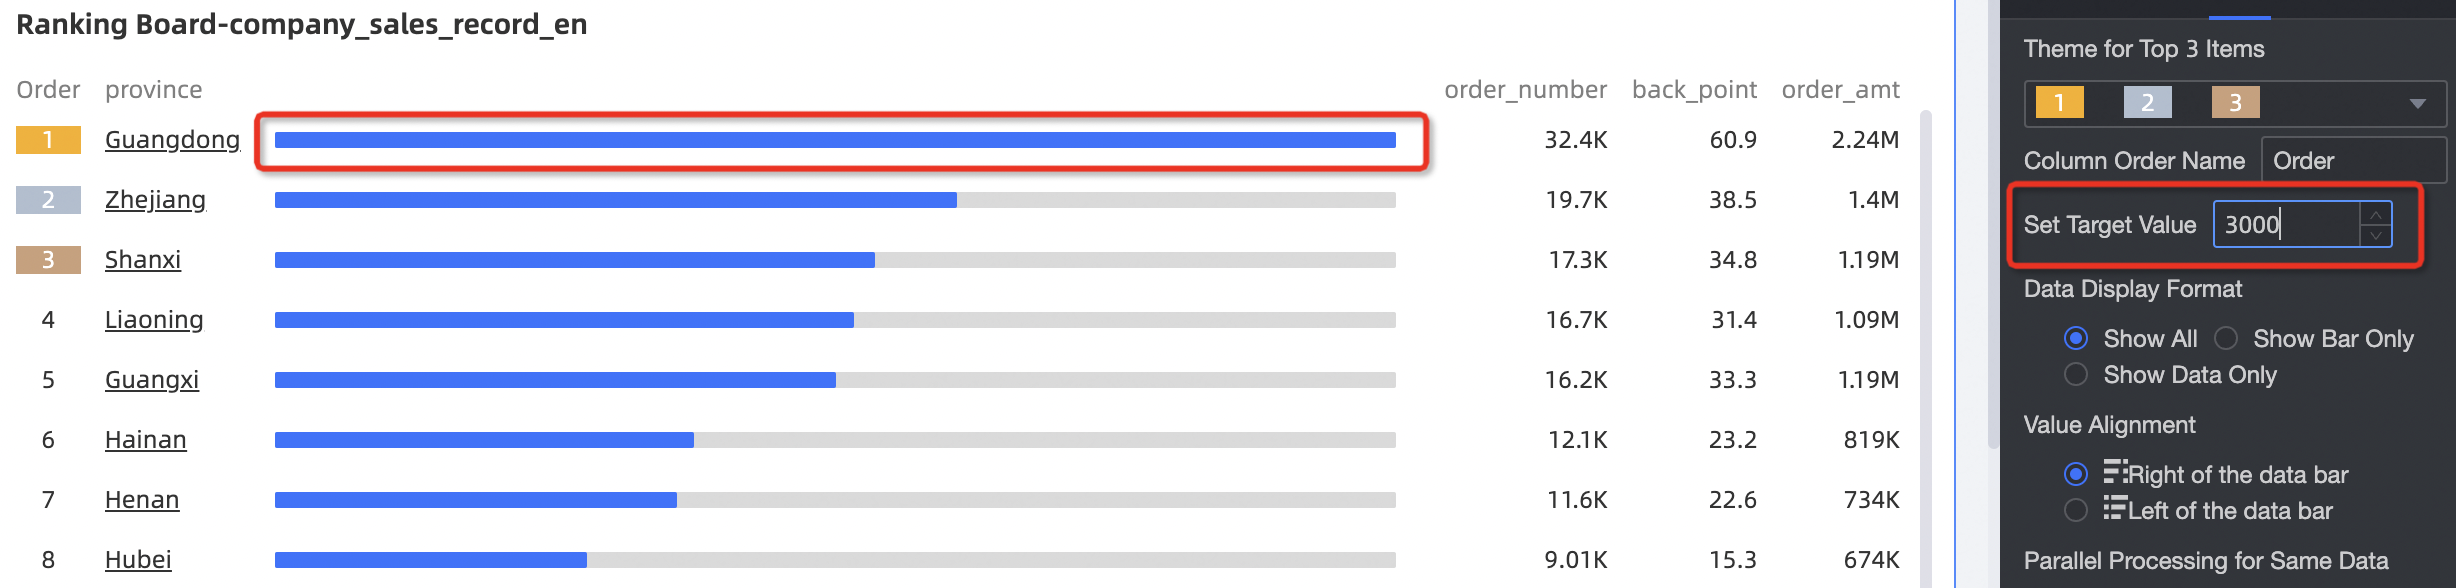 For more information, see Leaderboards.
 Radar charts support null processing.
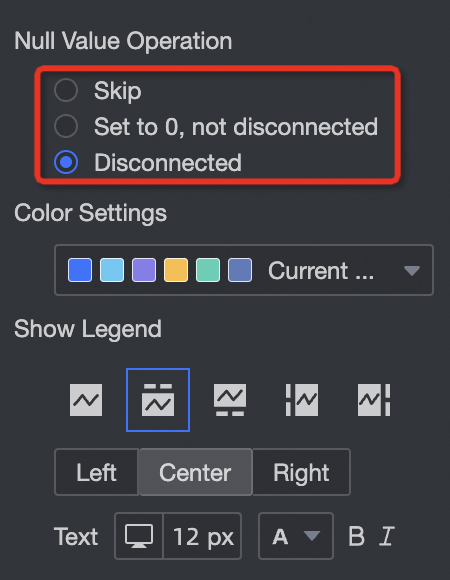
For more information, see Radar charts.
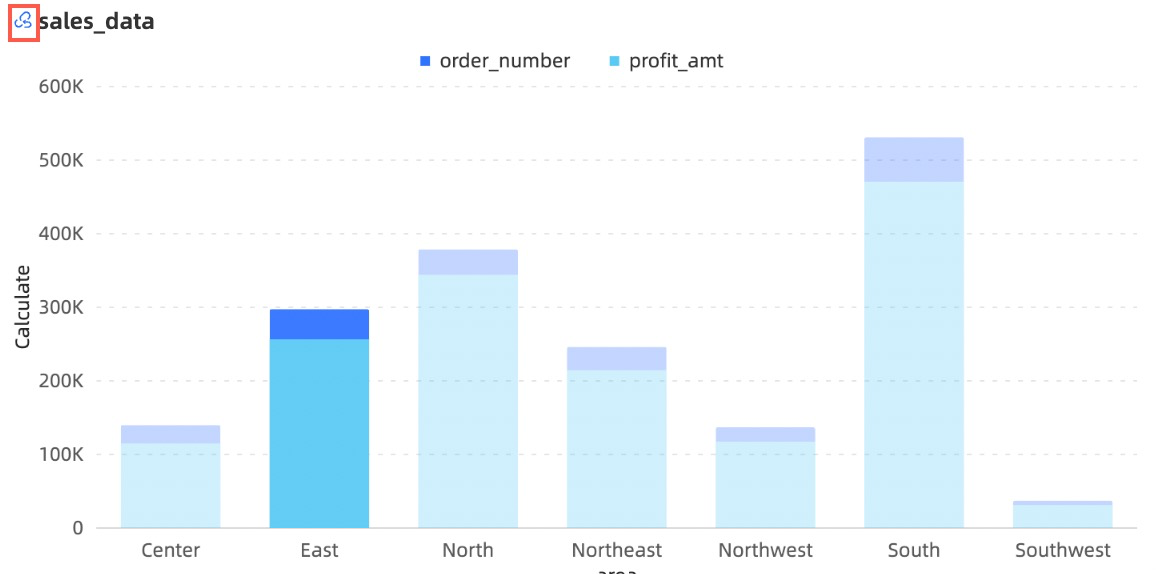
Stacking /100% stacked column chart supports configuring both totals and percentages.
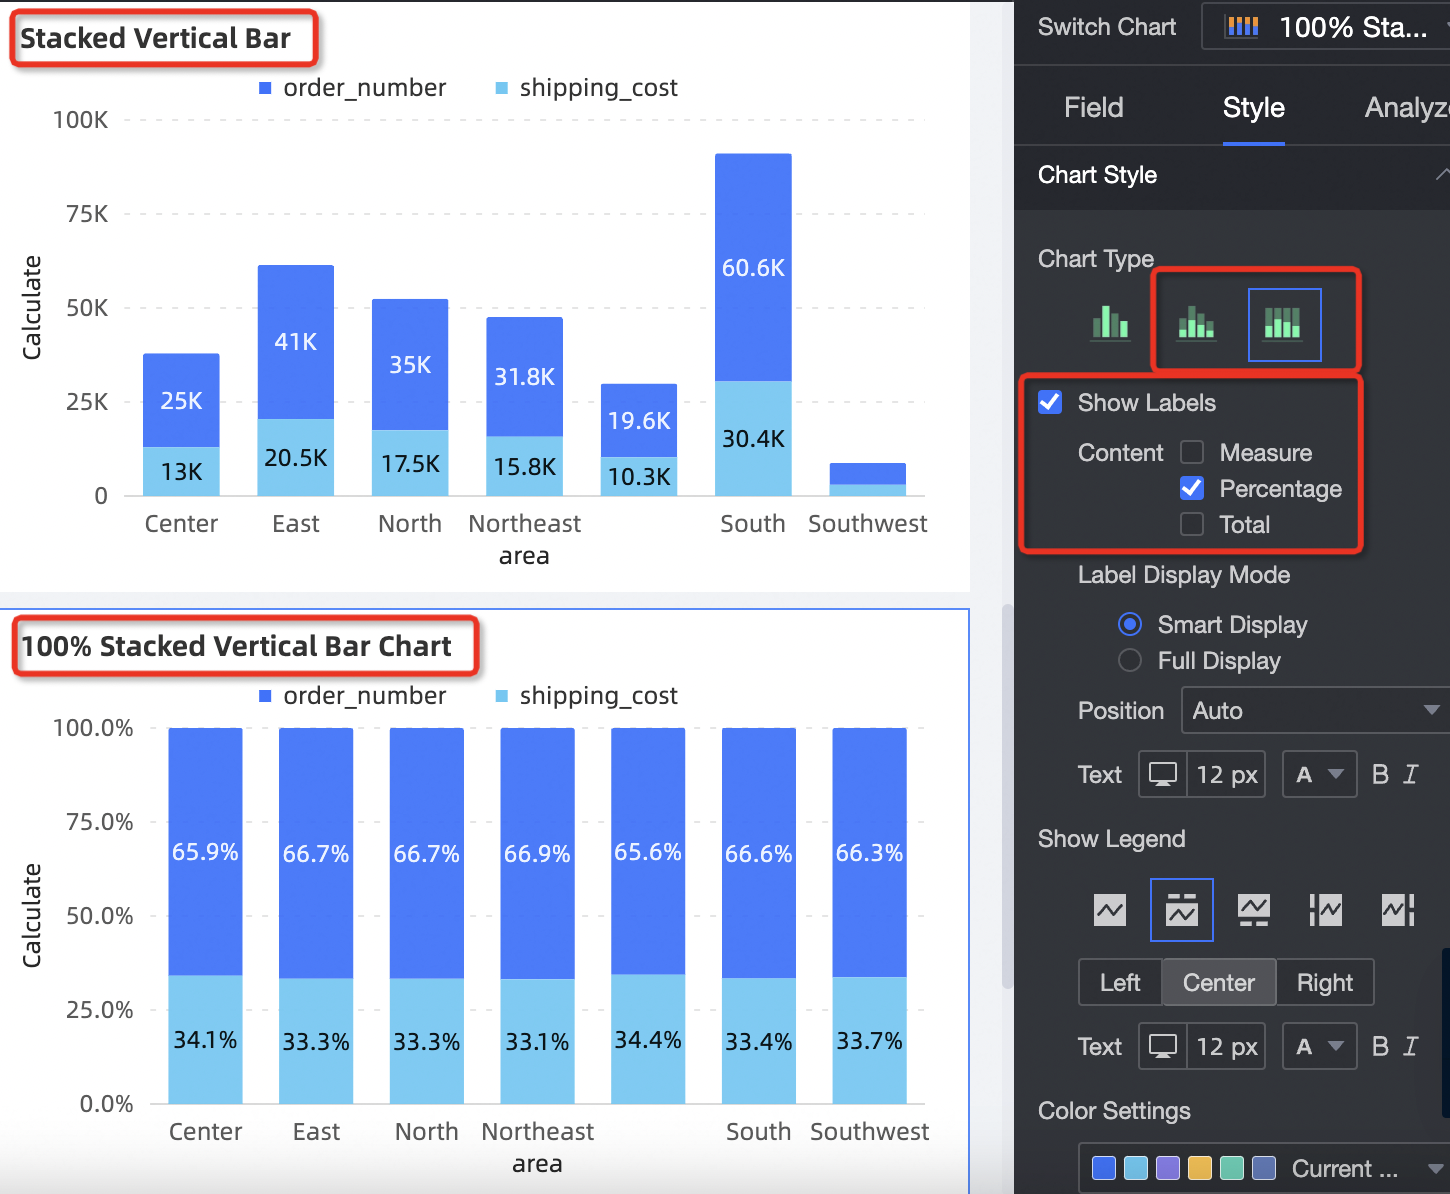 See column chart.
 A scroll bar is added to the cross table. You can select the mouse to scroll in and the resident display. You can configure the thickness of the scroll bar and add a sorting mode.
For more information, see Cross tables.
You can use scatter charts or bubble charts to draw trajectories.
 See Scatter chart /
Hologres
The same source chart of a dashboard supports automatic linkage. The linkage configuration is simplified.
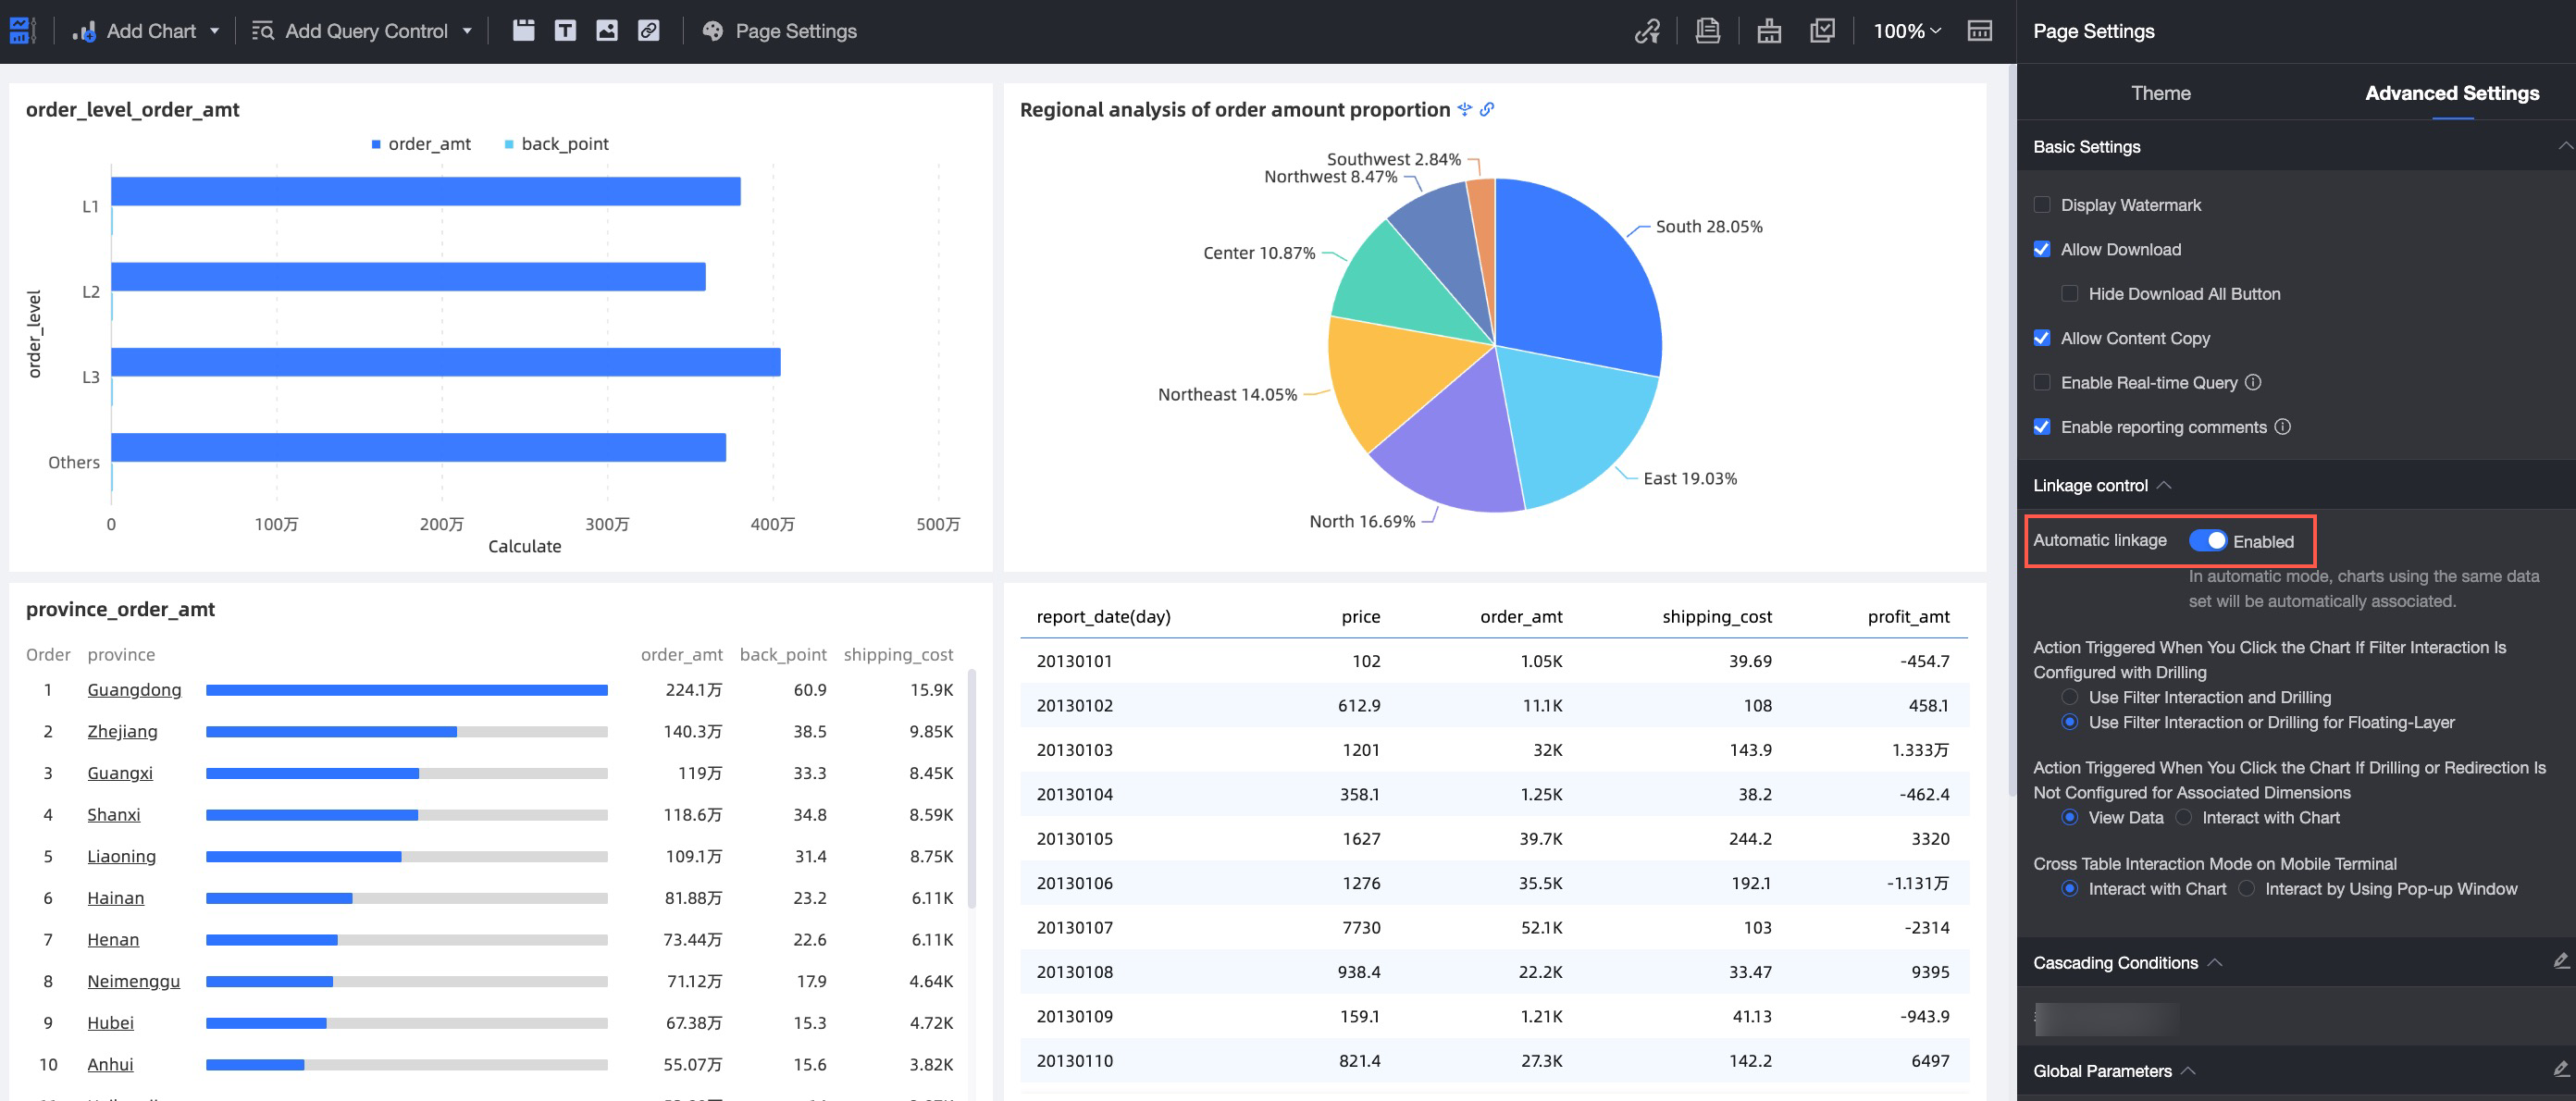
Dashboard charts support two-way linkage, and chart interactions are more abundant.
The cancel linkage button is explicit, which is convenient and quick to cancel the linkage between charts and improve the efficiency of use.
Jump to a new page can be returned after the support, multi-level jump supports carrying the query control of the original page.

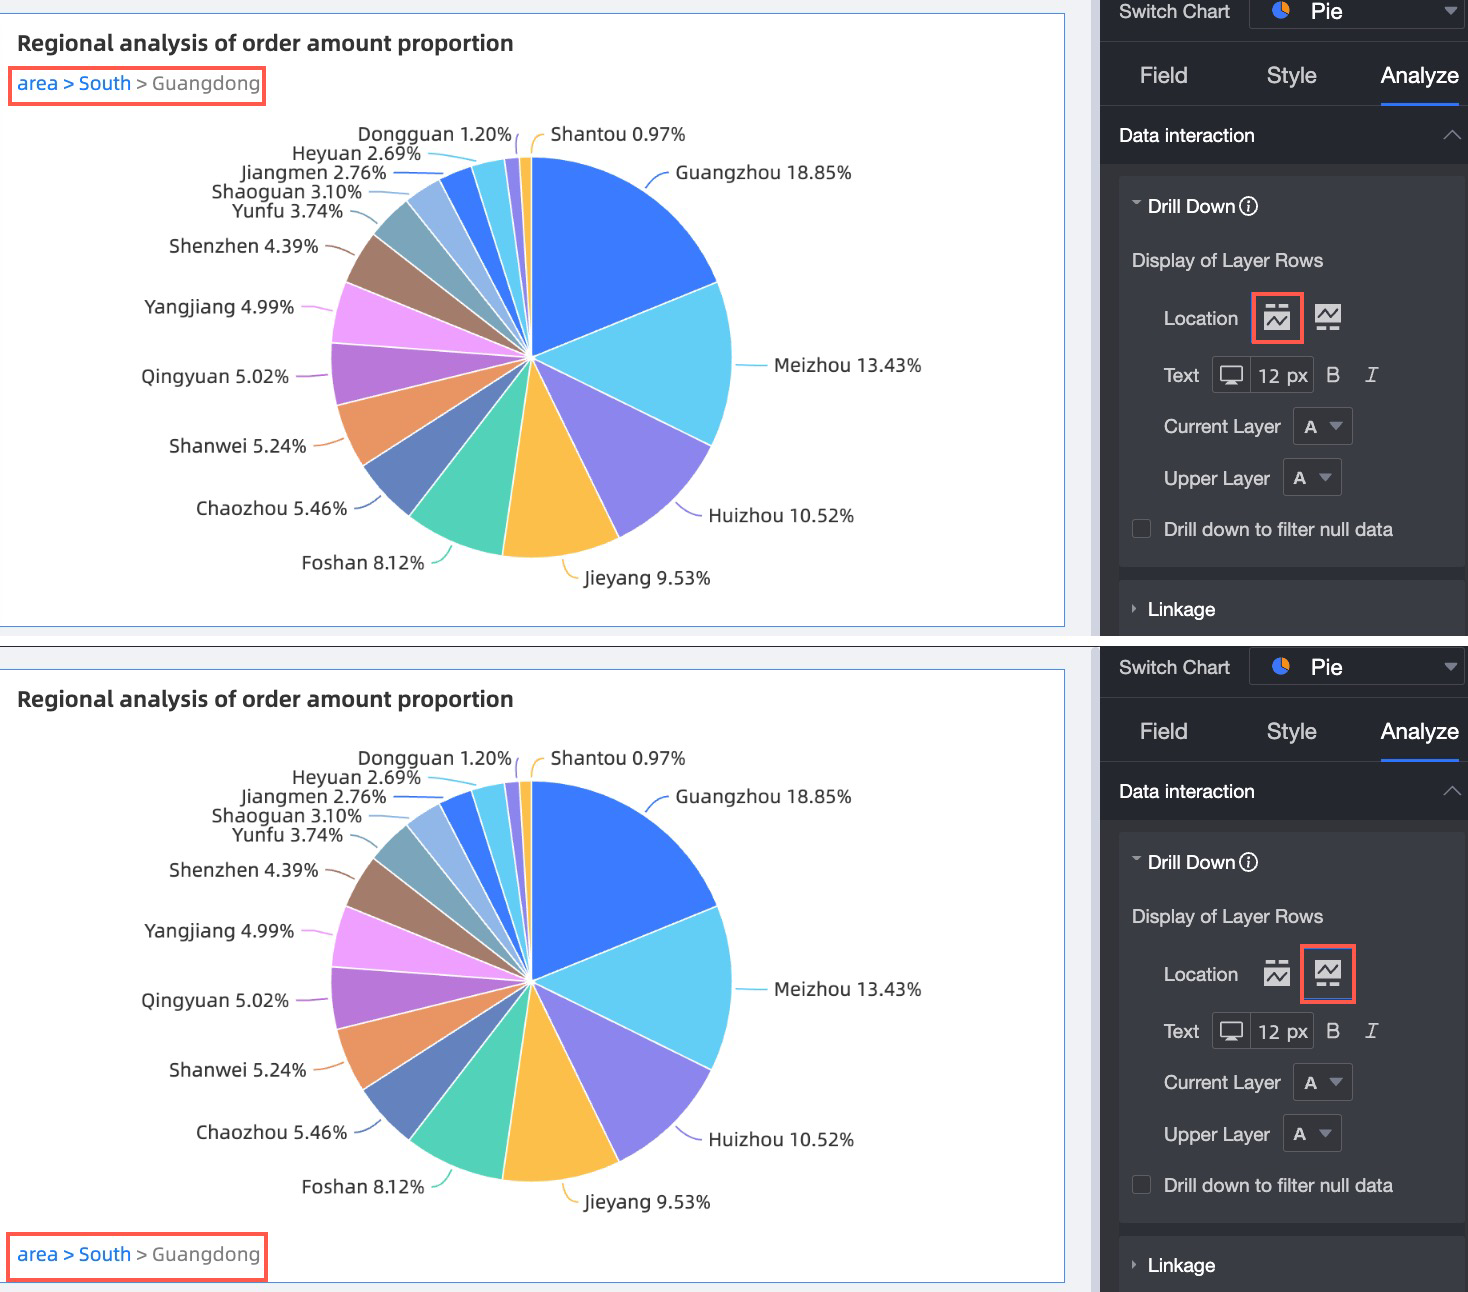
During drill-down, you can set the display of auxiliary fields to provide supplementary information about drill-down fields.

Drill breadcrumb position support adjustment.
Added the status icon setting, which allows you to customize whether to display the interactive analysis button, and adjust the theme color based on the enterprise style to better meet the enterprise's custom display requirements.

For more information, see Drill, Link, and Jump.
Monitoring alerts (new)
The permission system is more perfect, the data information is more secure, and the index management is more convenient.
The monitoring configuration capability is improved. You can synchronize and modify the filter conditions of dashboard data. You can select all dimension values for dimension splitting. You can also use the complex combination logic of alert rules.
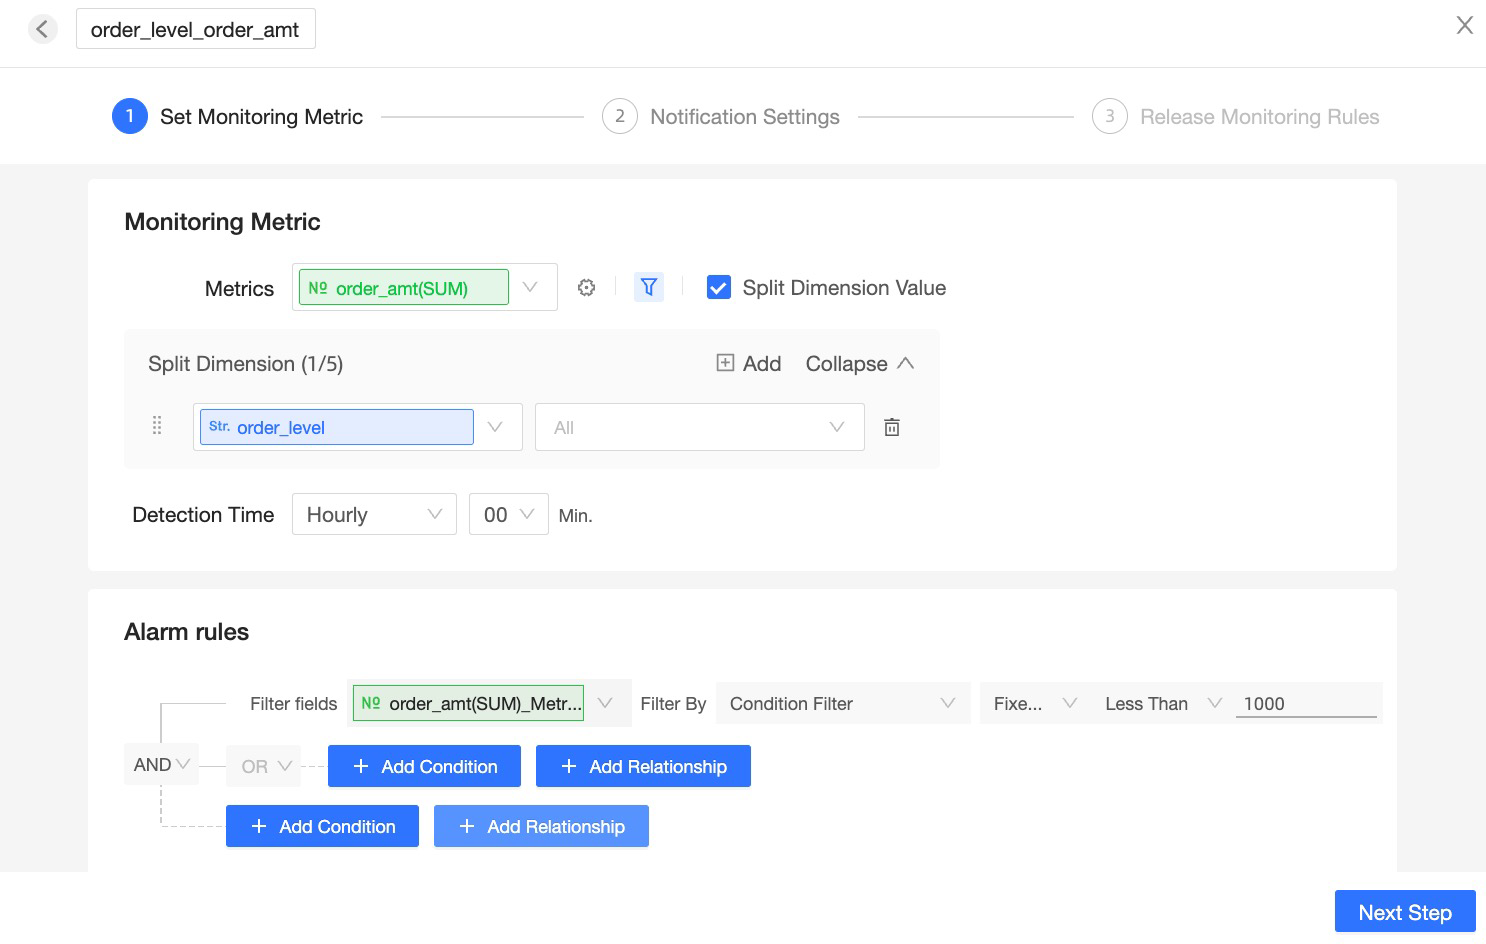
For more information, see Configure monitoring and alerting.
The alerting experience is optimized, and more flexible alerting time is supported. The combined alerting of multiple exceptions is supported to effectively reduce the number of alerts.
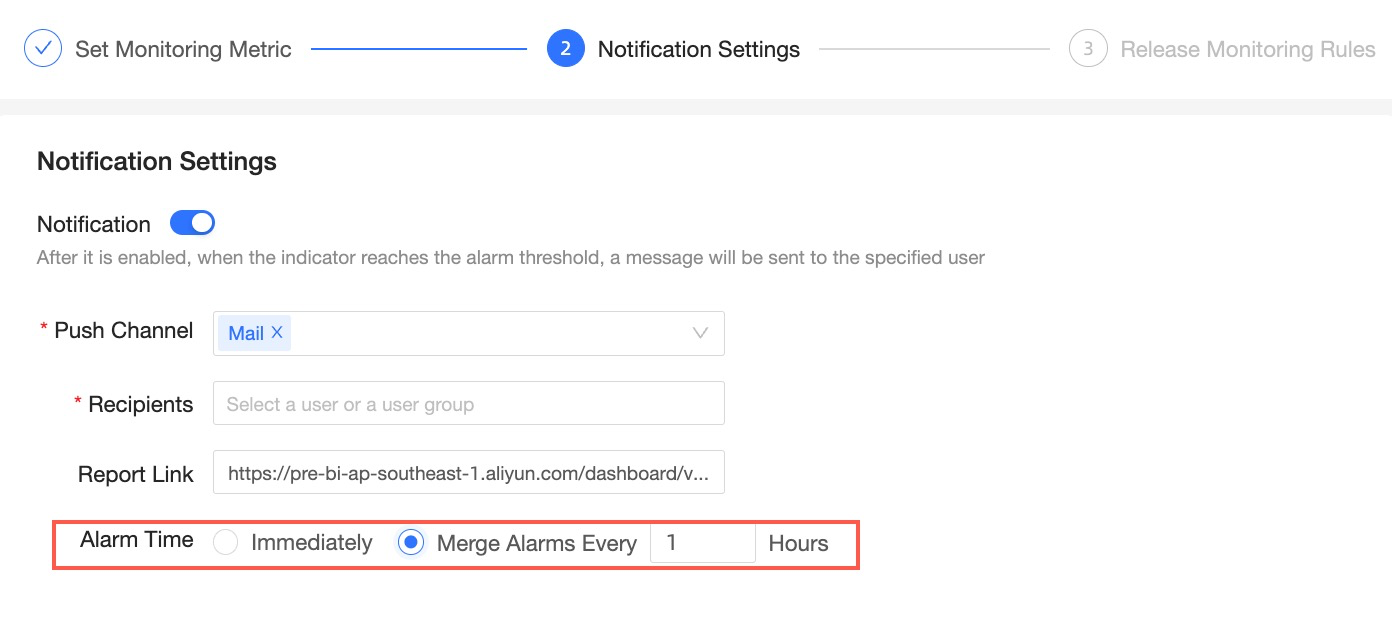
For more information, see Configure monitoring and alerting.
The metric monitoring center is fully upgraded. You can view the detailed data of dimension-split metrics and focus on the metrics that you are interested in. This makes the classification management of metrics easier.
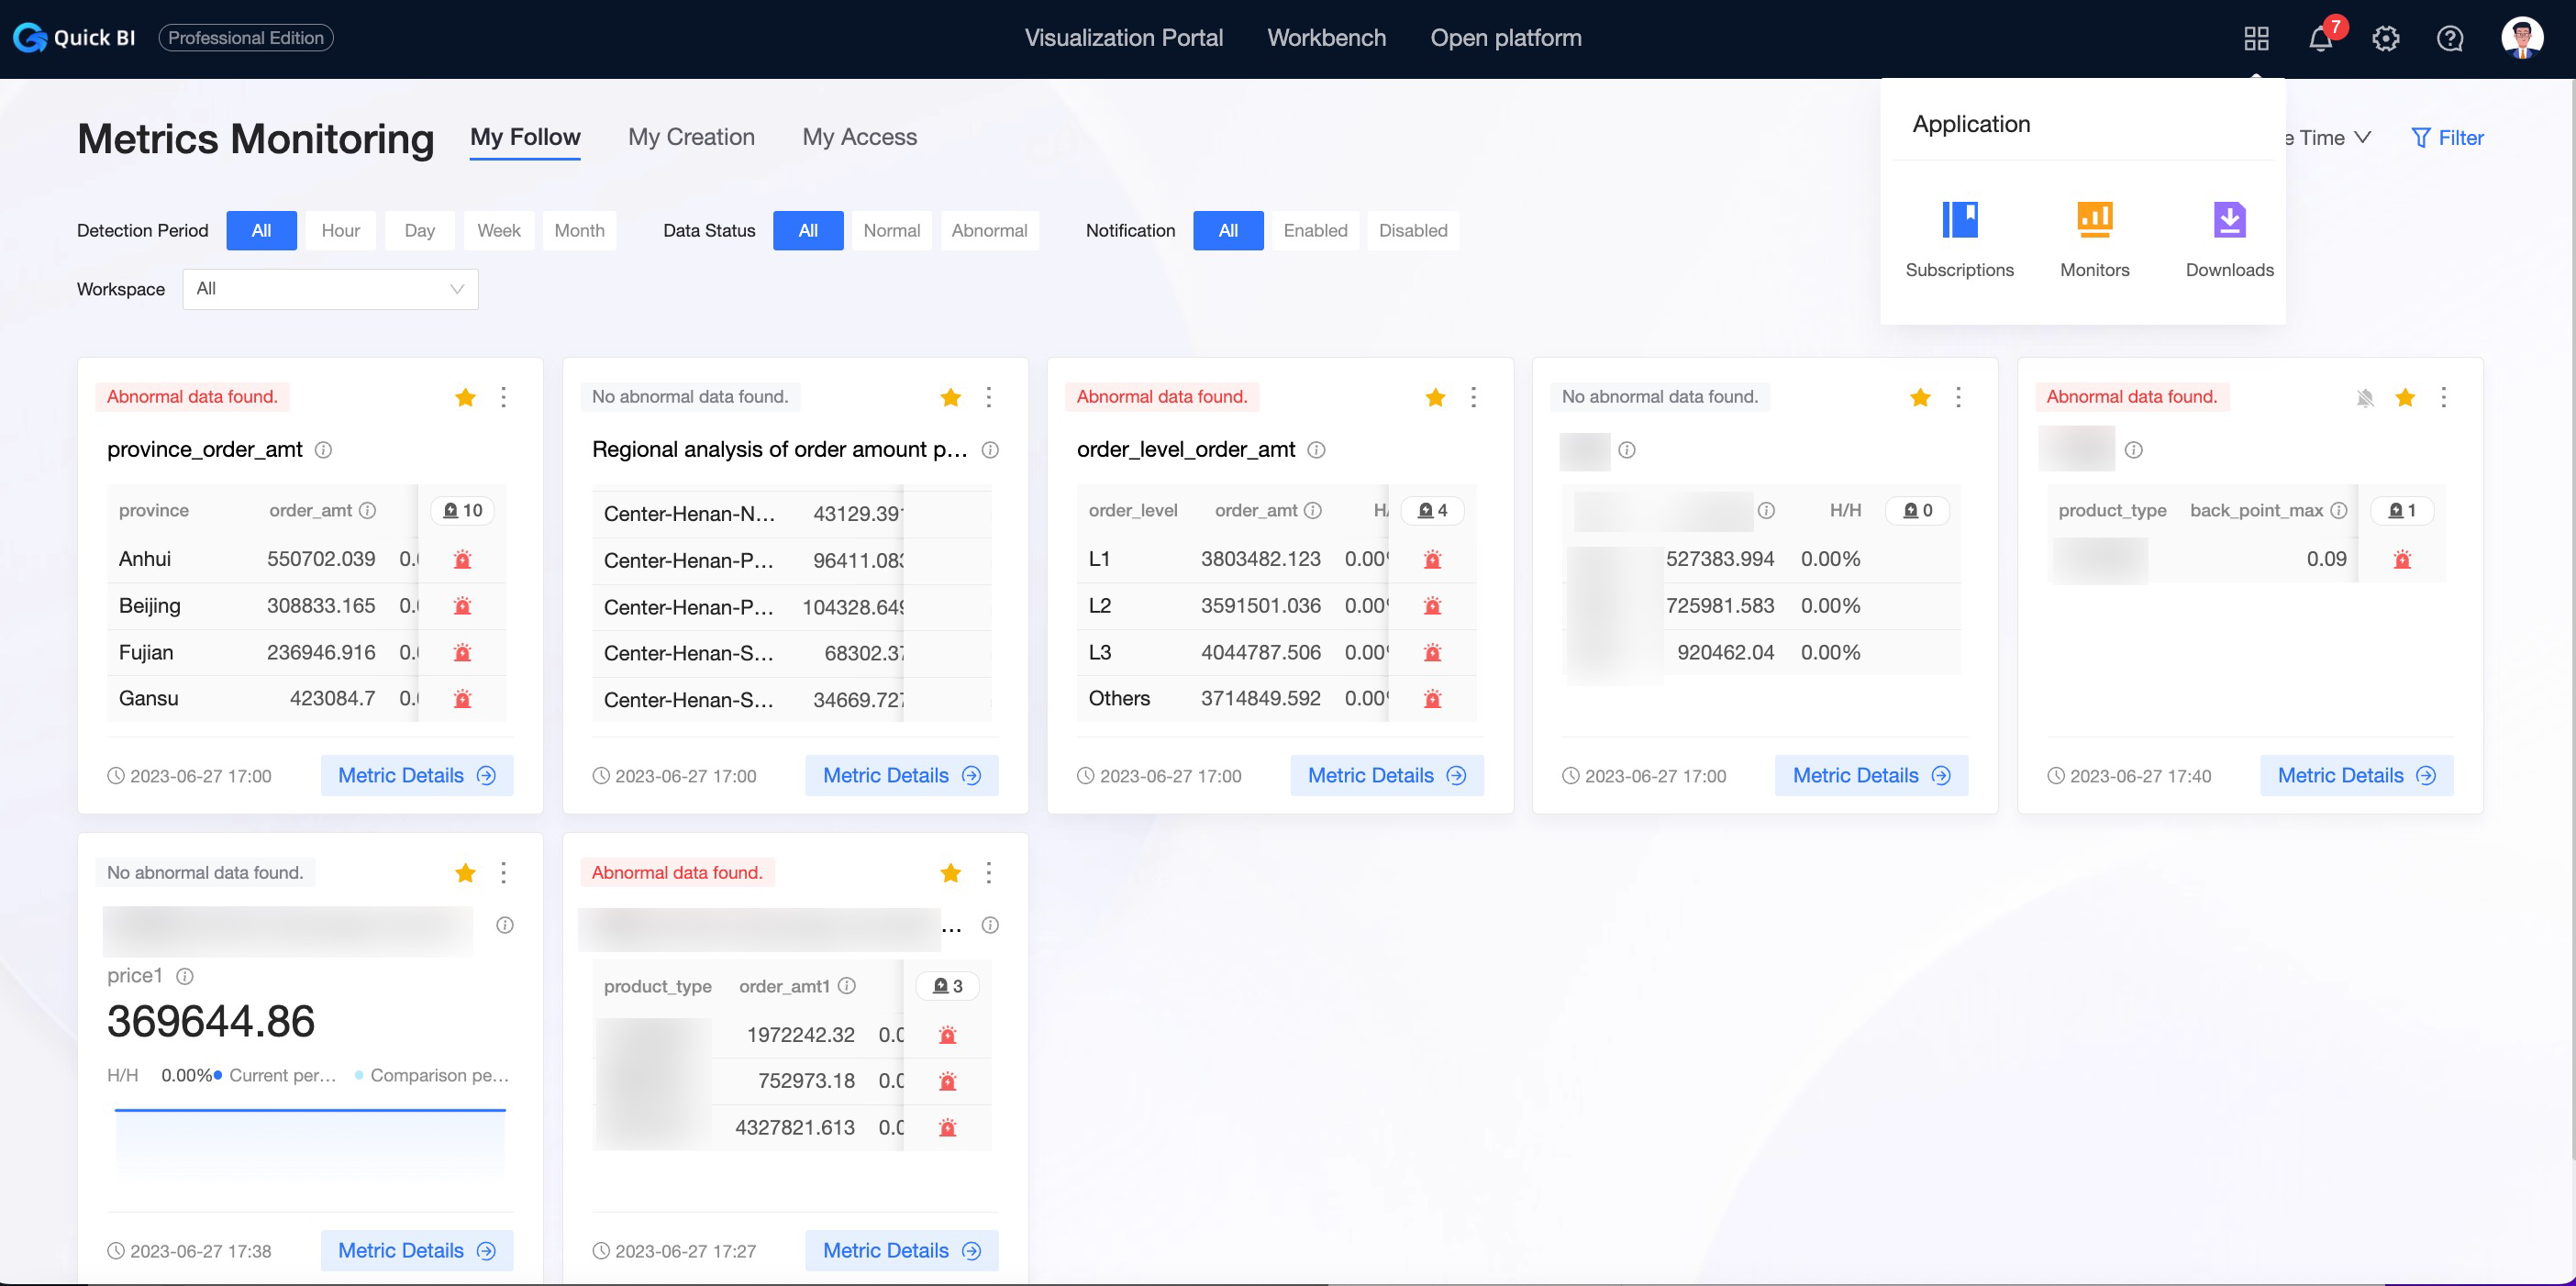
For more information, see View alert information.