This topic describes the release notes for Quick BI V4.3.4 and provides links to the relevant references.
Release date
September 27, 2022
Improved edit efficiency
Menus are adjusted to be lightweight.
Charts can be copied from one dashboard to another dashboard. The title of a chart can be modified after the title is clicked.
Shortcut keys for widgets are provided, and the style for multiple widgets can be configured at the same time.
The edit locking mechanism is optimized.
Subscription
The Attachment Type parameter can be set to PDF and the Screenshot Direction parameter can be set to Vertical or Horizontal for a subscription task.
The owner of a subscription task can be changed.
User groups can be configured as recipients of a subscription task.
If workbooks are selected in a subscription task, only attachments can be sent to recipients.
For more information, see Create a subscription task and Manage subscription tasks.
Forms
The number of rows in a form that you upload from your on-premises machine cannot exceed 500,000.
An event of the forms type for a cross table can be modified.
The year, month, quarter, or week can be specified in the date control.
The tree drop display supports a maximum of five levels.
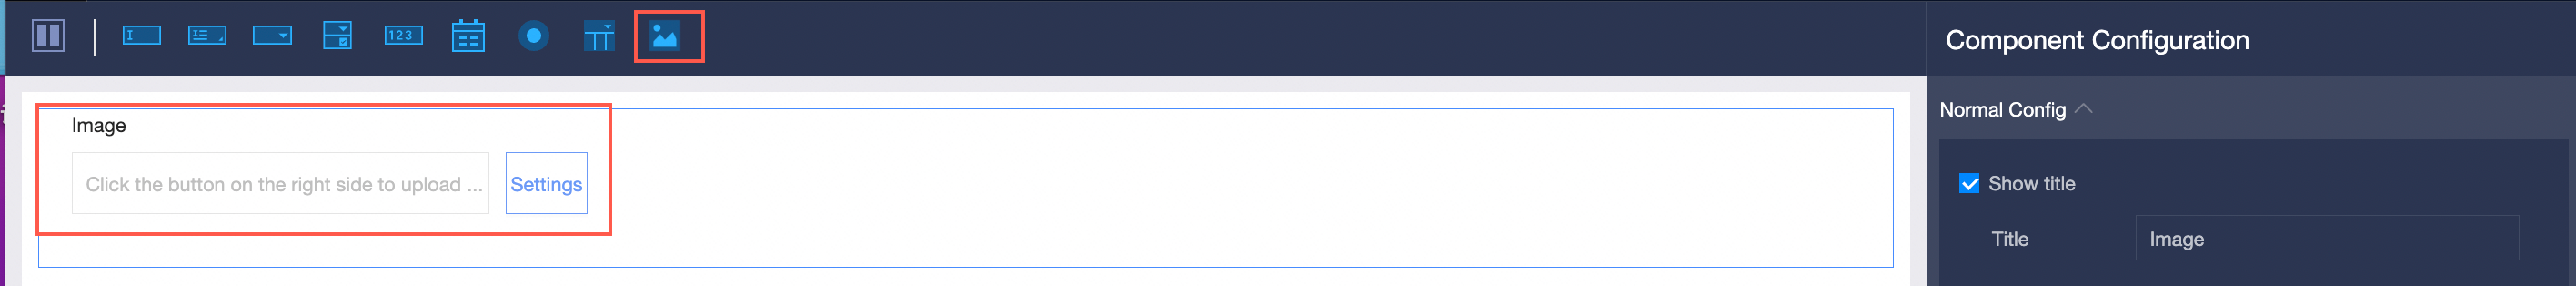
A control that is used to upload images is provided.
PolarDB data sources are supported.
For more information, see Controls and Manage data in a form.
Filter bars
In a filter bar, fields on the following tabs can be selected at the same time: Dimension, Measure, SQL parameters, and SQL placeholders.
A global filter bar can be expanded or collapsed.
Specific fields can be dragged to automatically generate a filter bar.
The date granularity can be changed in a filter bar.
For more information, see Create a filter bar and Query data based on a date field.
Workbooks
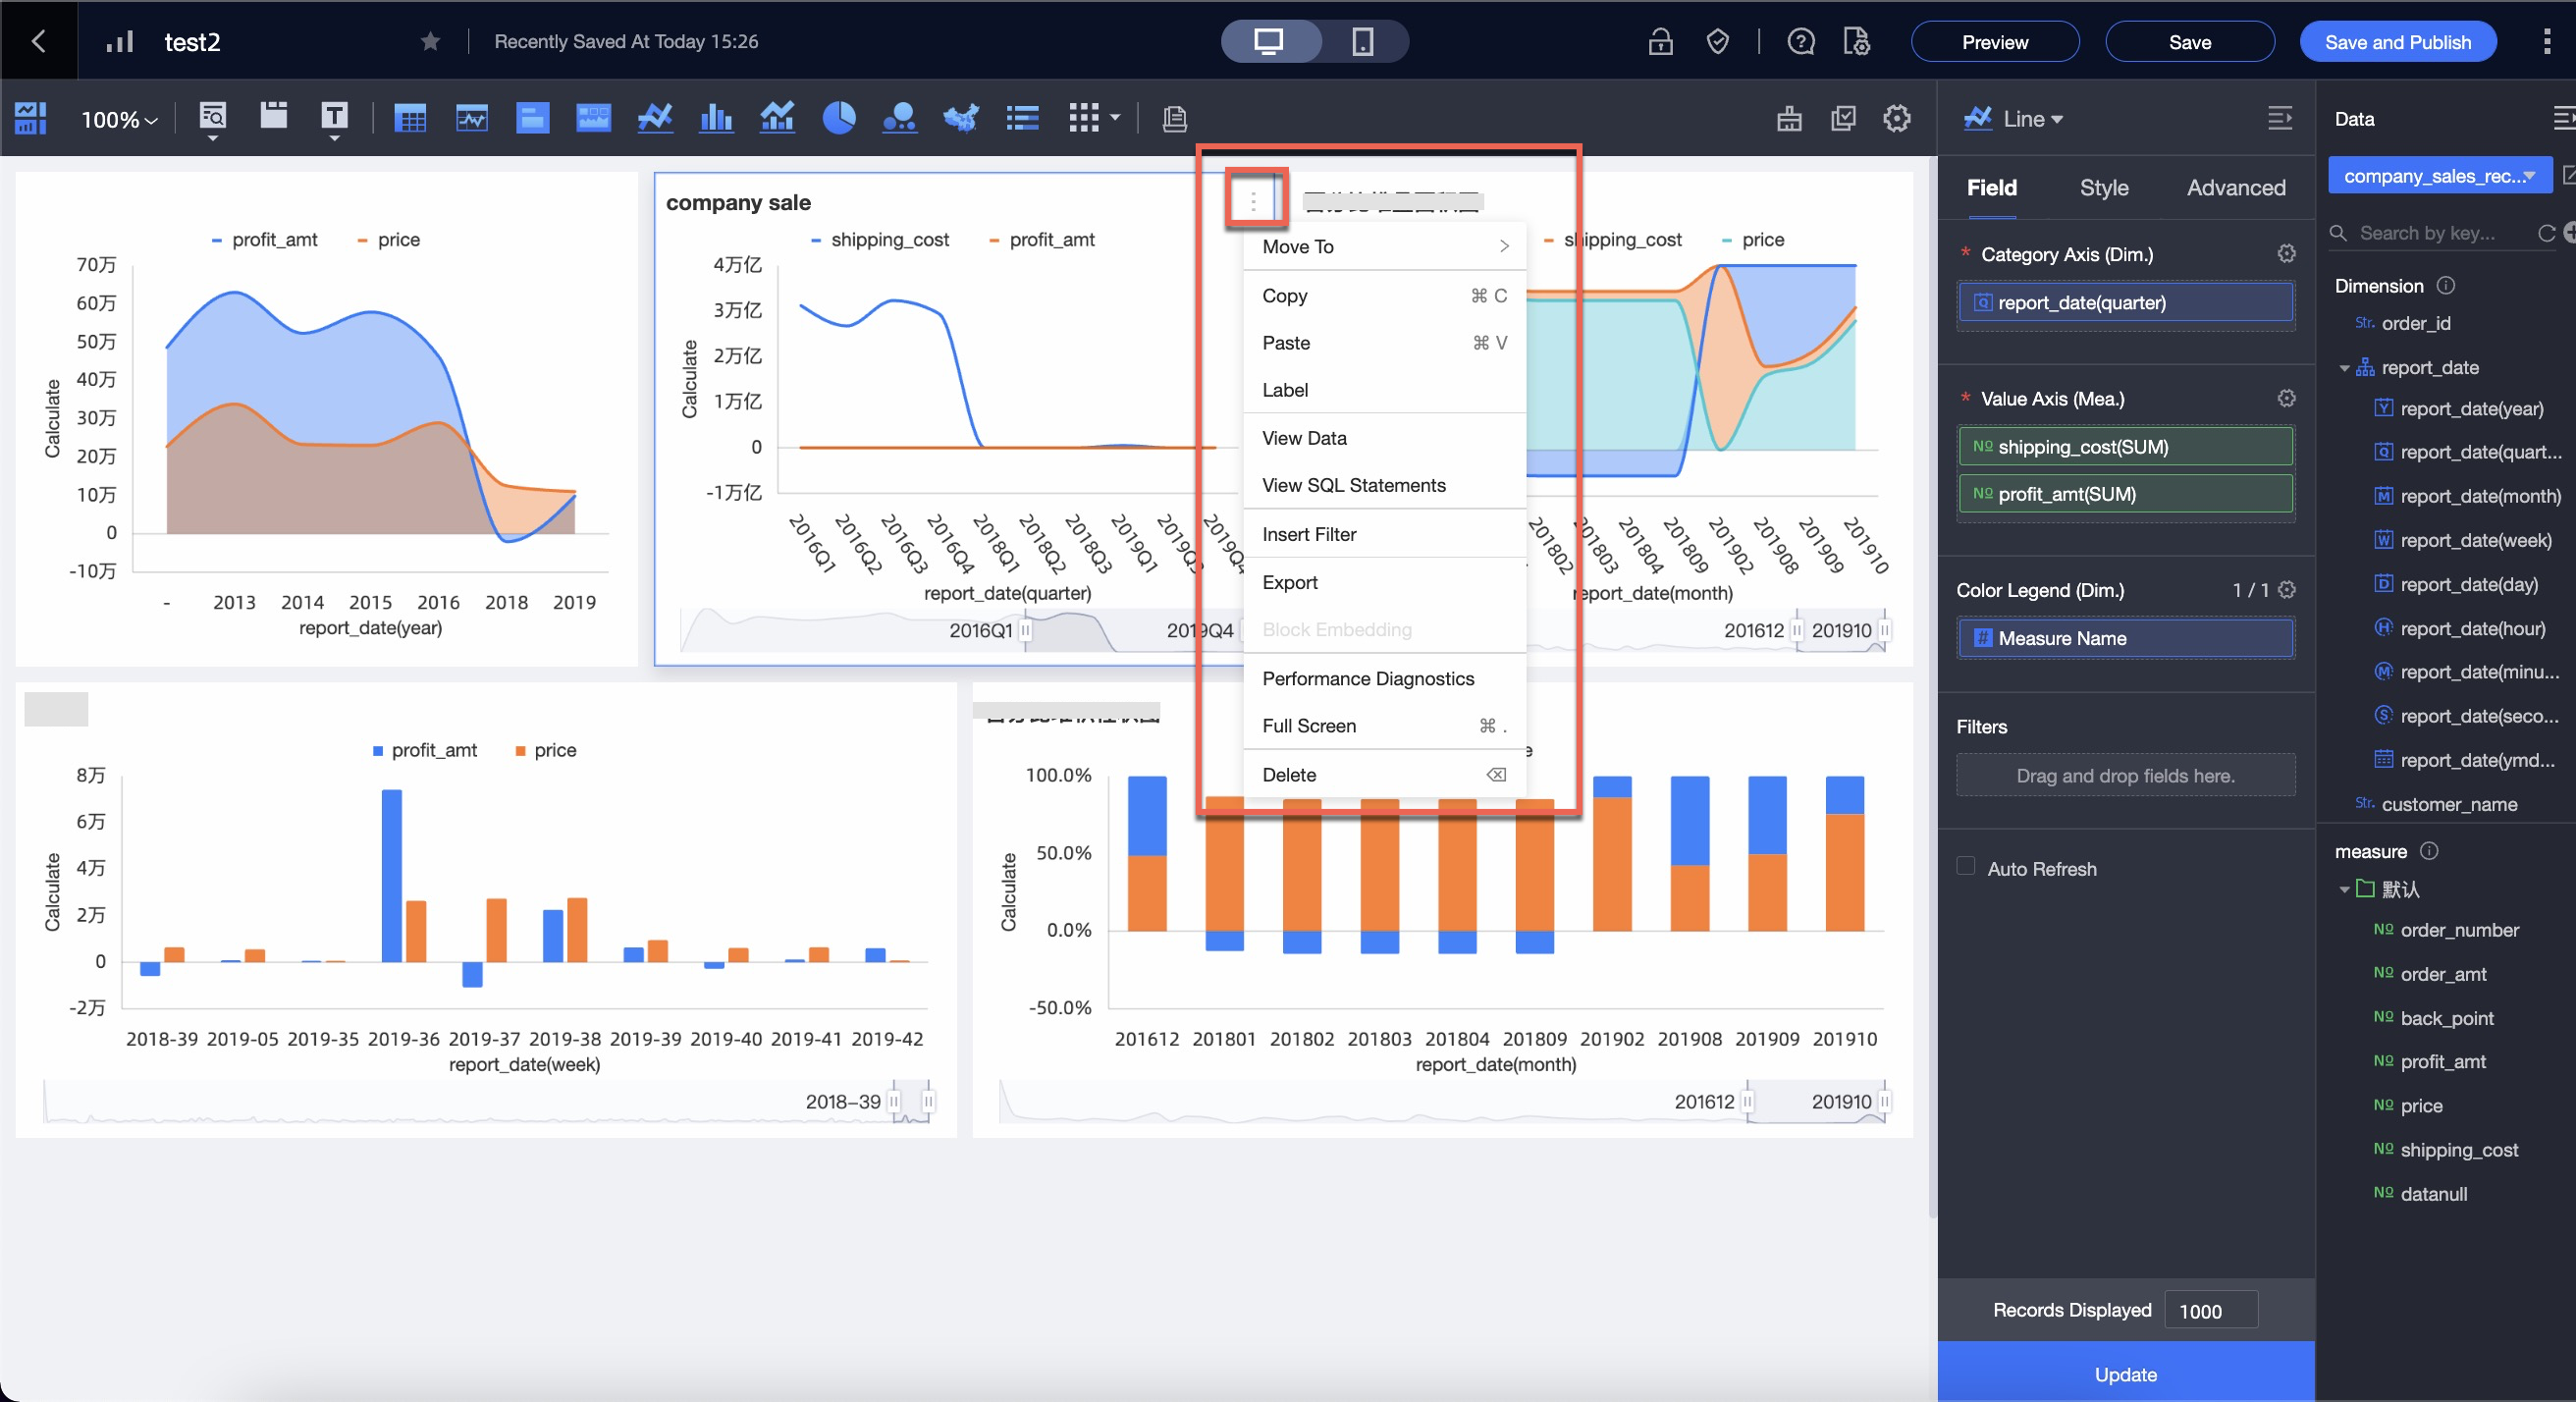
The shortcut menu of workbooks is optimized.
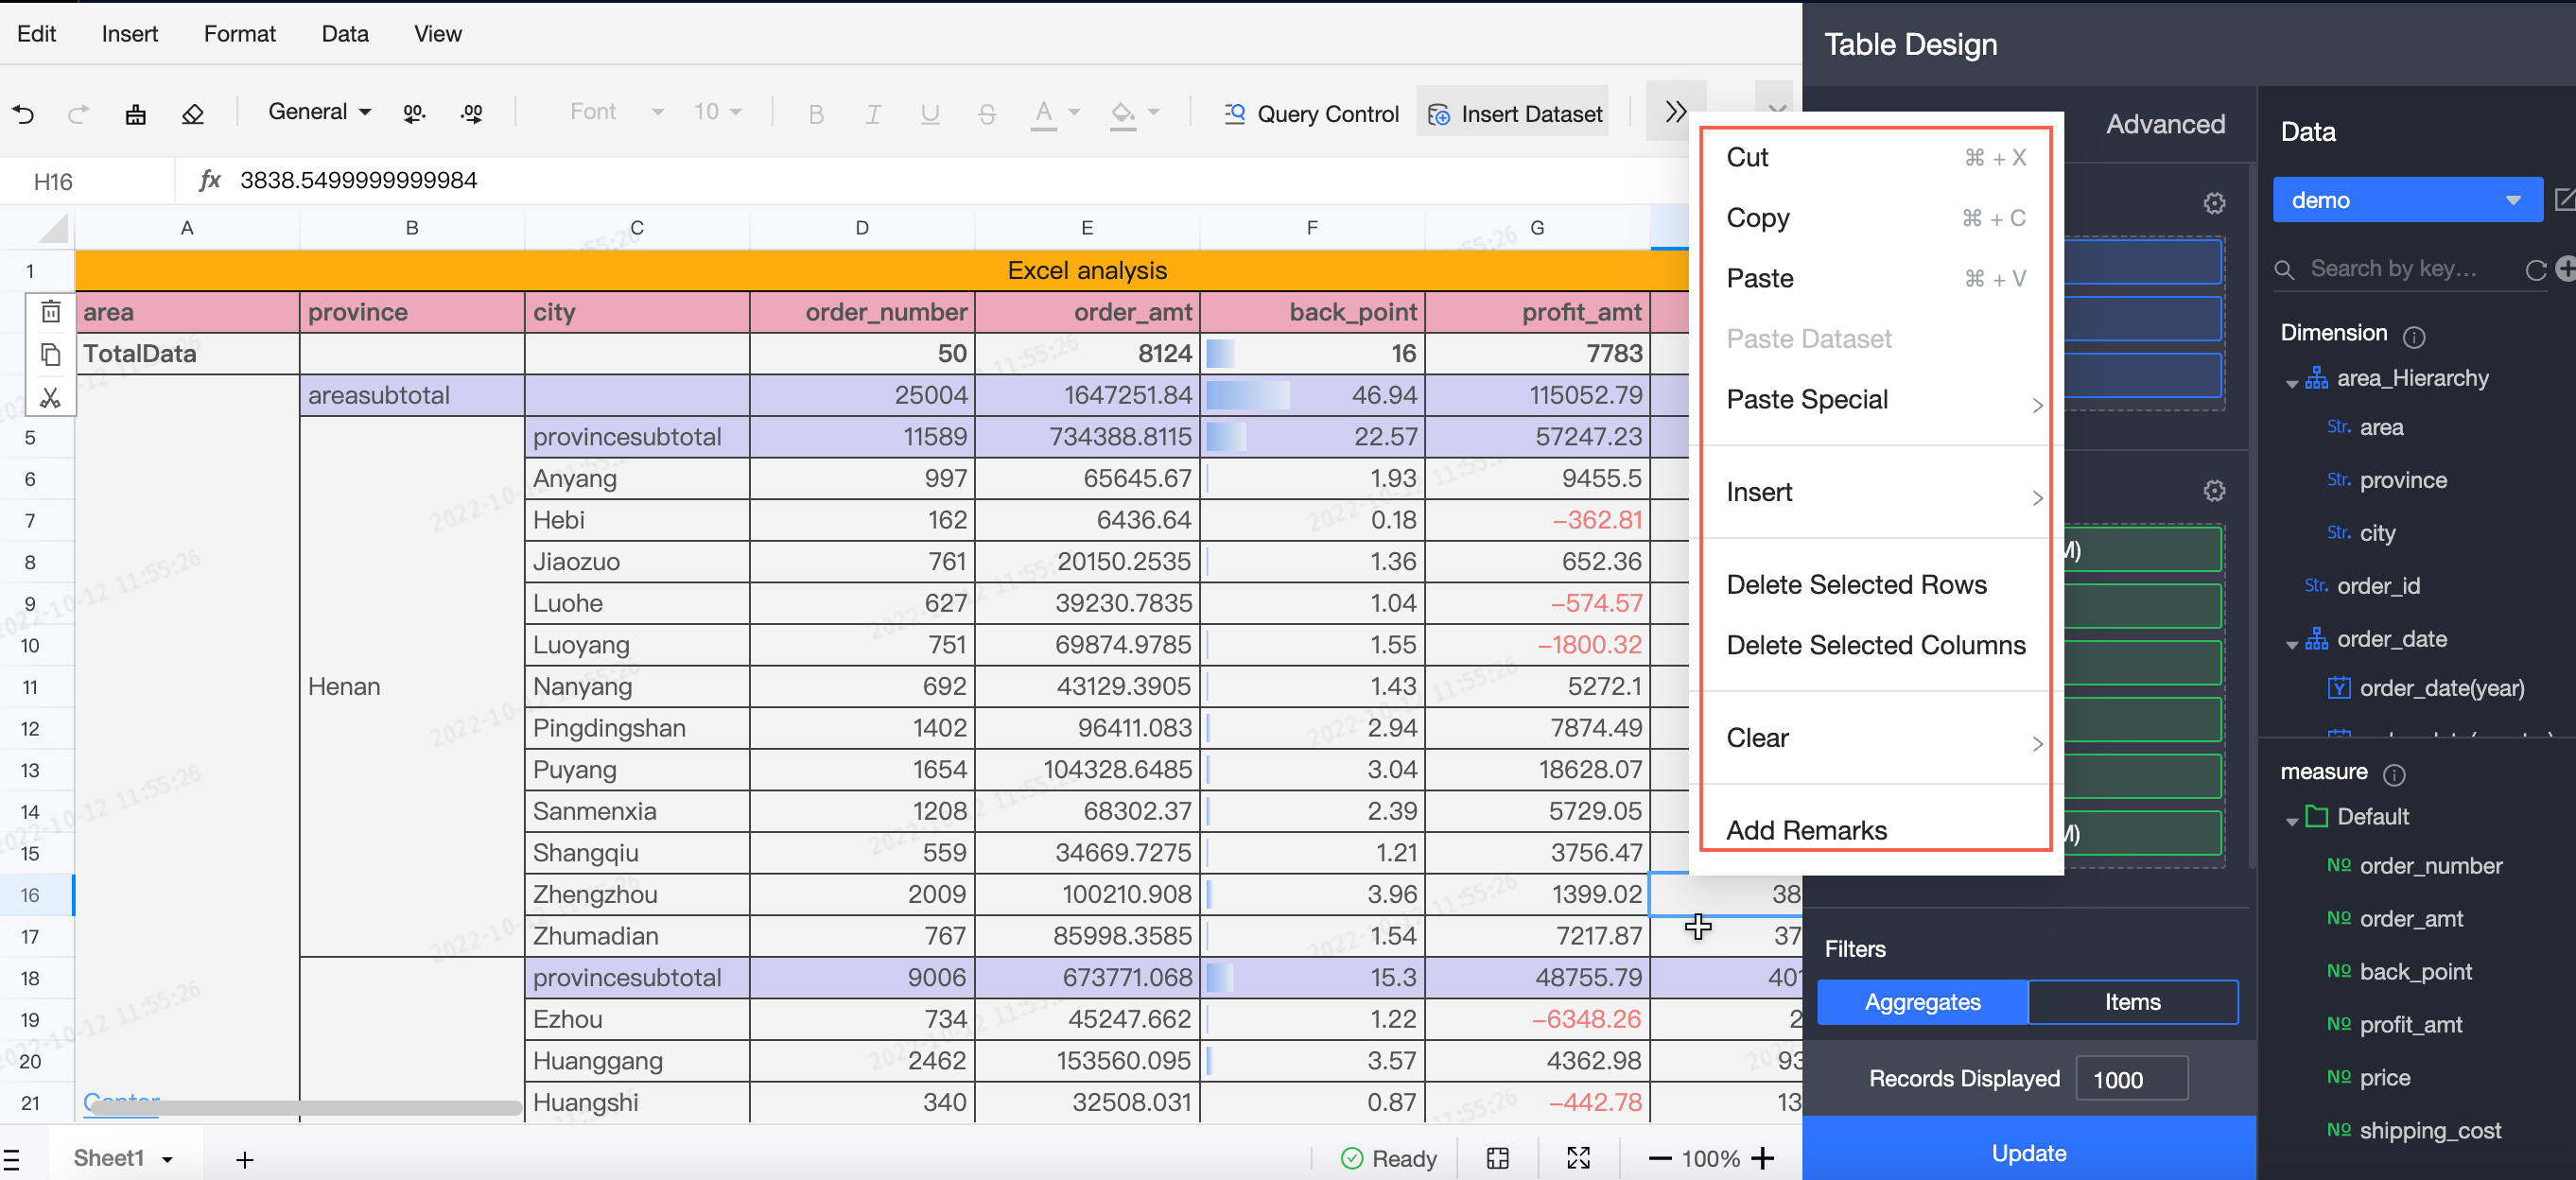
The data panel is updated and the block configuration is added.
The Conditional Formatting parameter is added for datasets.
Data can be exported in a PDF file by page. This improves data completeness.
The analysis mode is supported.
For more information, see Create a workbook and Configure a workbook.
Personal portals
The portal for My Kanban is added to the homepage of Quick BI.
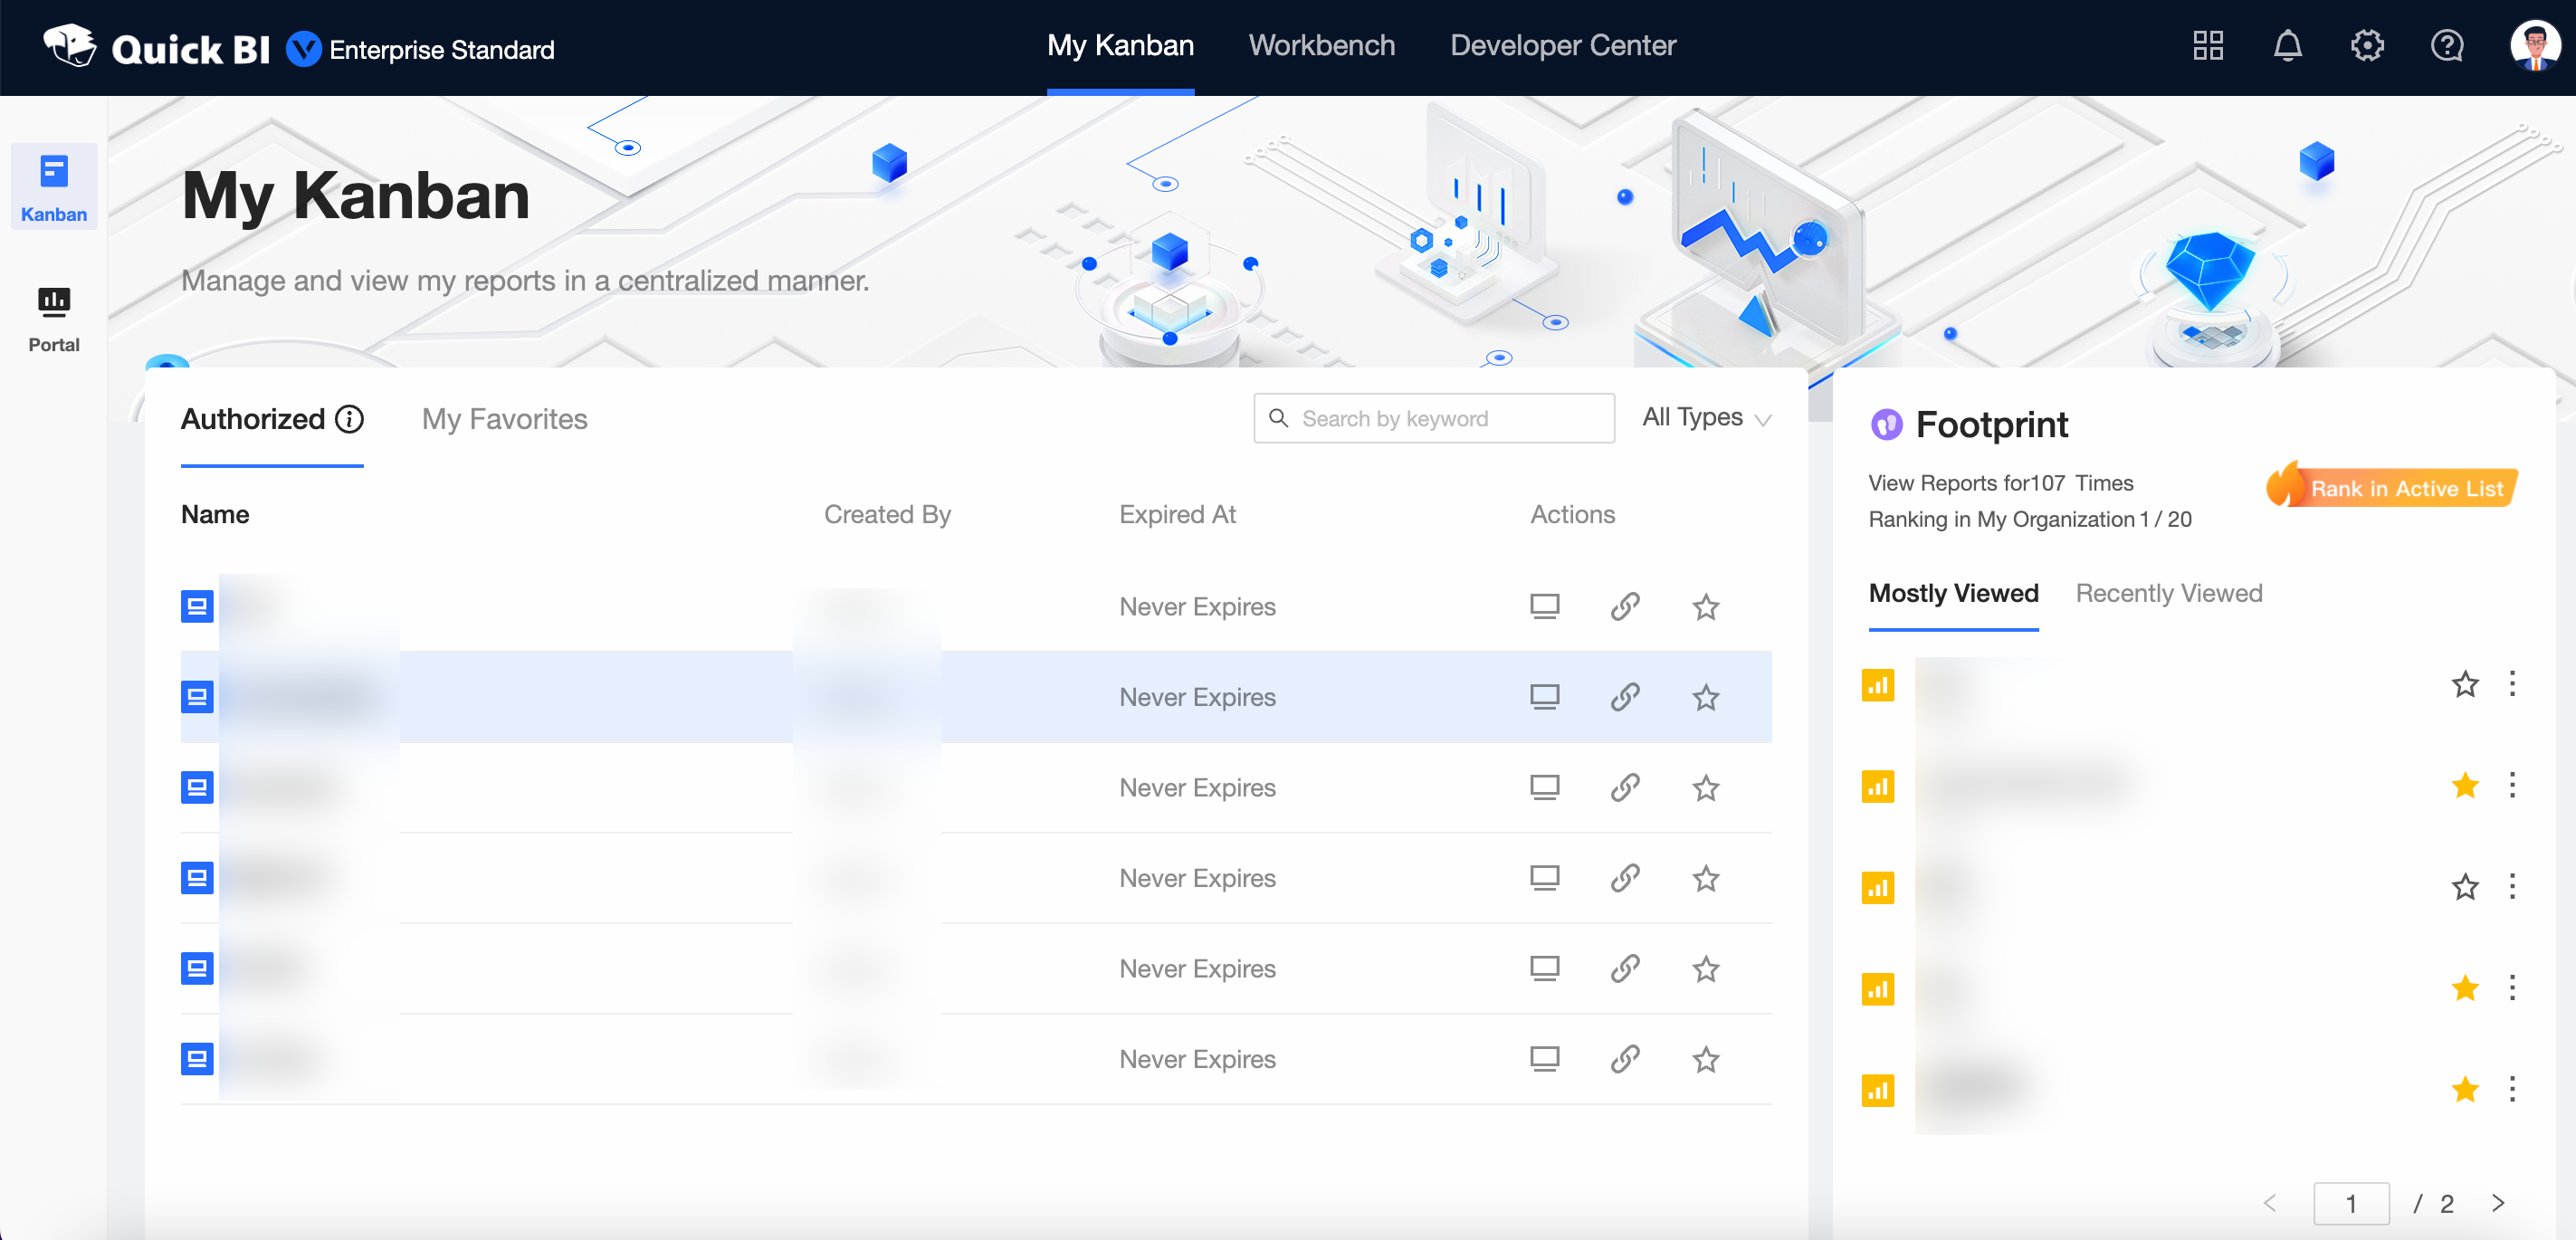
For more information, see GUI elements in the Quick BI console.
Ad hoc query
By default, the Show Total parameter in the Page Settings panel of an ad hoc query is not selected.
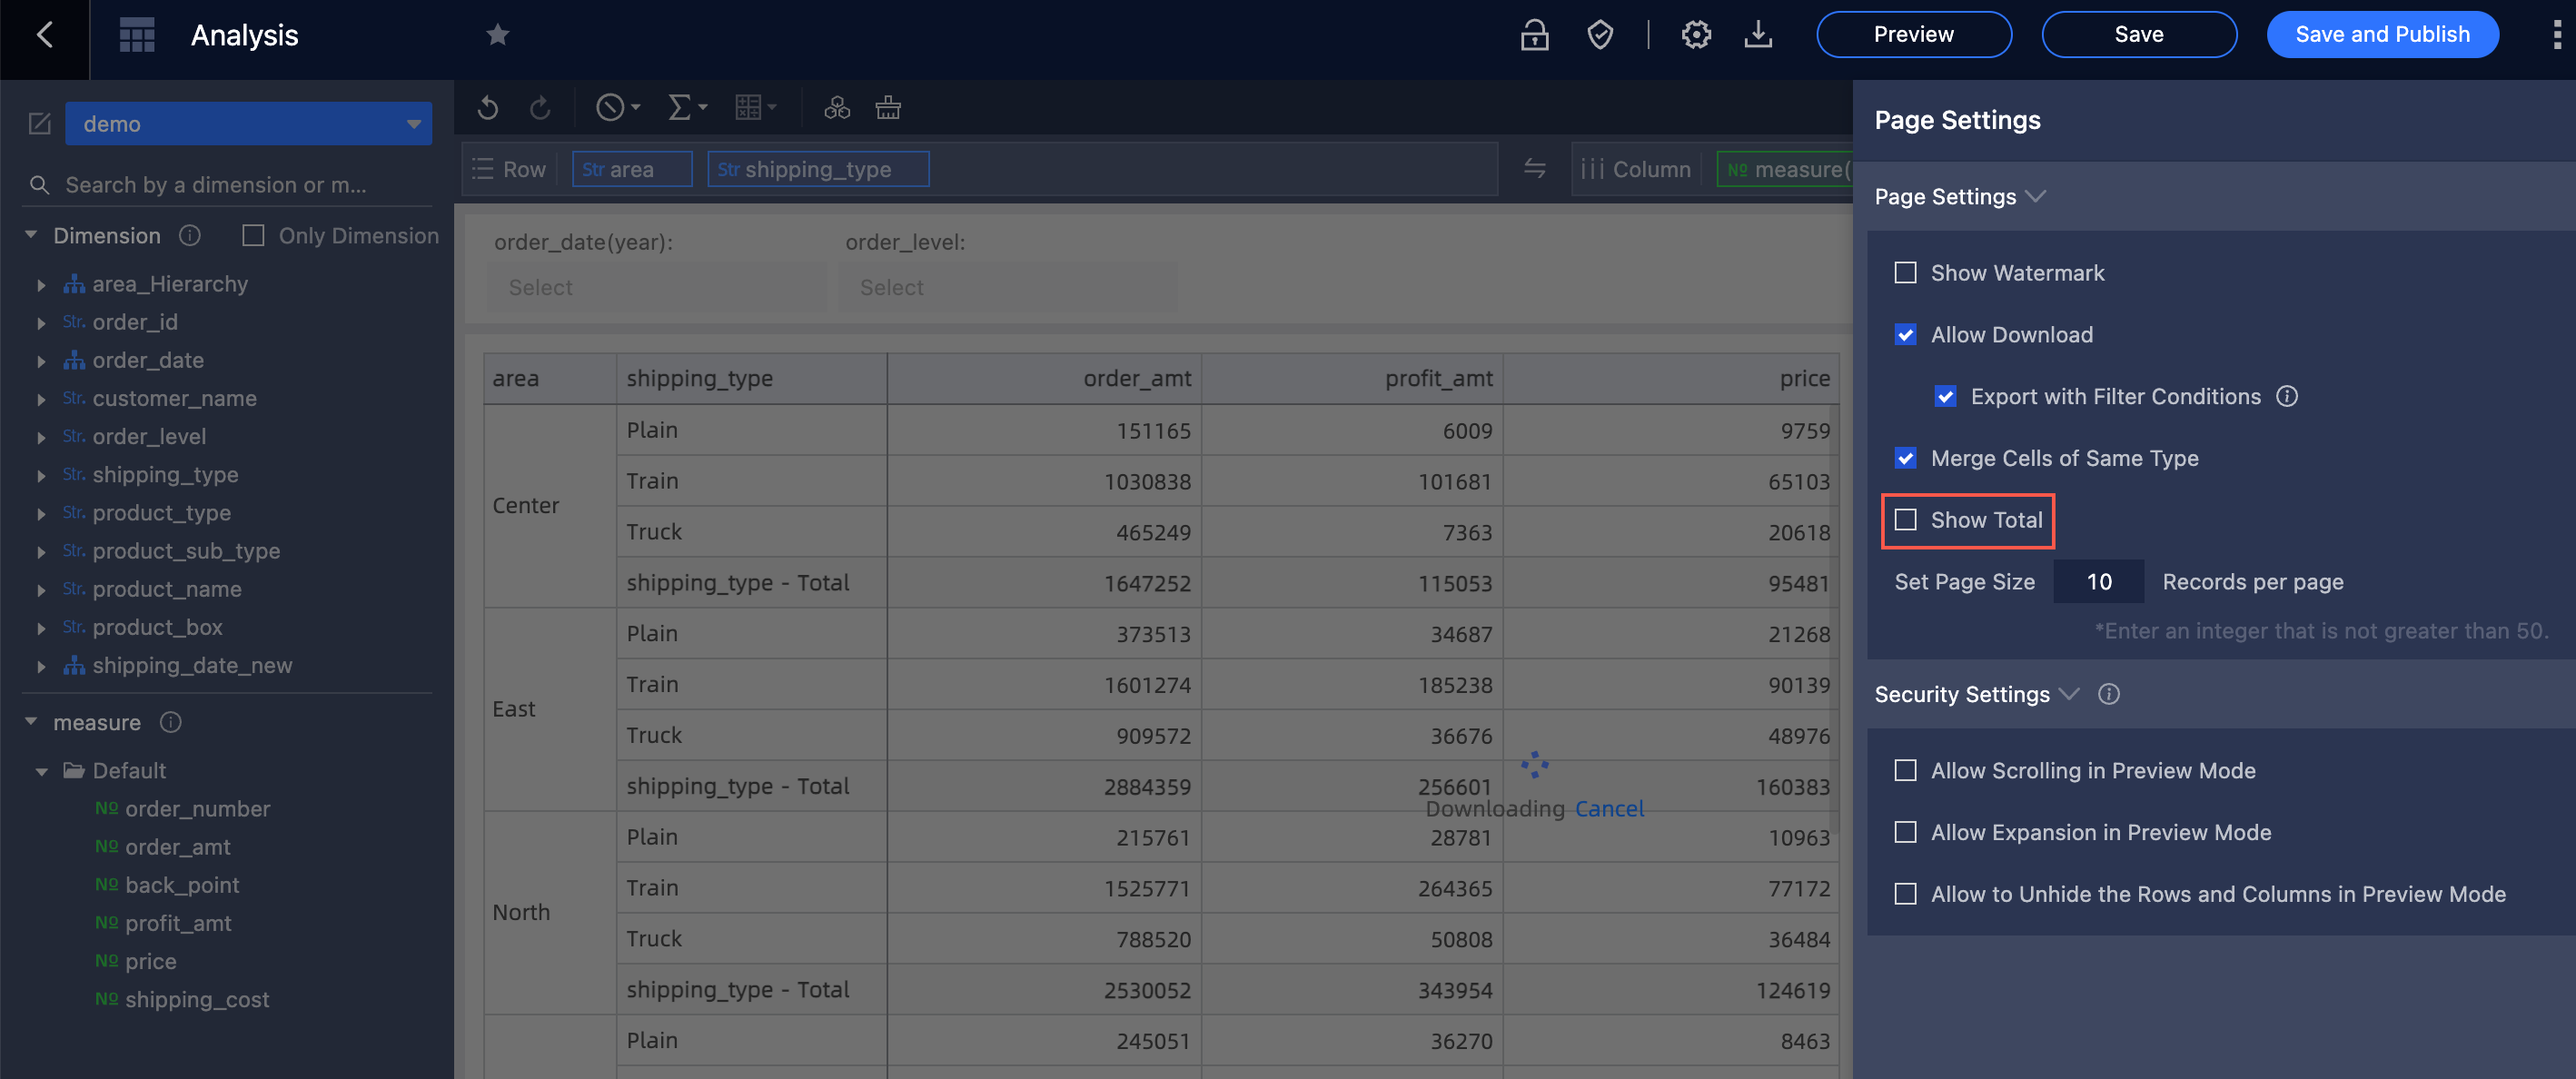
By default, the Merge Cells of Same Type parameter in the Page Settings panel of an ad hoc query is not selected.
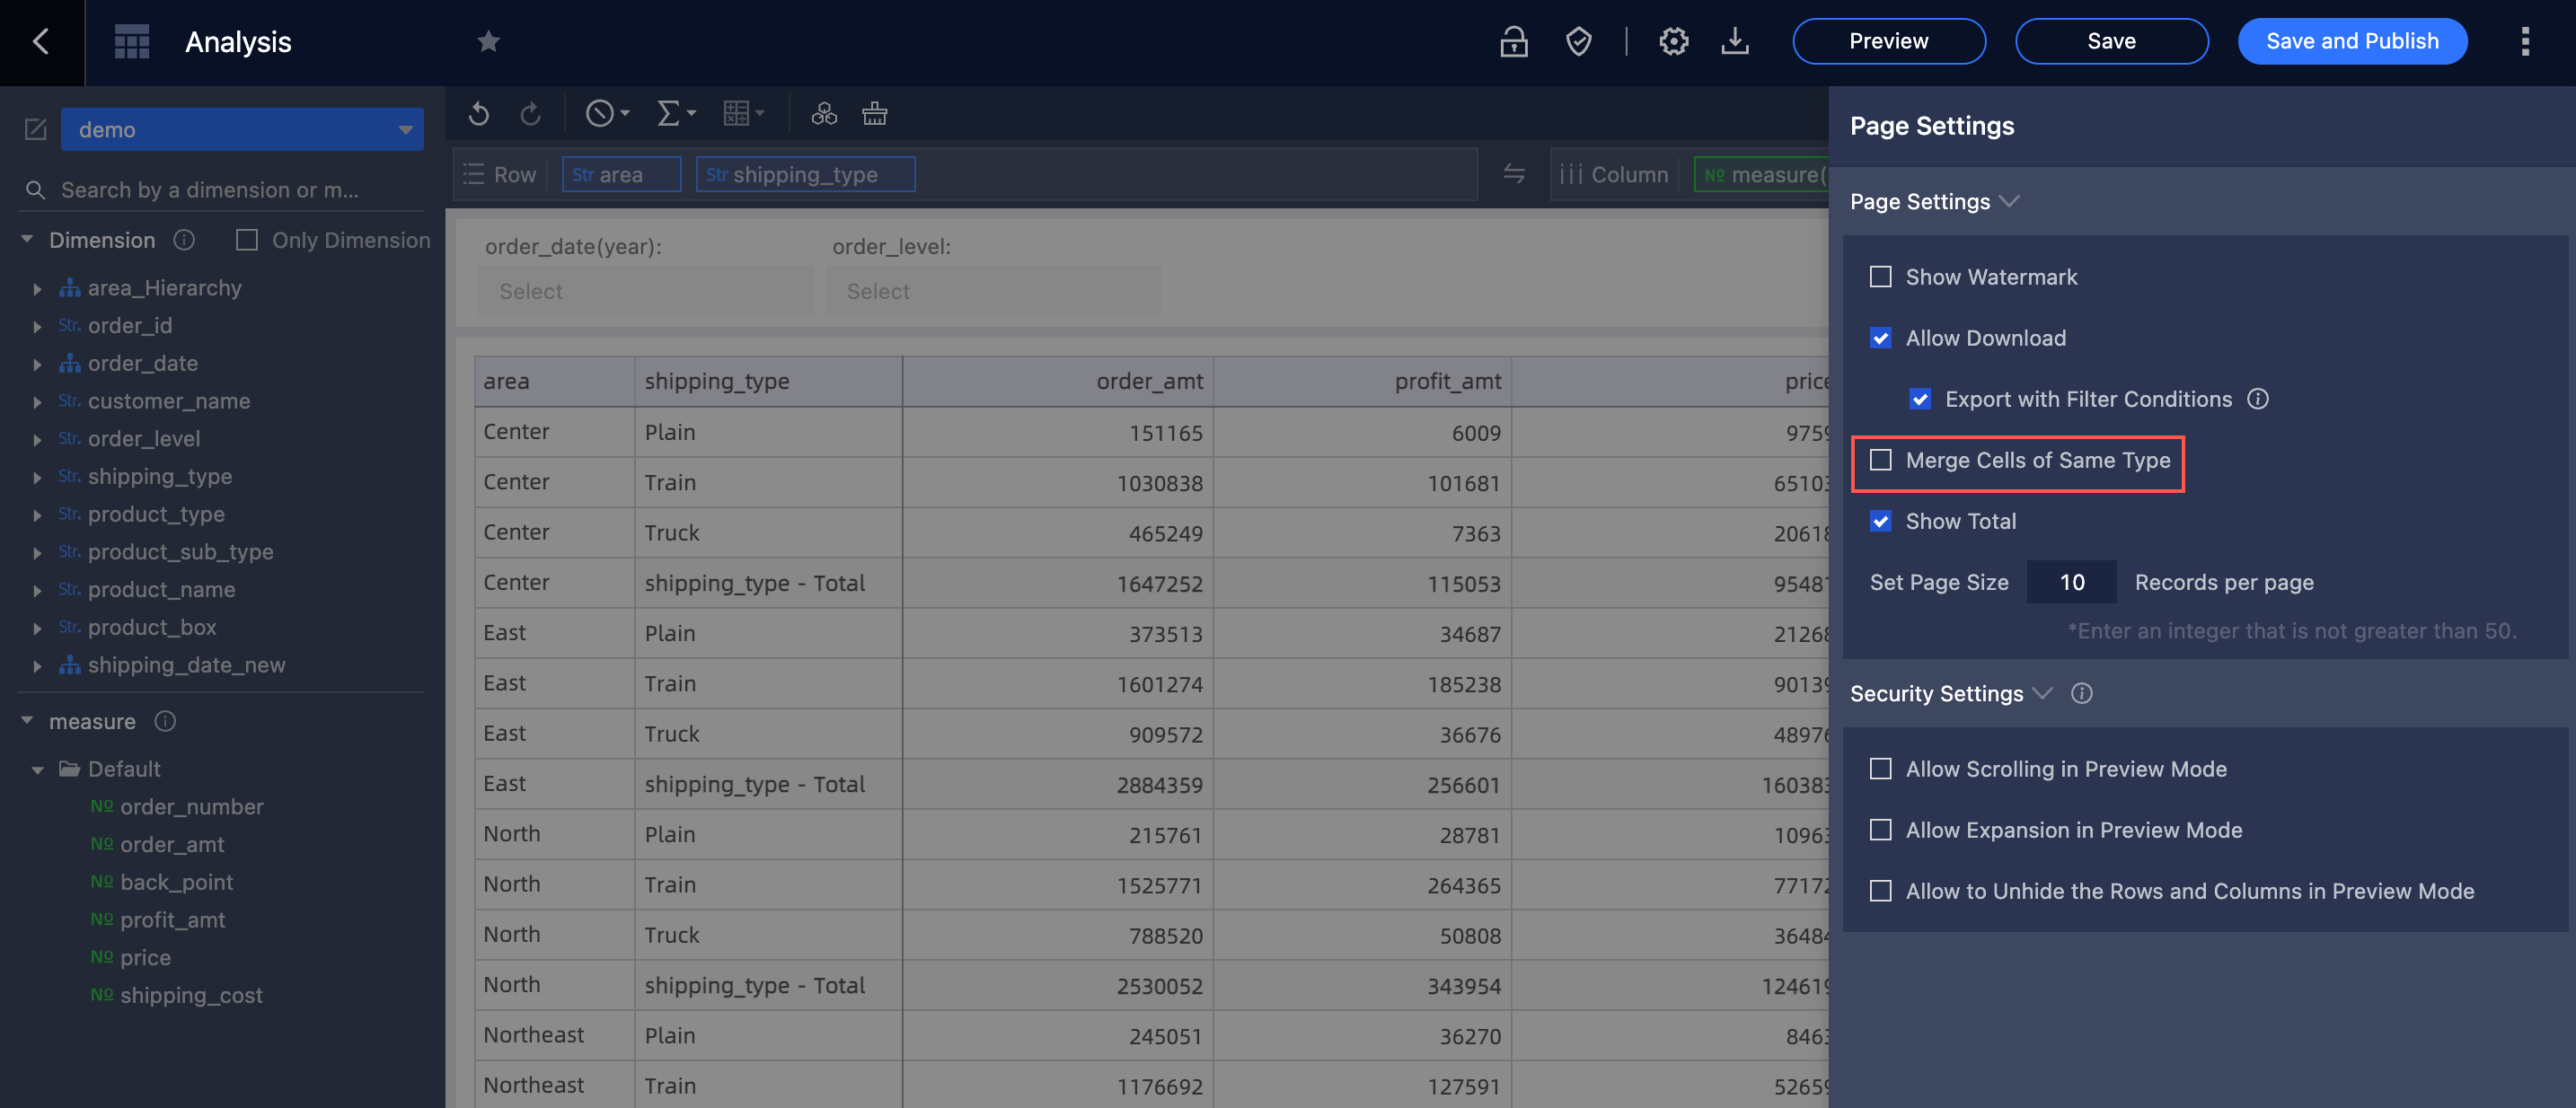
For more information, see Perform operations in the Page Settings panel in an ad hoc query.
Datasets
The cache of multiple datasets can be cleared at the same time.
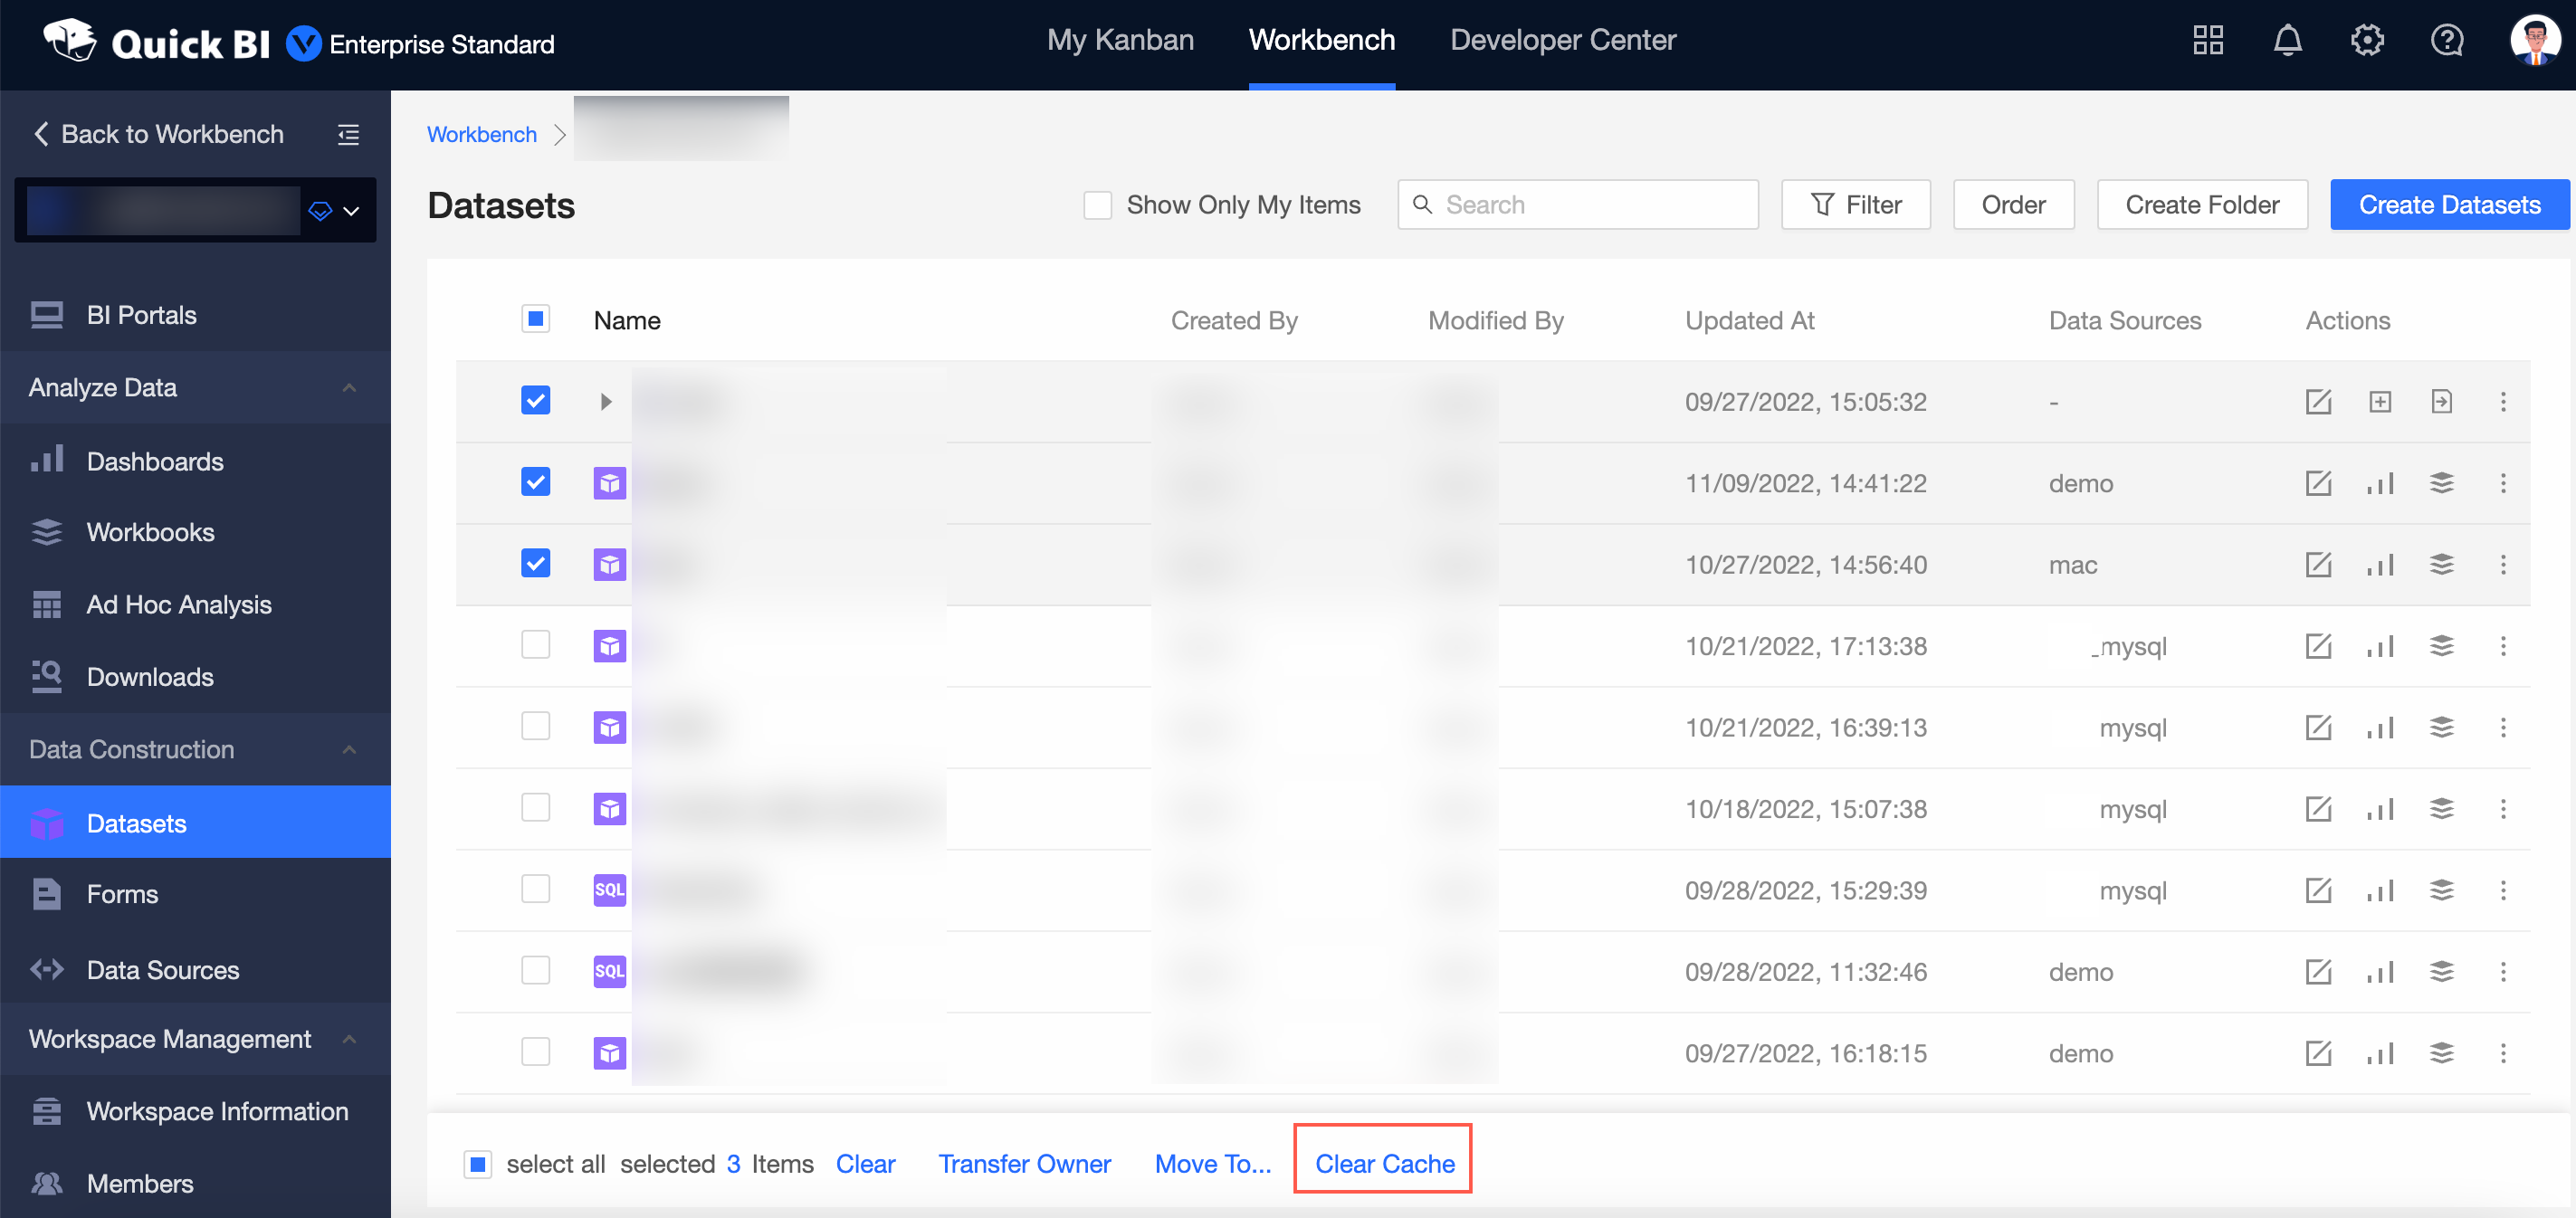
For more information, see Manage datasets.
The time at which the system automatically clears the cache can be specified.
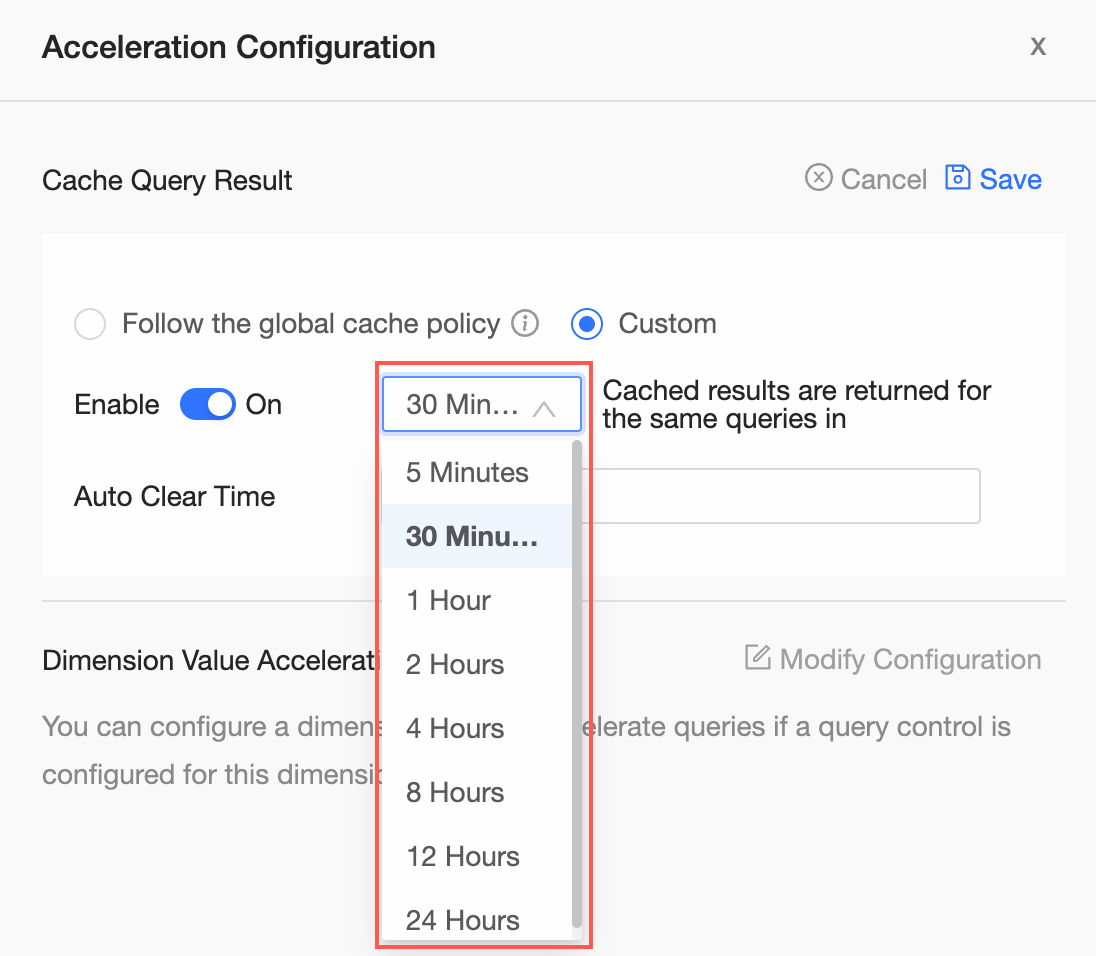
For more information, see Configure the Acceleration Engine of Quick BI.
BI portals
Ad Hoc Analysis can be selected from the Content settings section on the Quick BI Portals page.
For more information, see Create a BI portal.
Data sources
MongoDB data sources are supported.
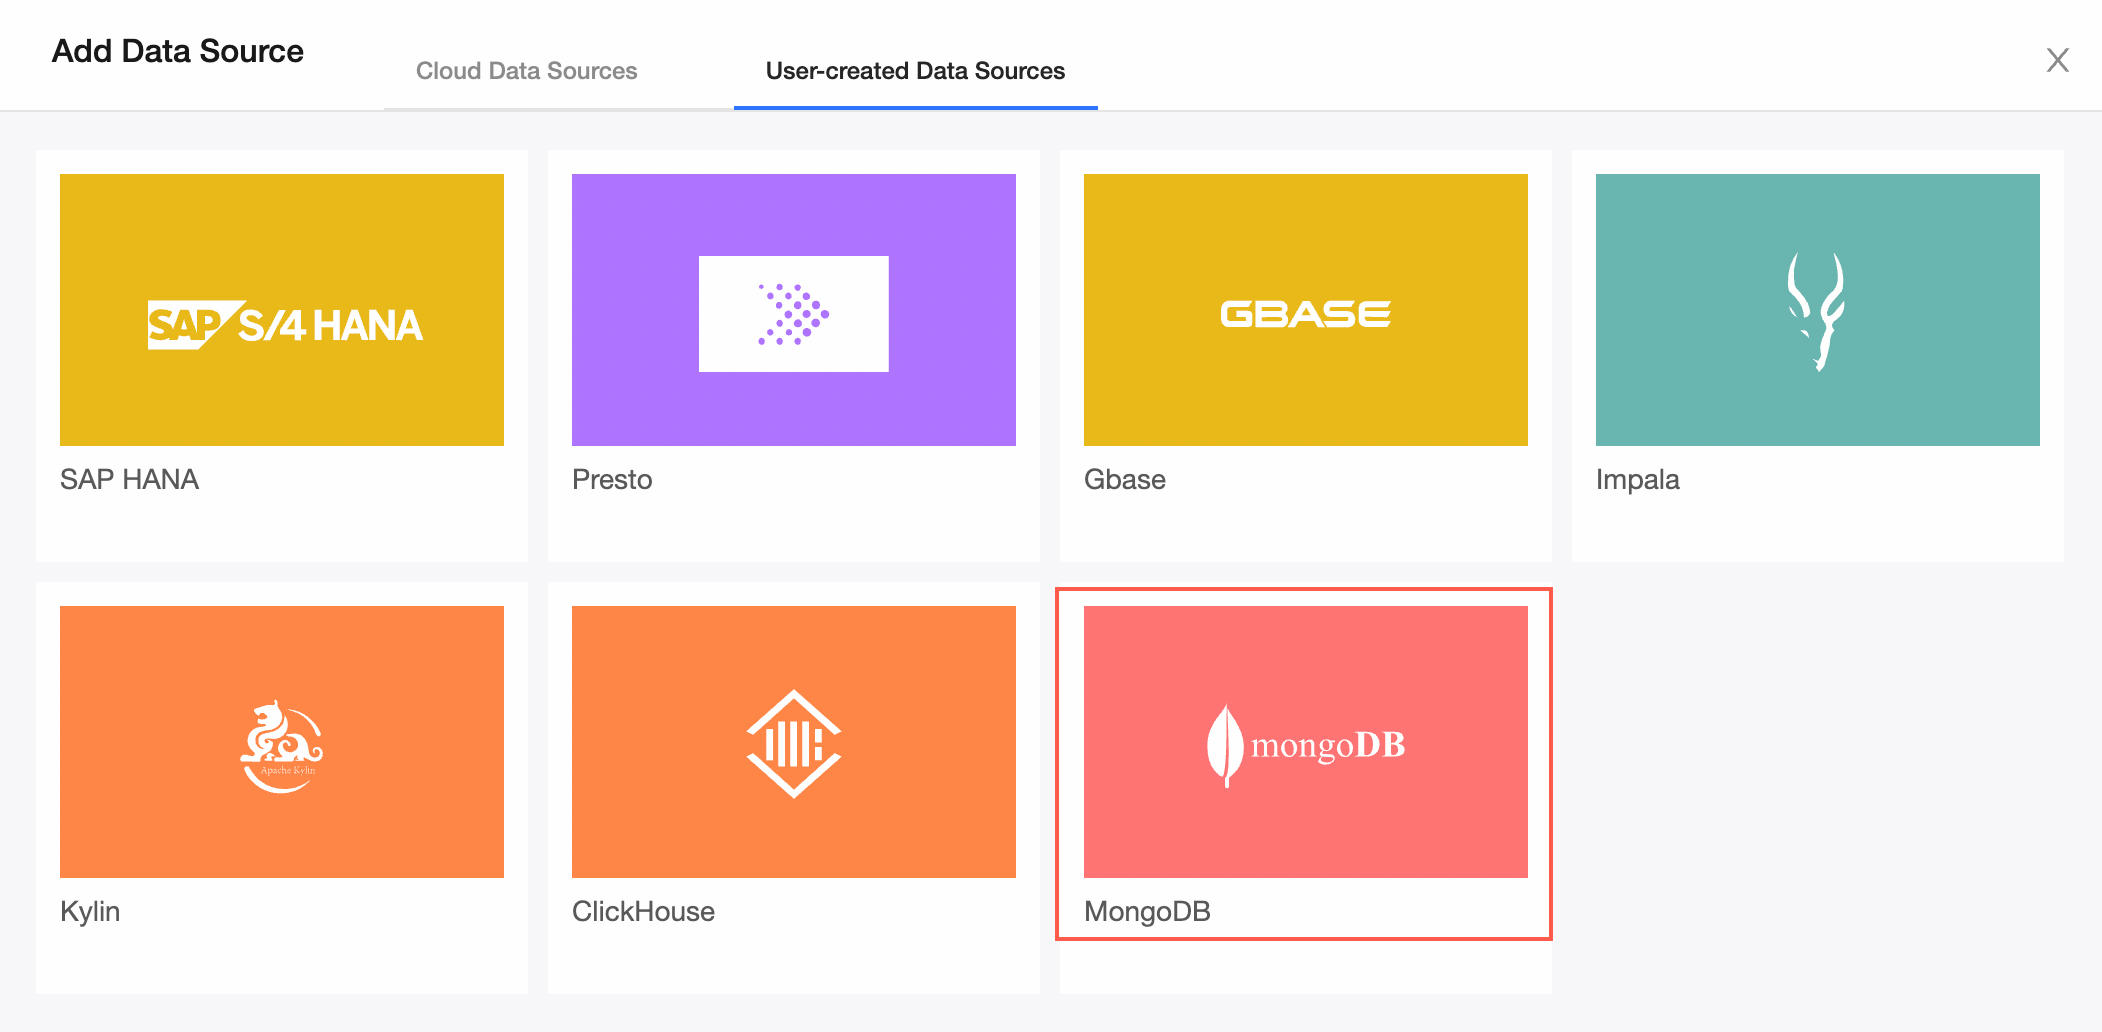
For more information, see Add a user-created data source MongoDB.
In the Add Hologres Data Sources dialog box, the AccessKey ID and AccessKey Secret parameters are used to replace the username and password.
For more information, see Add a Hologres data source.
Dashboards
Custom geographic locations can be configured on a map.
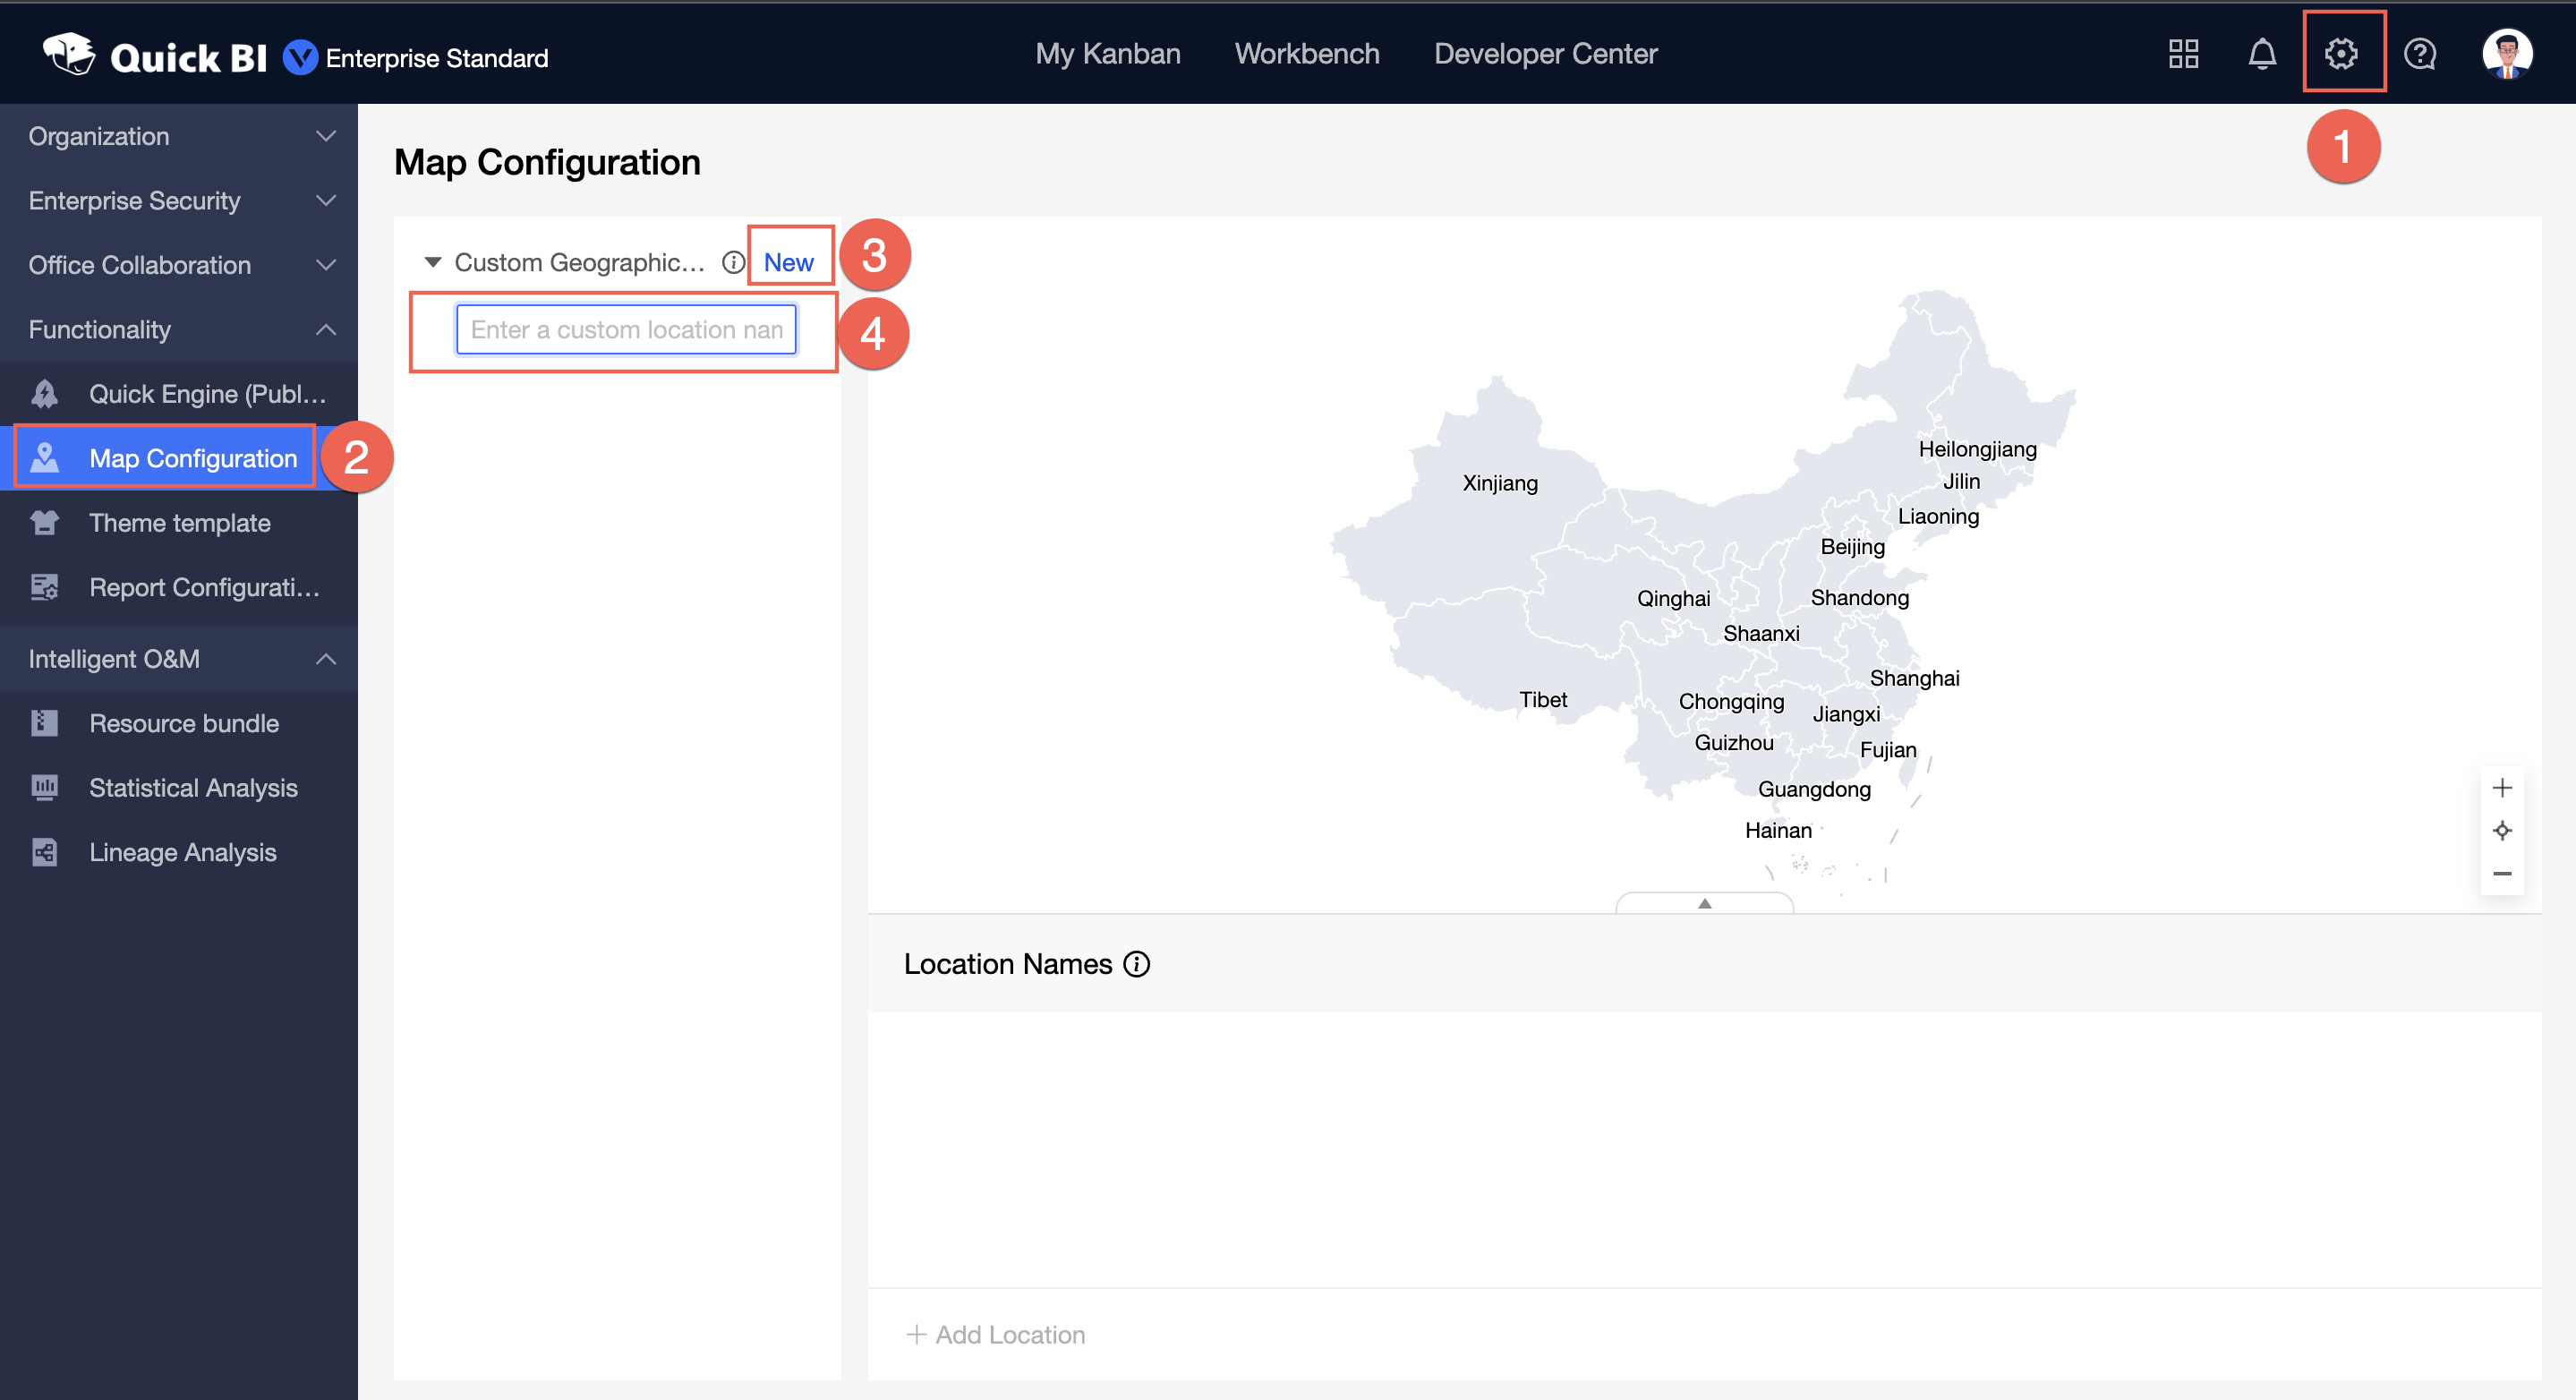
For more information, see Configure a custom geographic location.
A custom bubble shape can be configured for an LBS flying line map.

For more information, see LBS flying line map.
Colors can be configured for low analysis charts.
The color scale configuration is optimized, and colors can be configured for multiple measures.
Custom totals can be configured for pie charts.
For more information, see Pie chart.
The minimum value can be manually configured for non-stacked line charts or bar charts.
The position of the title for the coordinate axis of a chart that is displayed on a PC is optimized.
With Conditions in Filter Bar and Linkage can be selected for the hyperlink feature for a ticker board or a combination chart.
For more information, see Drilling, filter interaction, and hyperlink.
For cross tables of the new version, different aggregation methods can be configured for different fields of a subtotal.
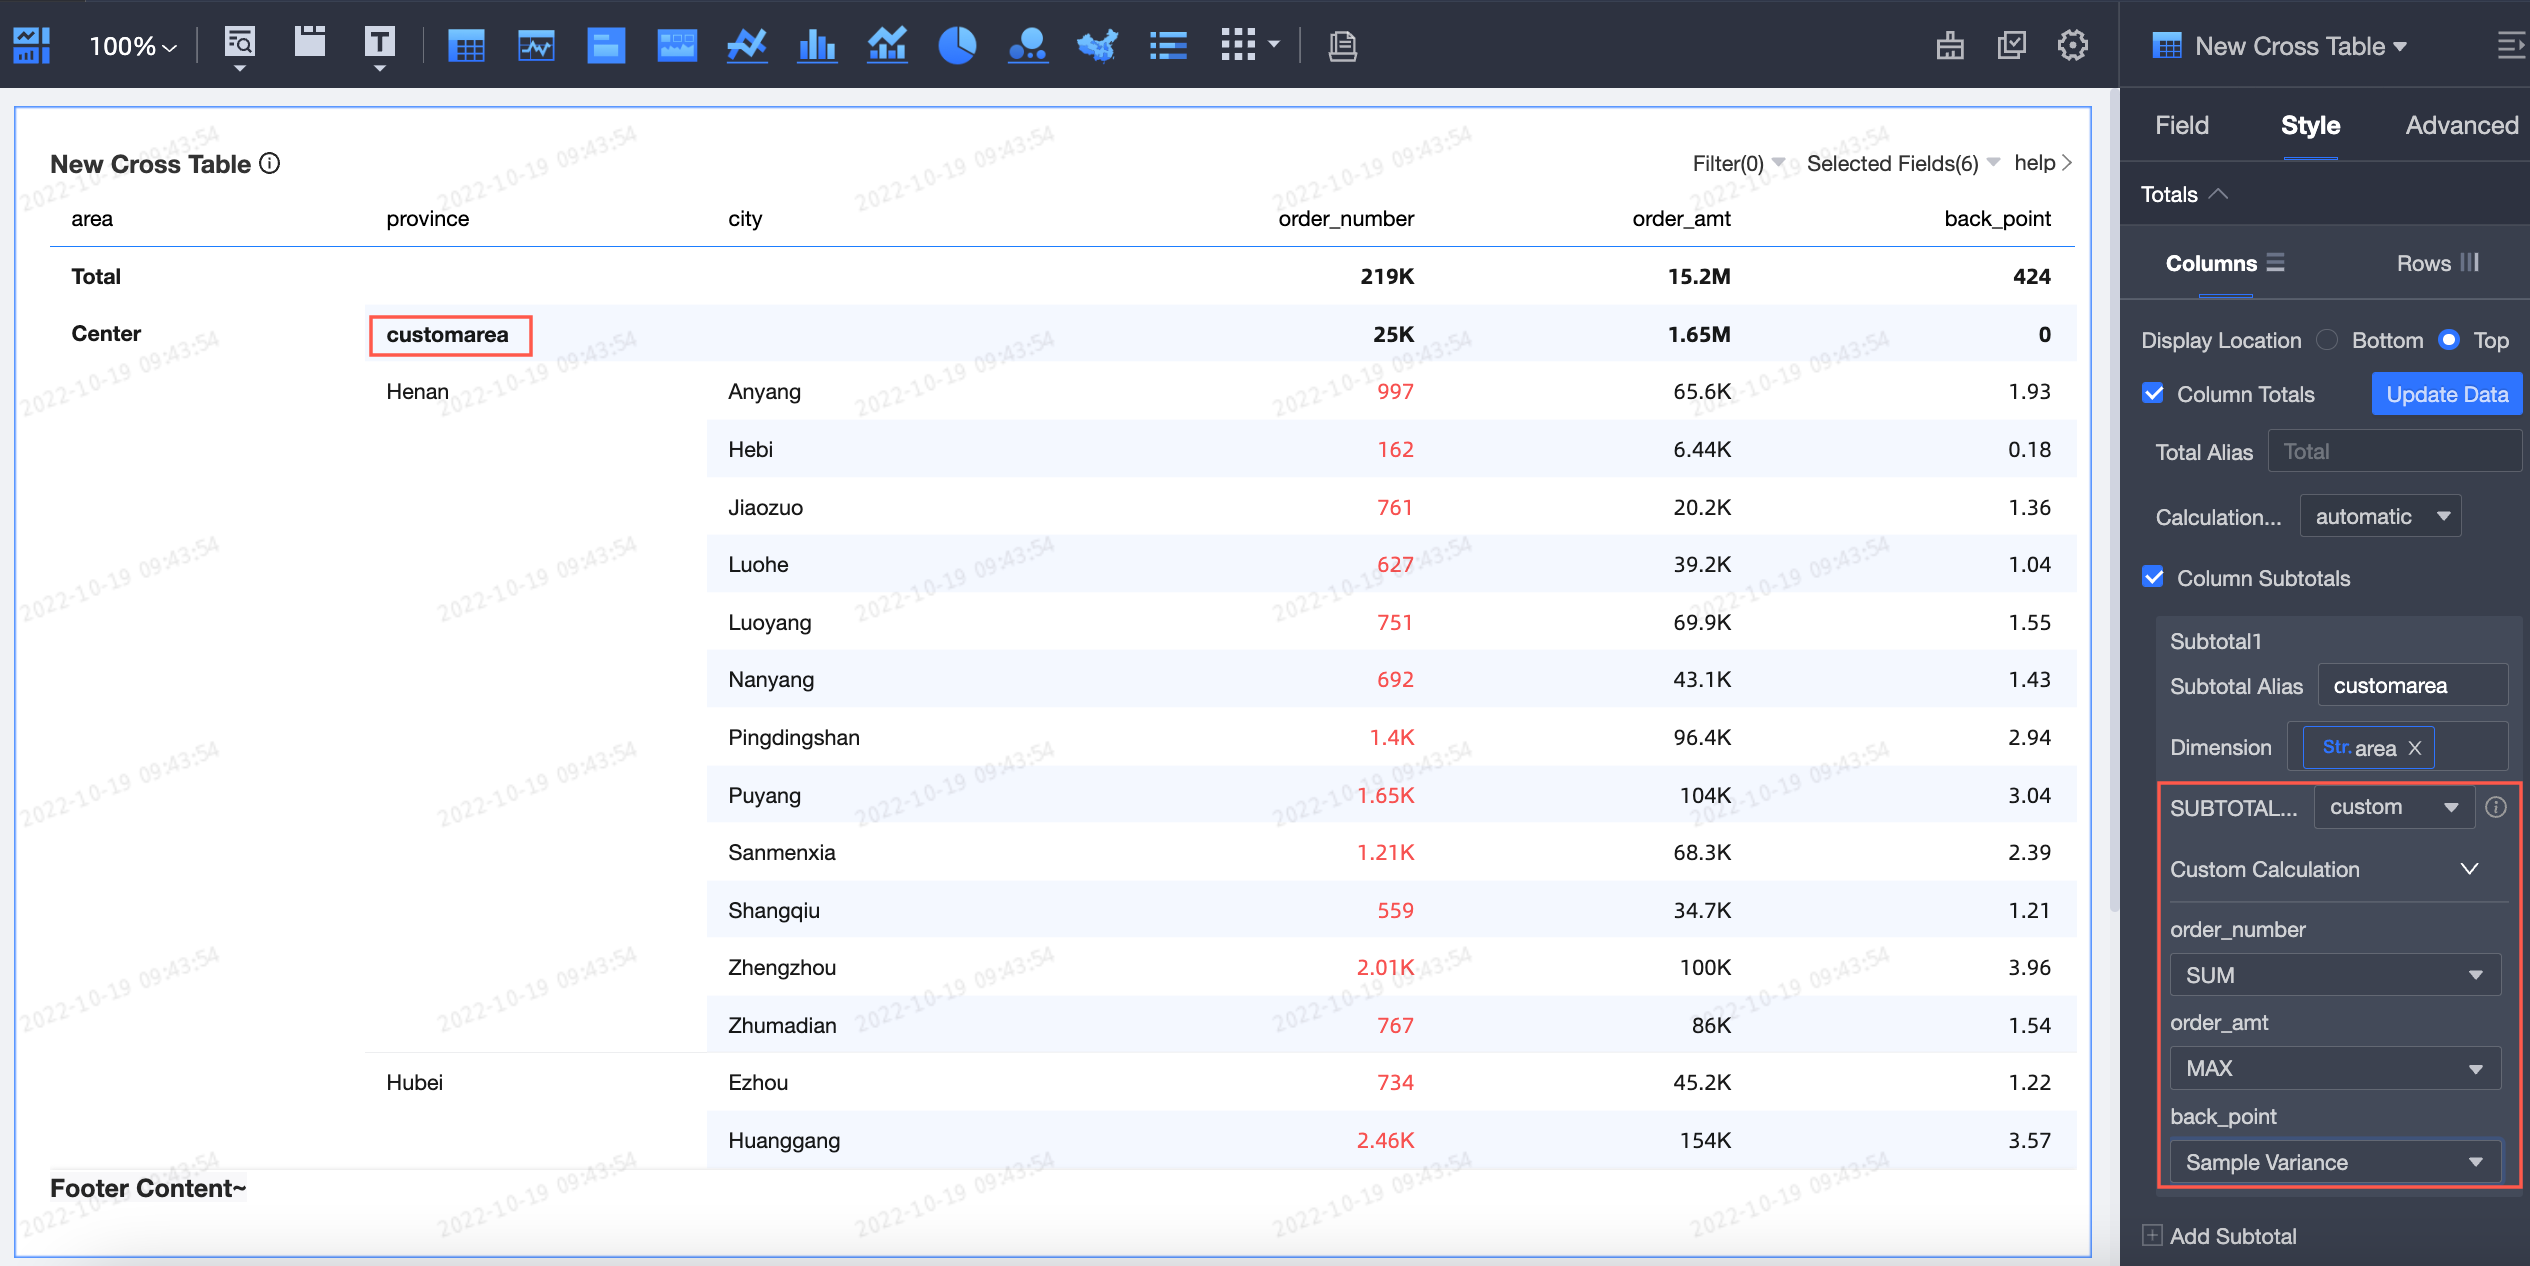
For more information, see Cross table (new version).
Filter fields can be added to filter data in a cross table of the new version.
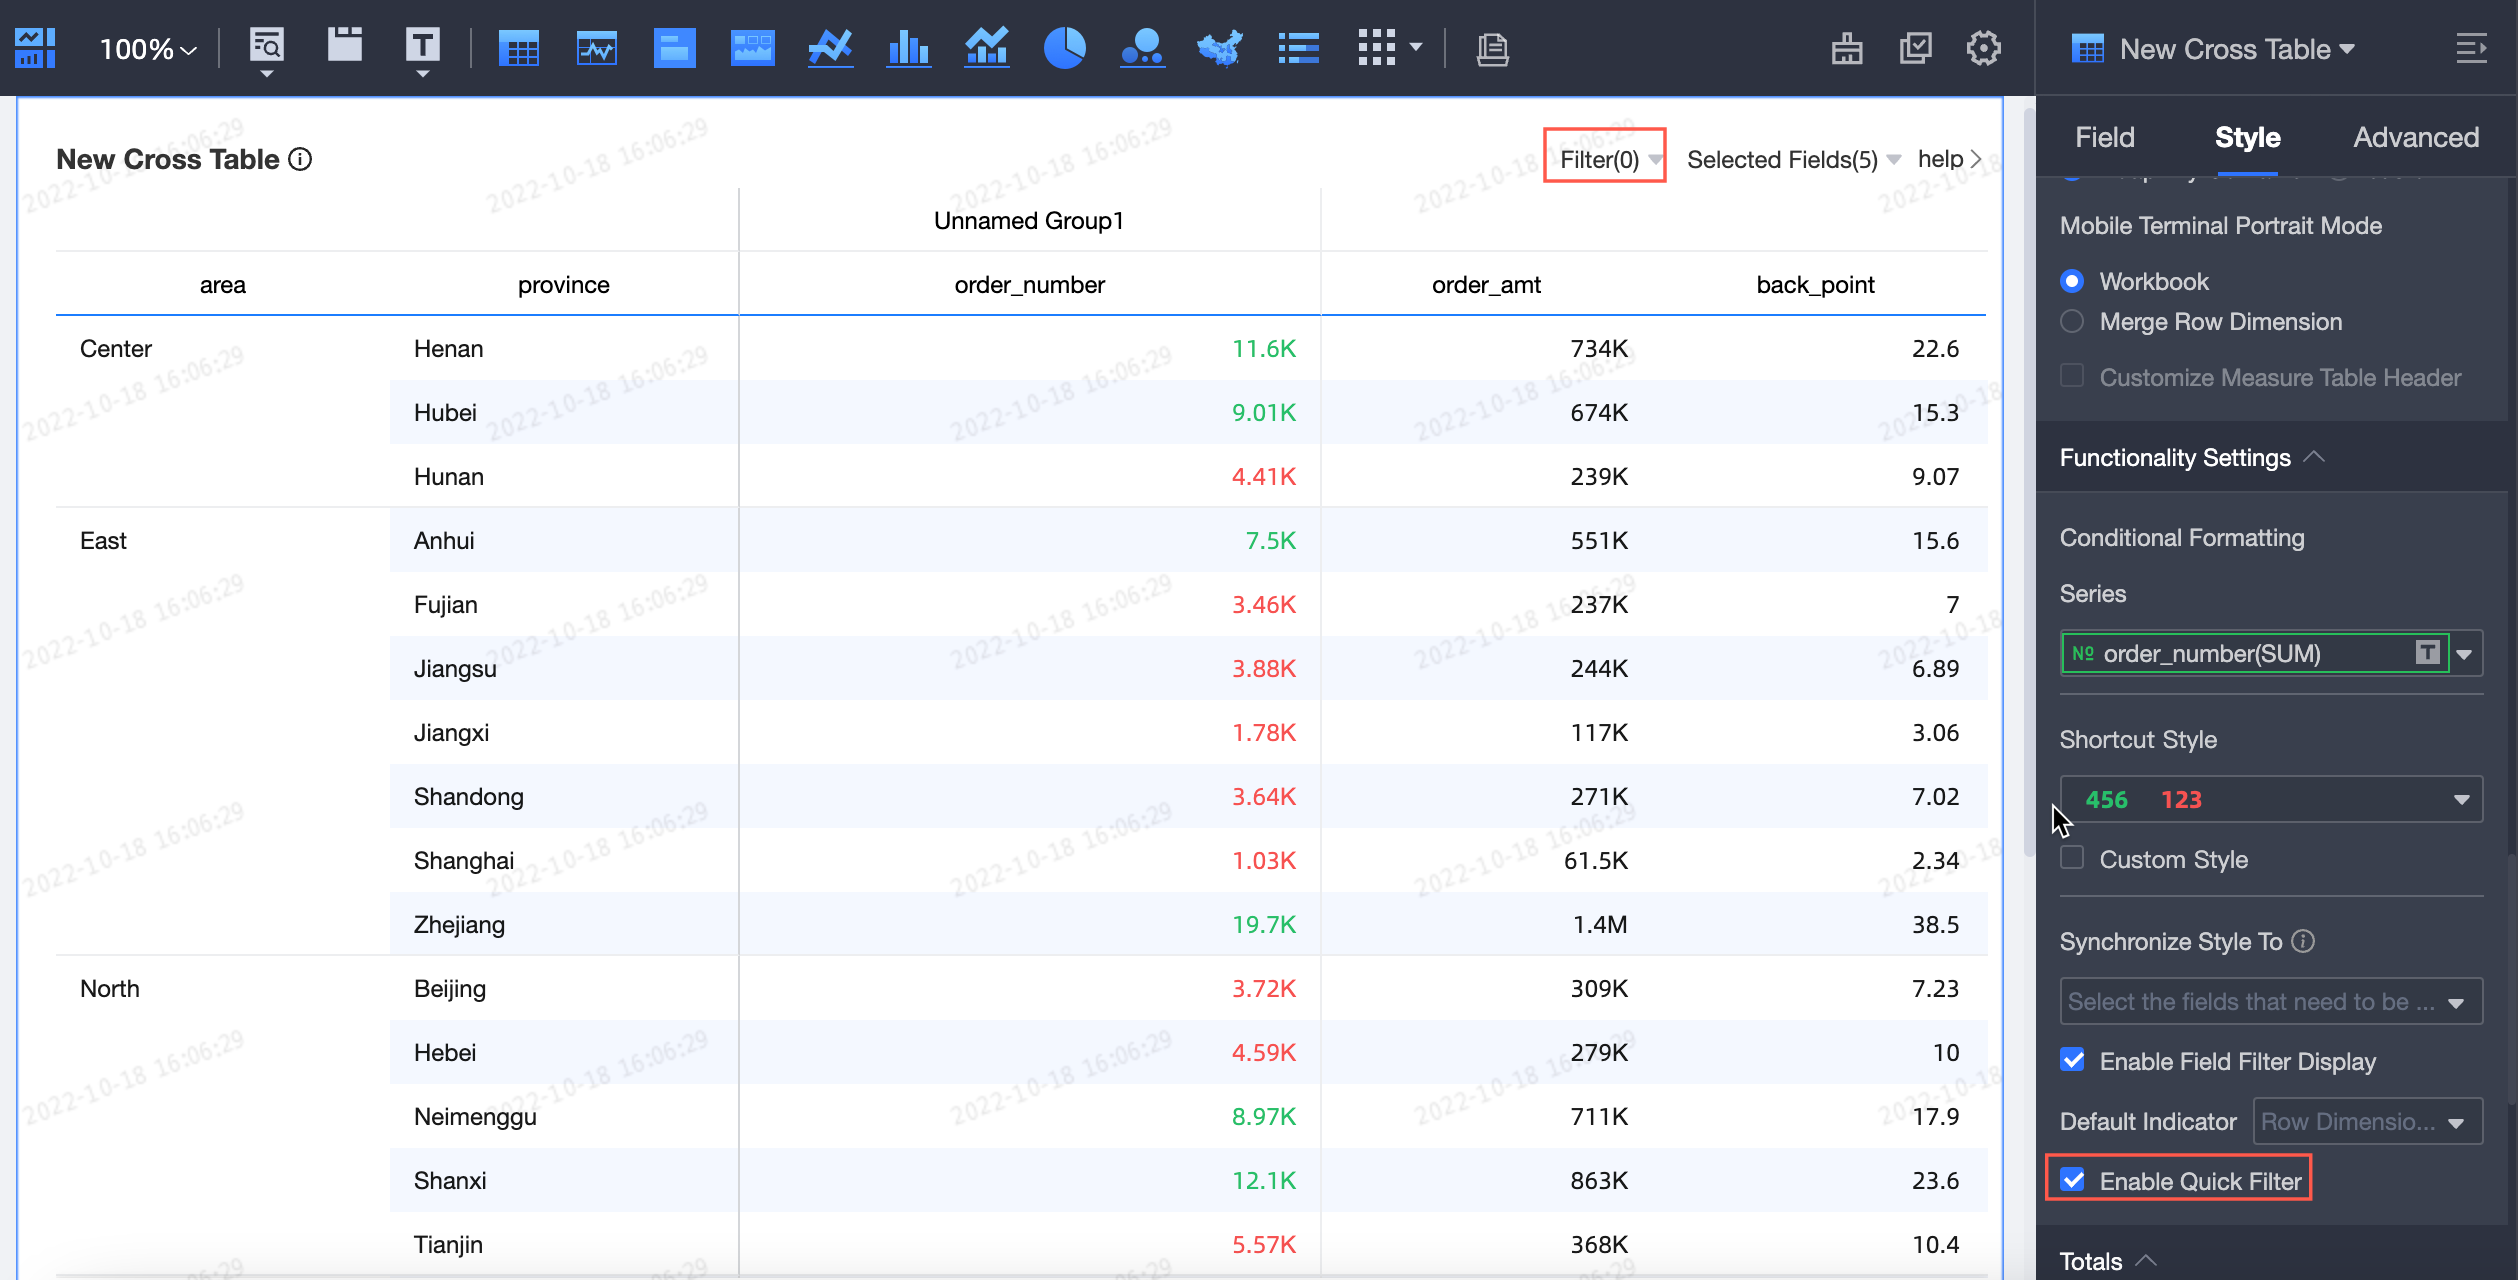
For more information, see Cross table (new version).
The metric image color on a kanban can be configured.
Multiple kanbans can be displayed side by side.
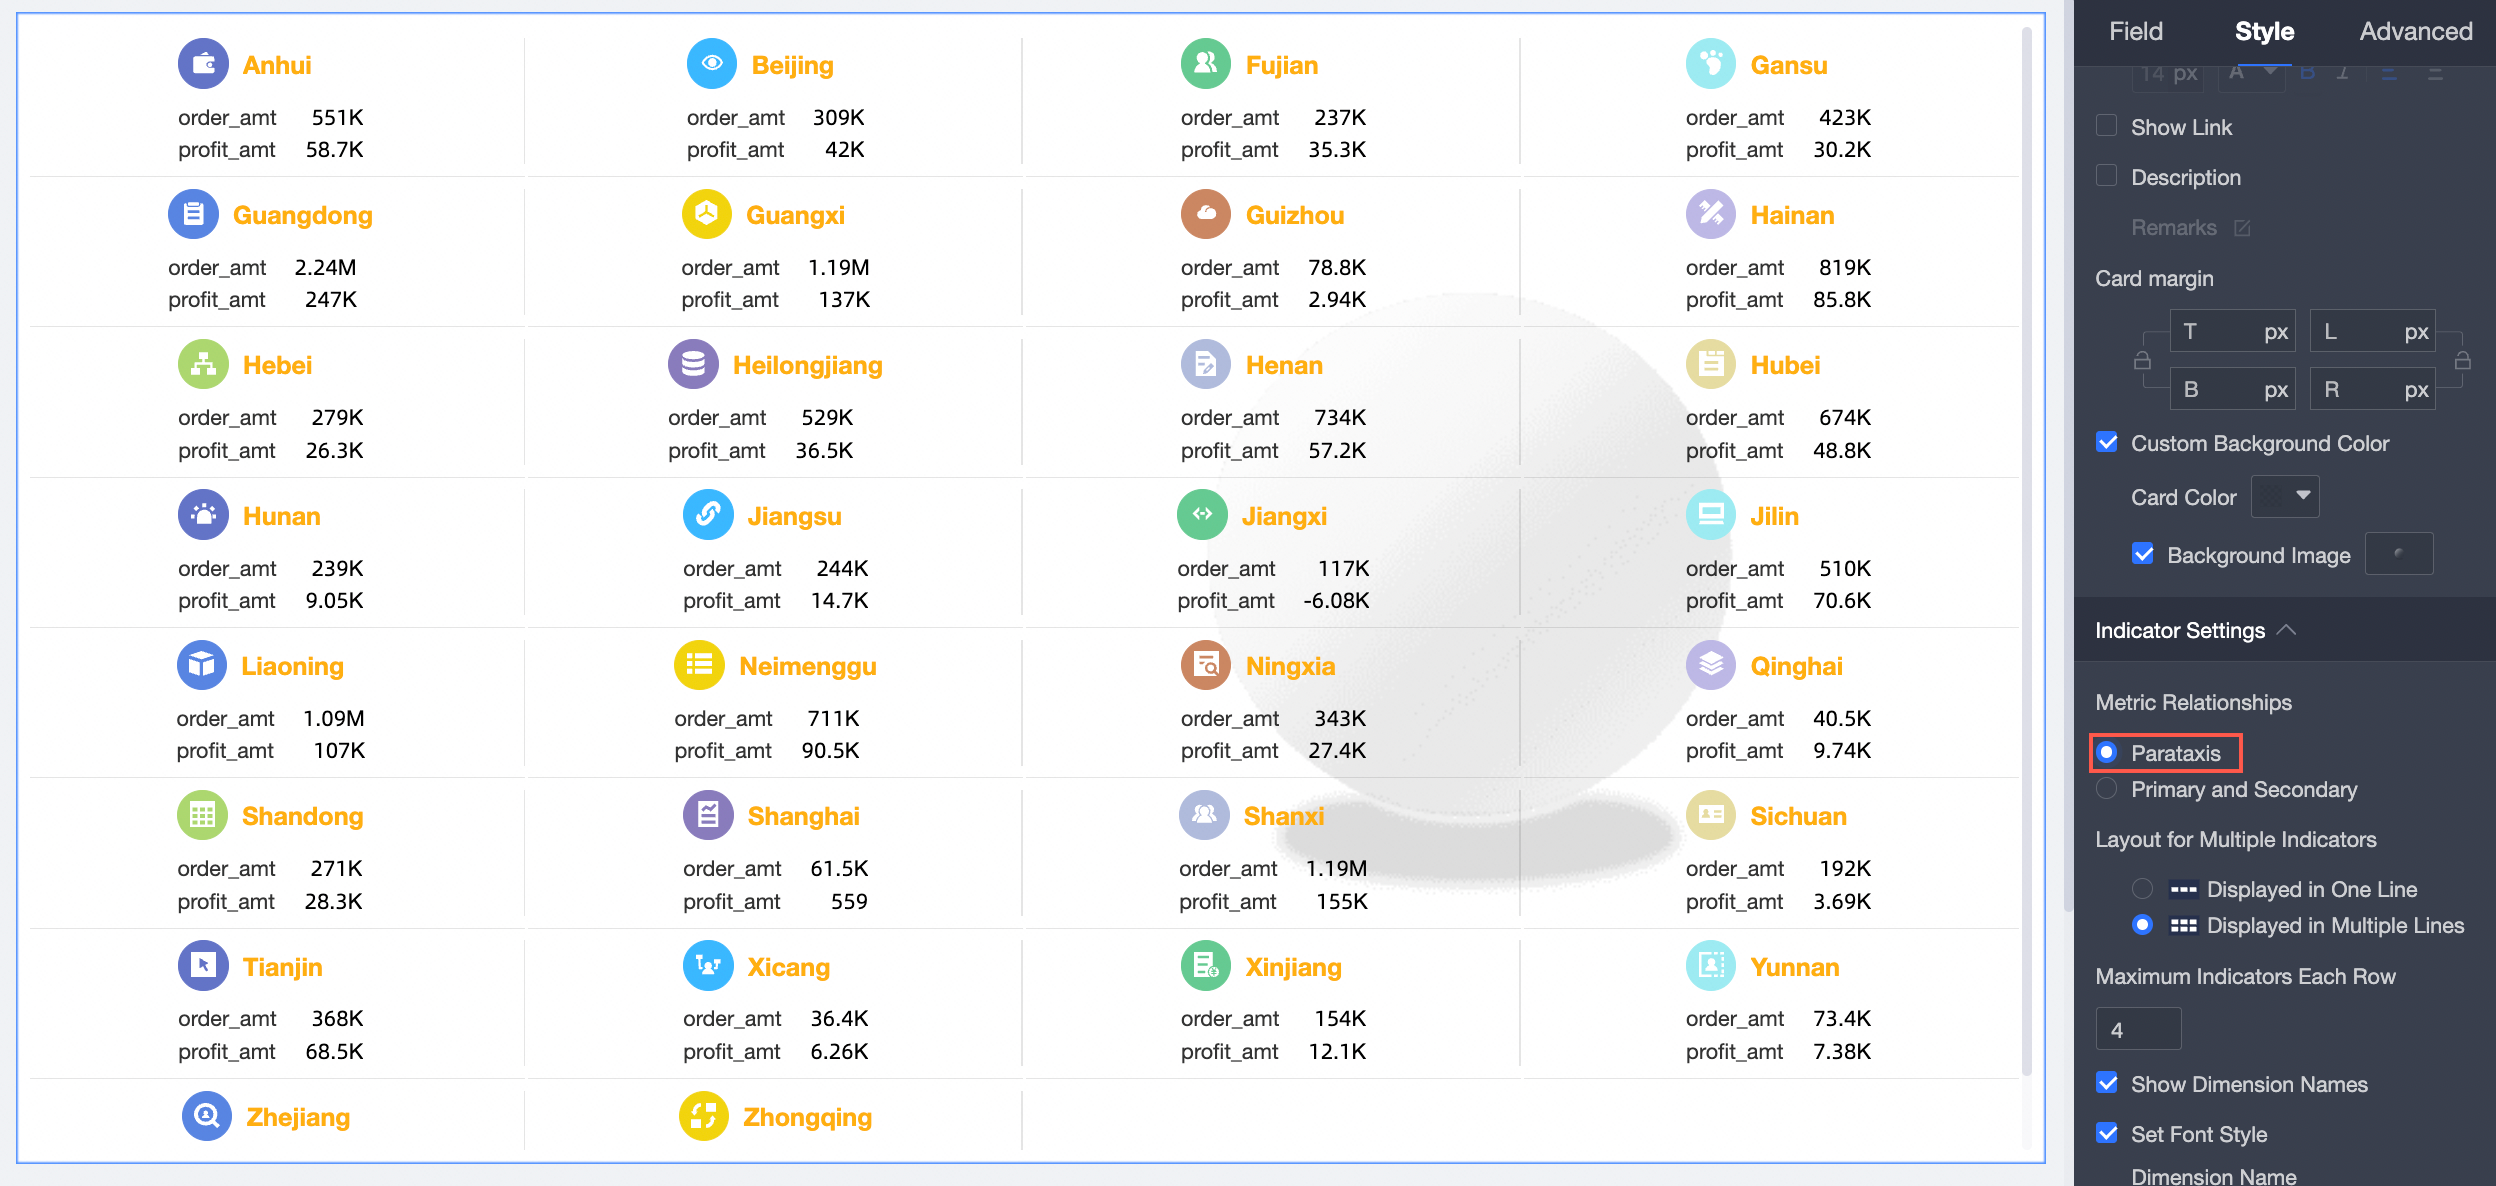
For more information, see Kanbans.
The default value of a metric in an indicator trend chart can be changed.
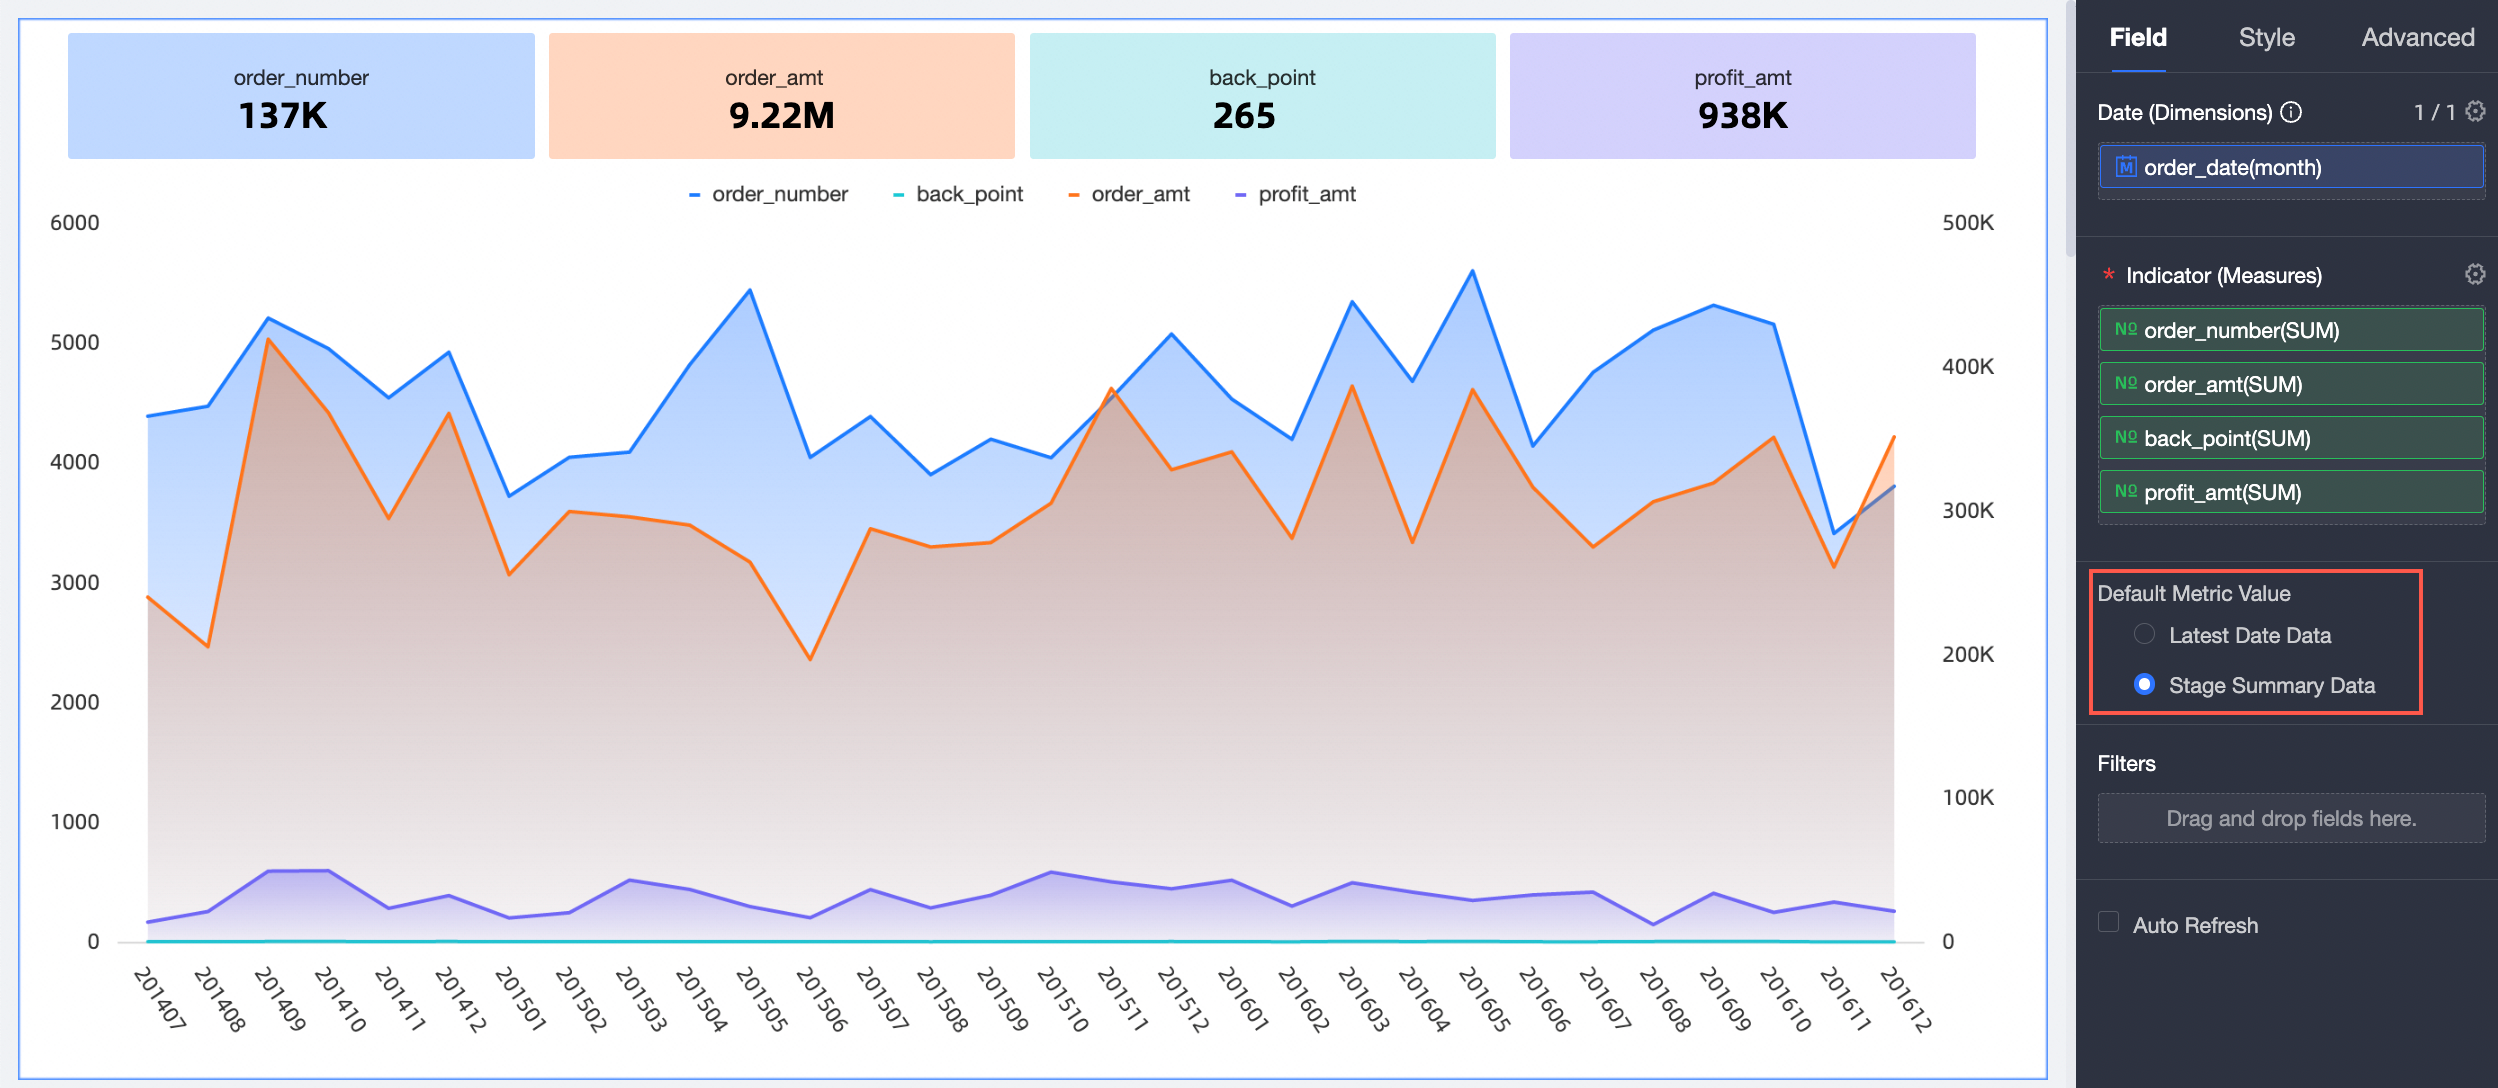
For more information, see Indicator trend chart.
The Tab inner condition follow top parameter can be selected for a tab. This way, the conditions in the tab can follow the title of the tab that remains attached in the upper part of the dashboard.
For more information, see Tab.
Navigation bars can be updated and automatically saved. Shortcut keys are provided in navigation bars.
For more information, see Create a dashboard.
Collaborative working
Enterprise portals are provided to help enterprises configure BI portals.
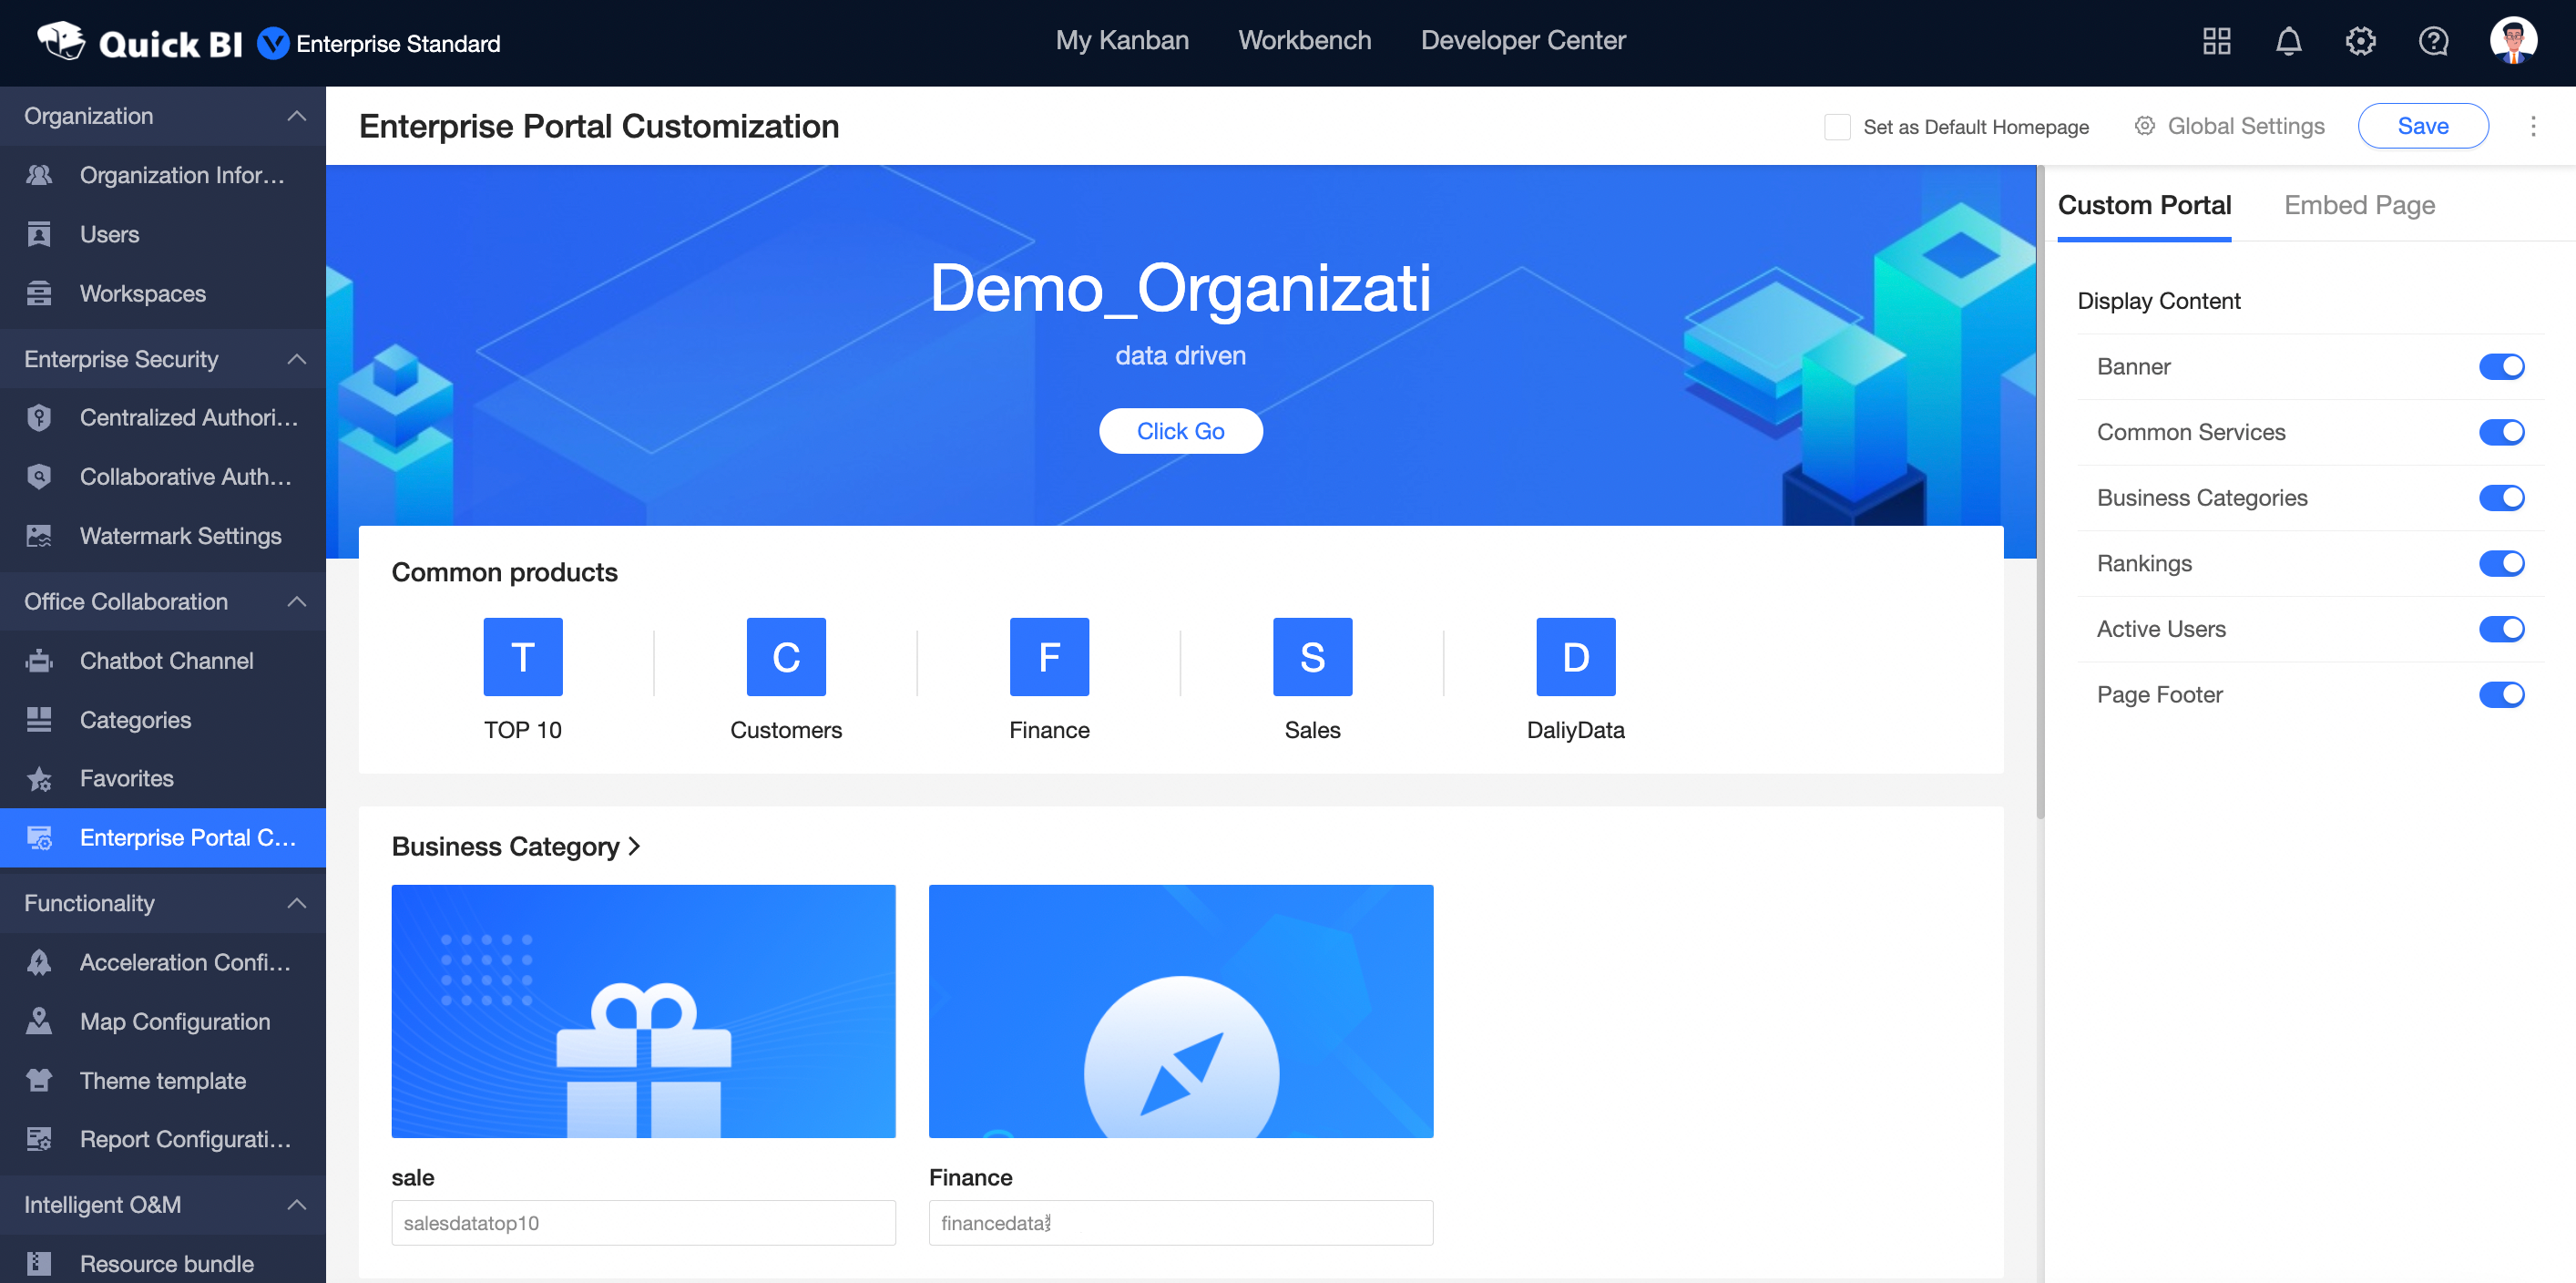
For more information, see Configure a custom enterprise portal on a PC.
Data of subscription tasks can be sent by using WeCom. The following related operations can be performed: Configure the content that needs to be sent in workbooks, select user groups as recipients, and change the owner of a subscription task.
Custom OA is supported in approval flows. Approval flows are processed by using robot channels. For more information.
Permission management
Permission management is optimized. Centralized authorization is supported to grant resource permissions to users.
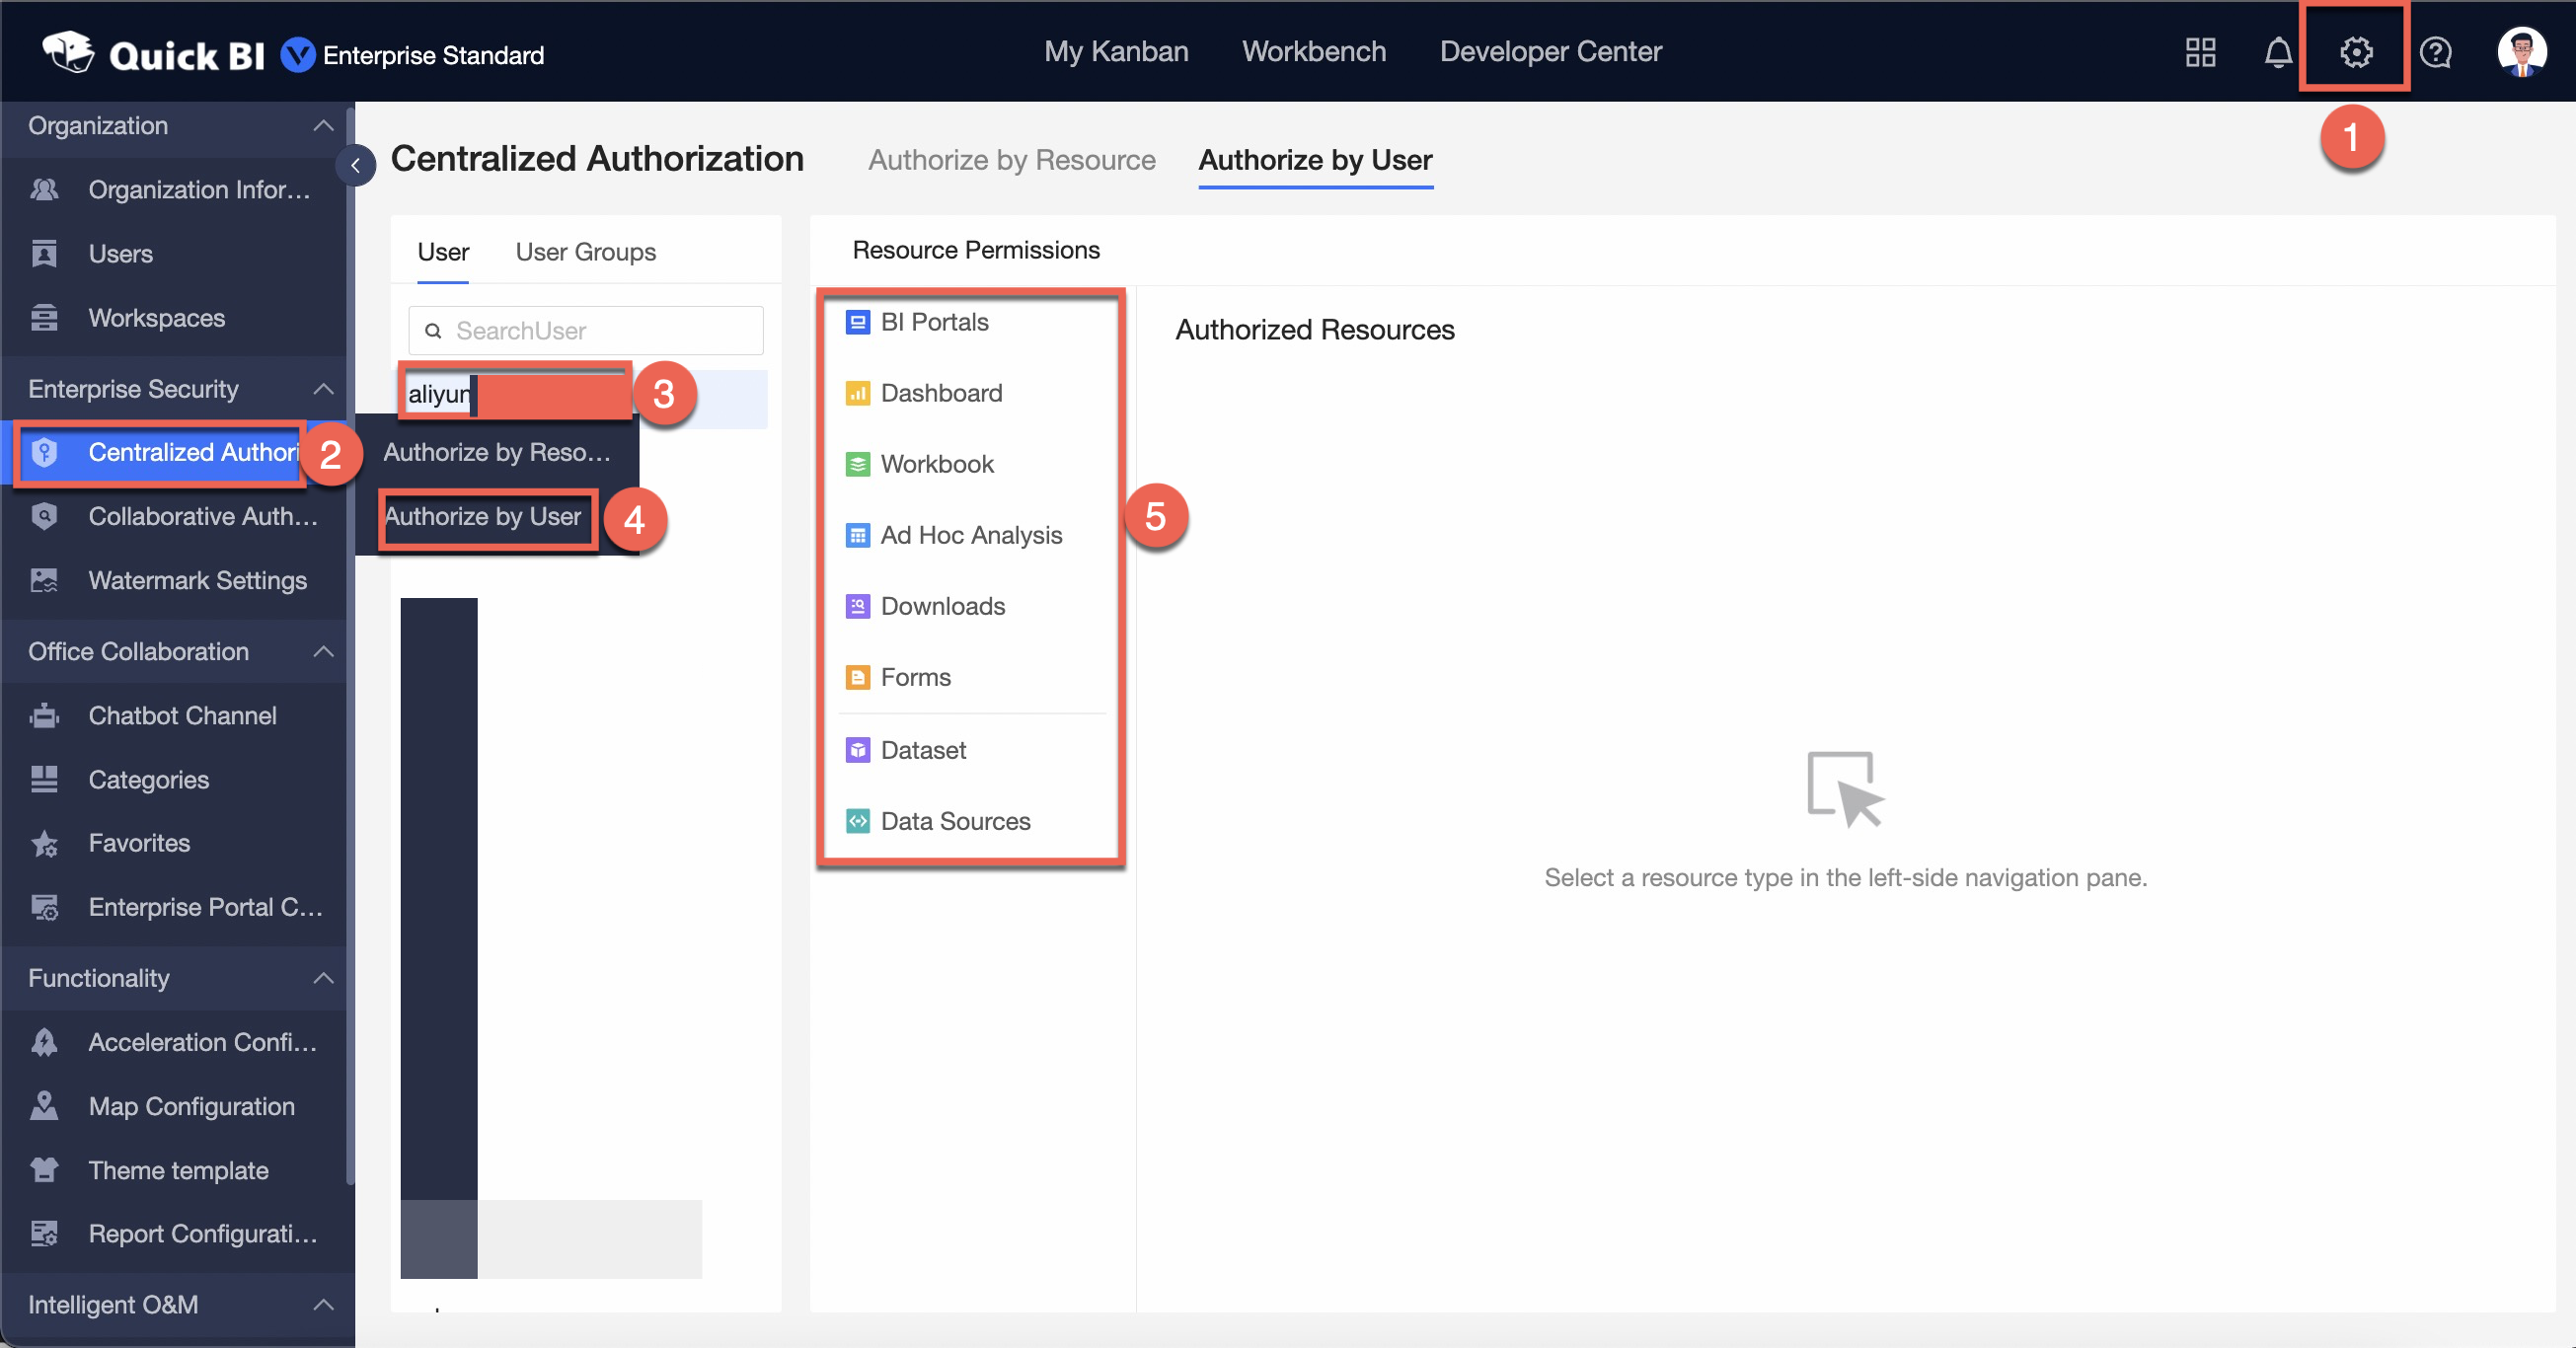
For more information, see Grant resource permissions to users.
Collaborative authorization is optimized to allow you to make data works public and grant permissions on data works to users at the organization level.
Column-level permissions can be enabled and collaborative authorization can be configured.
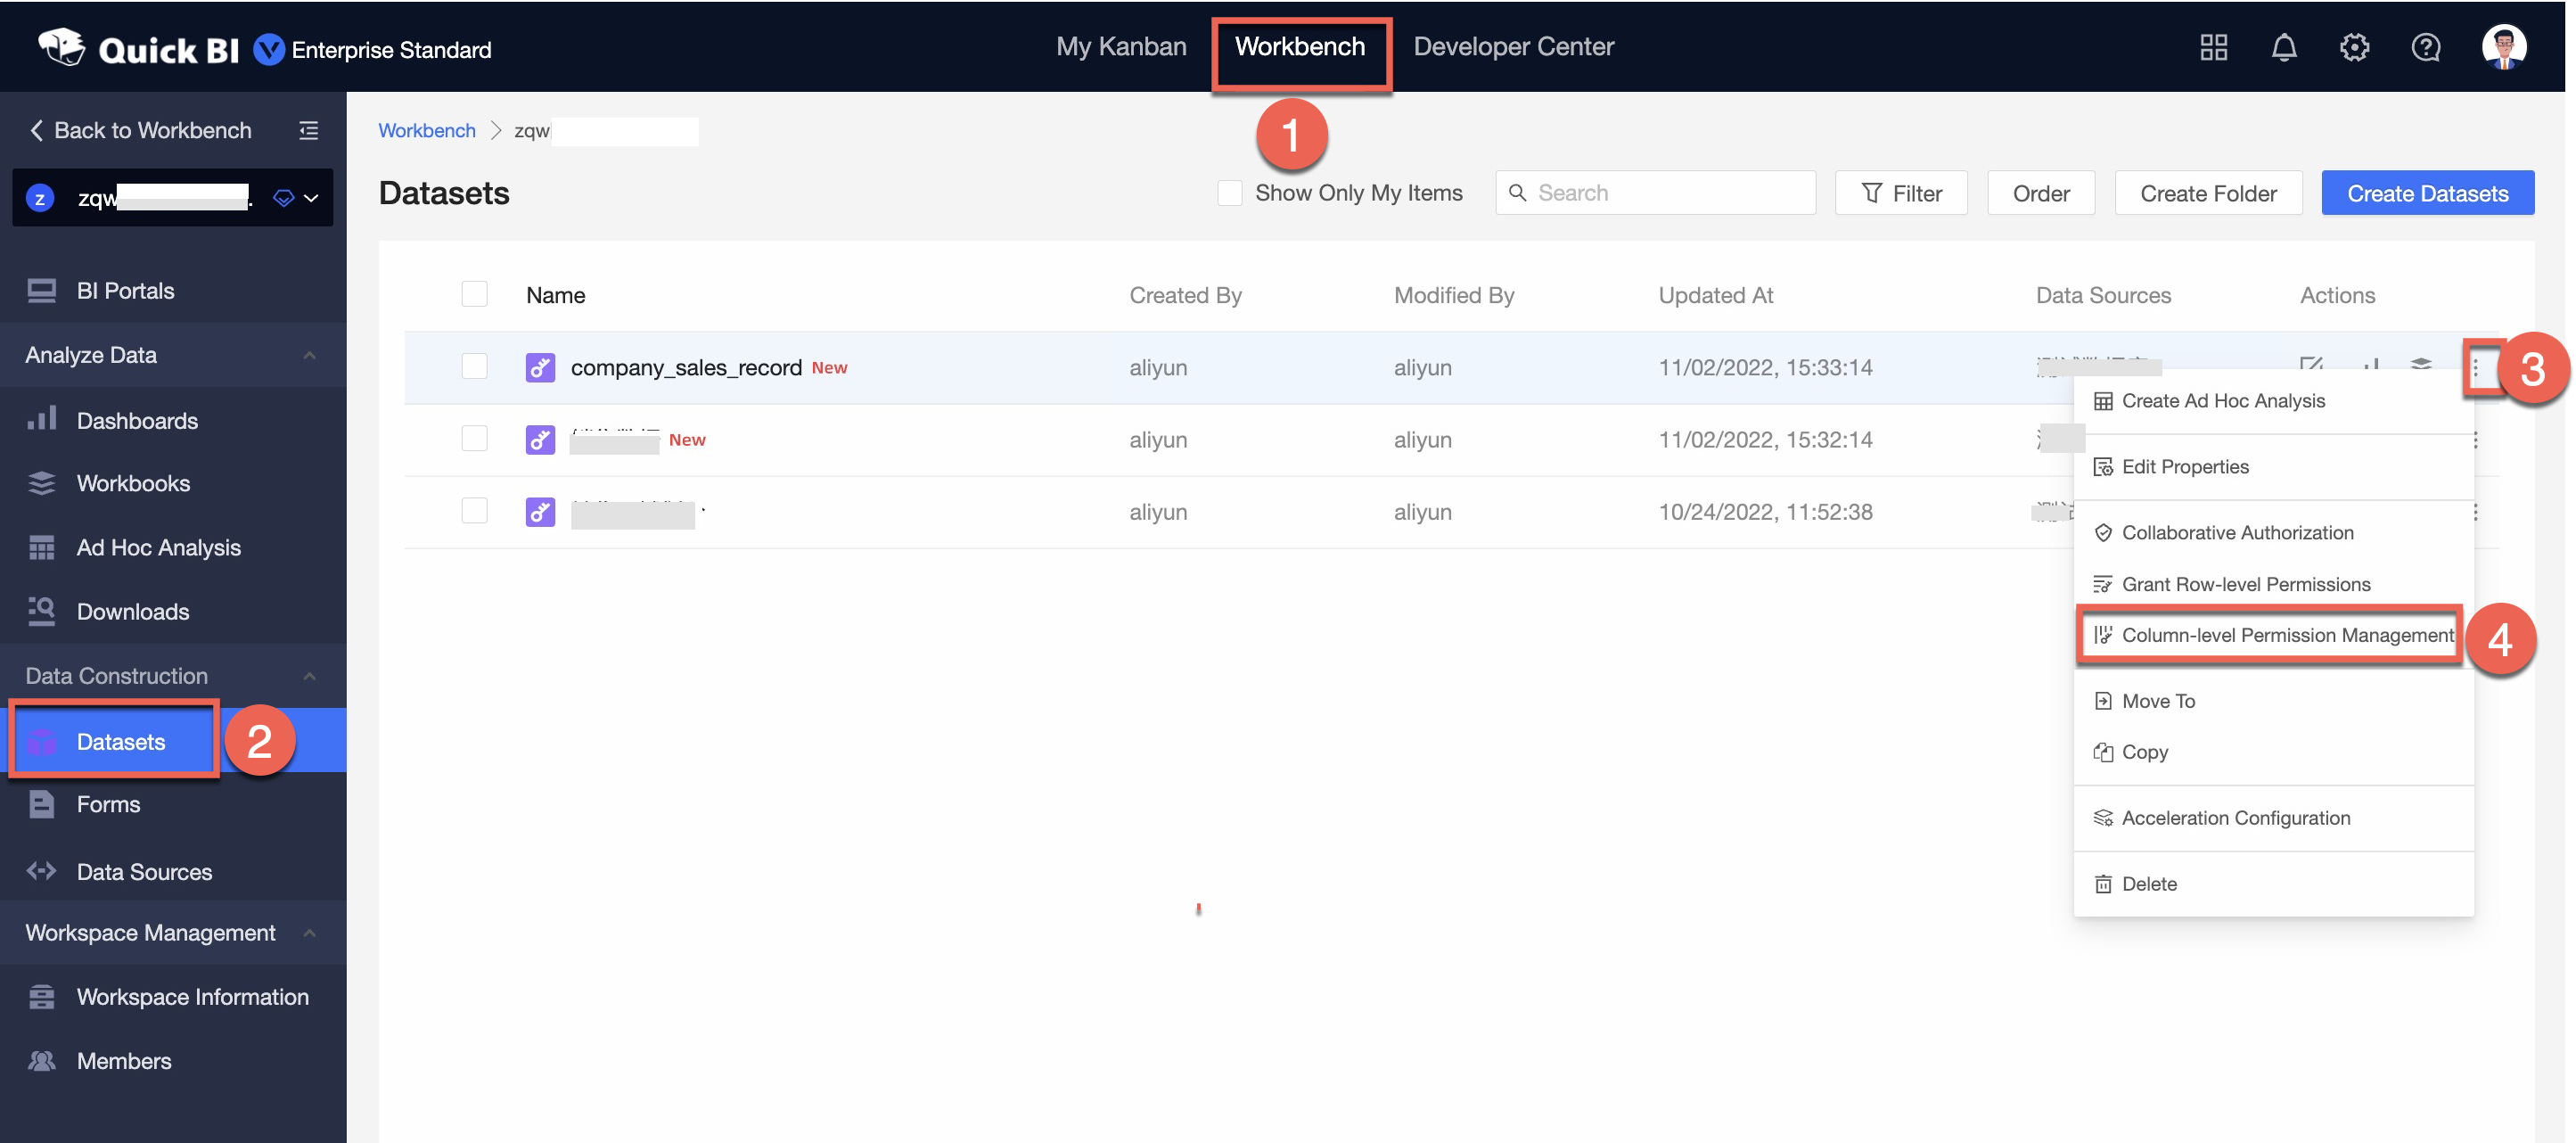
For more information, see Column-level permissions.