A kanban displays informational data such as sales performance. This gives you a quick overview of your business. Kanbans can be used to monitor the health of your business in real time and identify issues in your business processes. Therefore, a kanban is one of the effective ways to detect and resolve issues. This topic describes how to configure a kanban, including the data to be displayed on the kanban and the style of the kanban.
Prerequisites
A dashboard is created. For more information, see Create a dashboard.
Overview
Scenarios
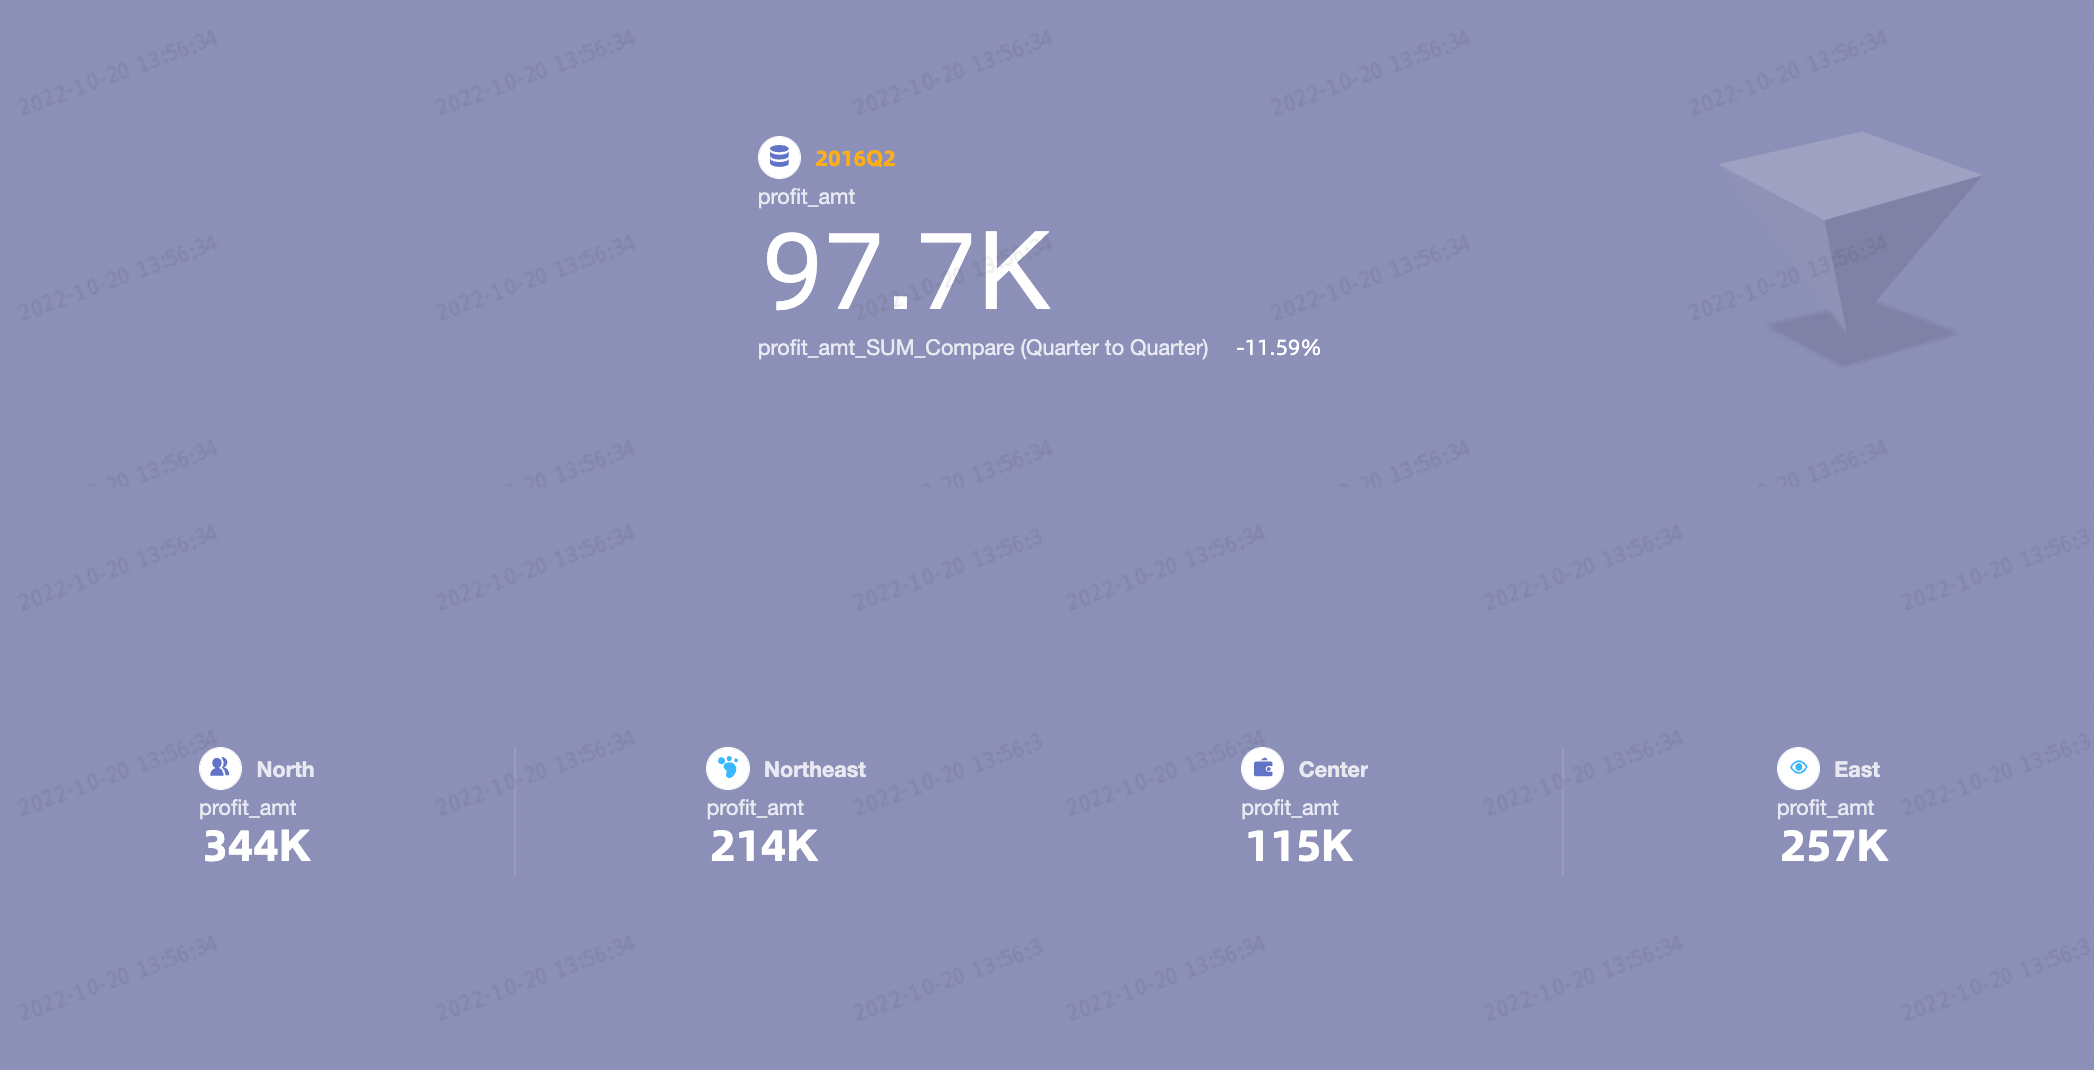
A kanban is used to display one or more measures in a dimension, especially in scenarios in which accurate numbers need to be displayed for metrics.
Benefits
Computing capabilities: You can configure the comparison and advanced calculation features with a few clicks.
Visualization: You can add icons and logos to kanbans, use custom backgrounds, and adjust styles such as the font size and color.
Various interactive options: You can add custom remarks or comments to kanbans. You can also add links to kanbans to interact with external systems.
Example
Configure a kanban
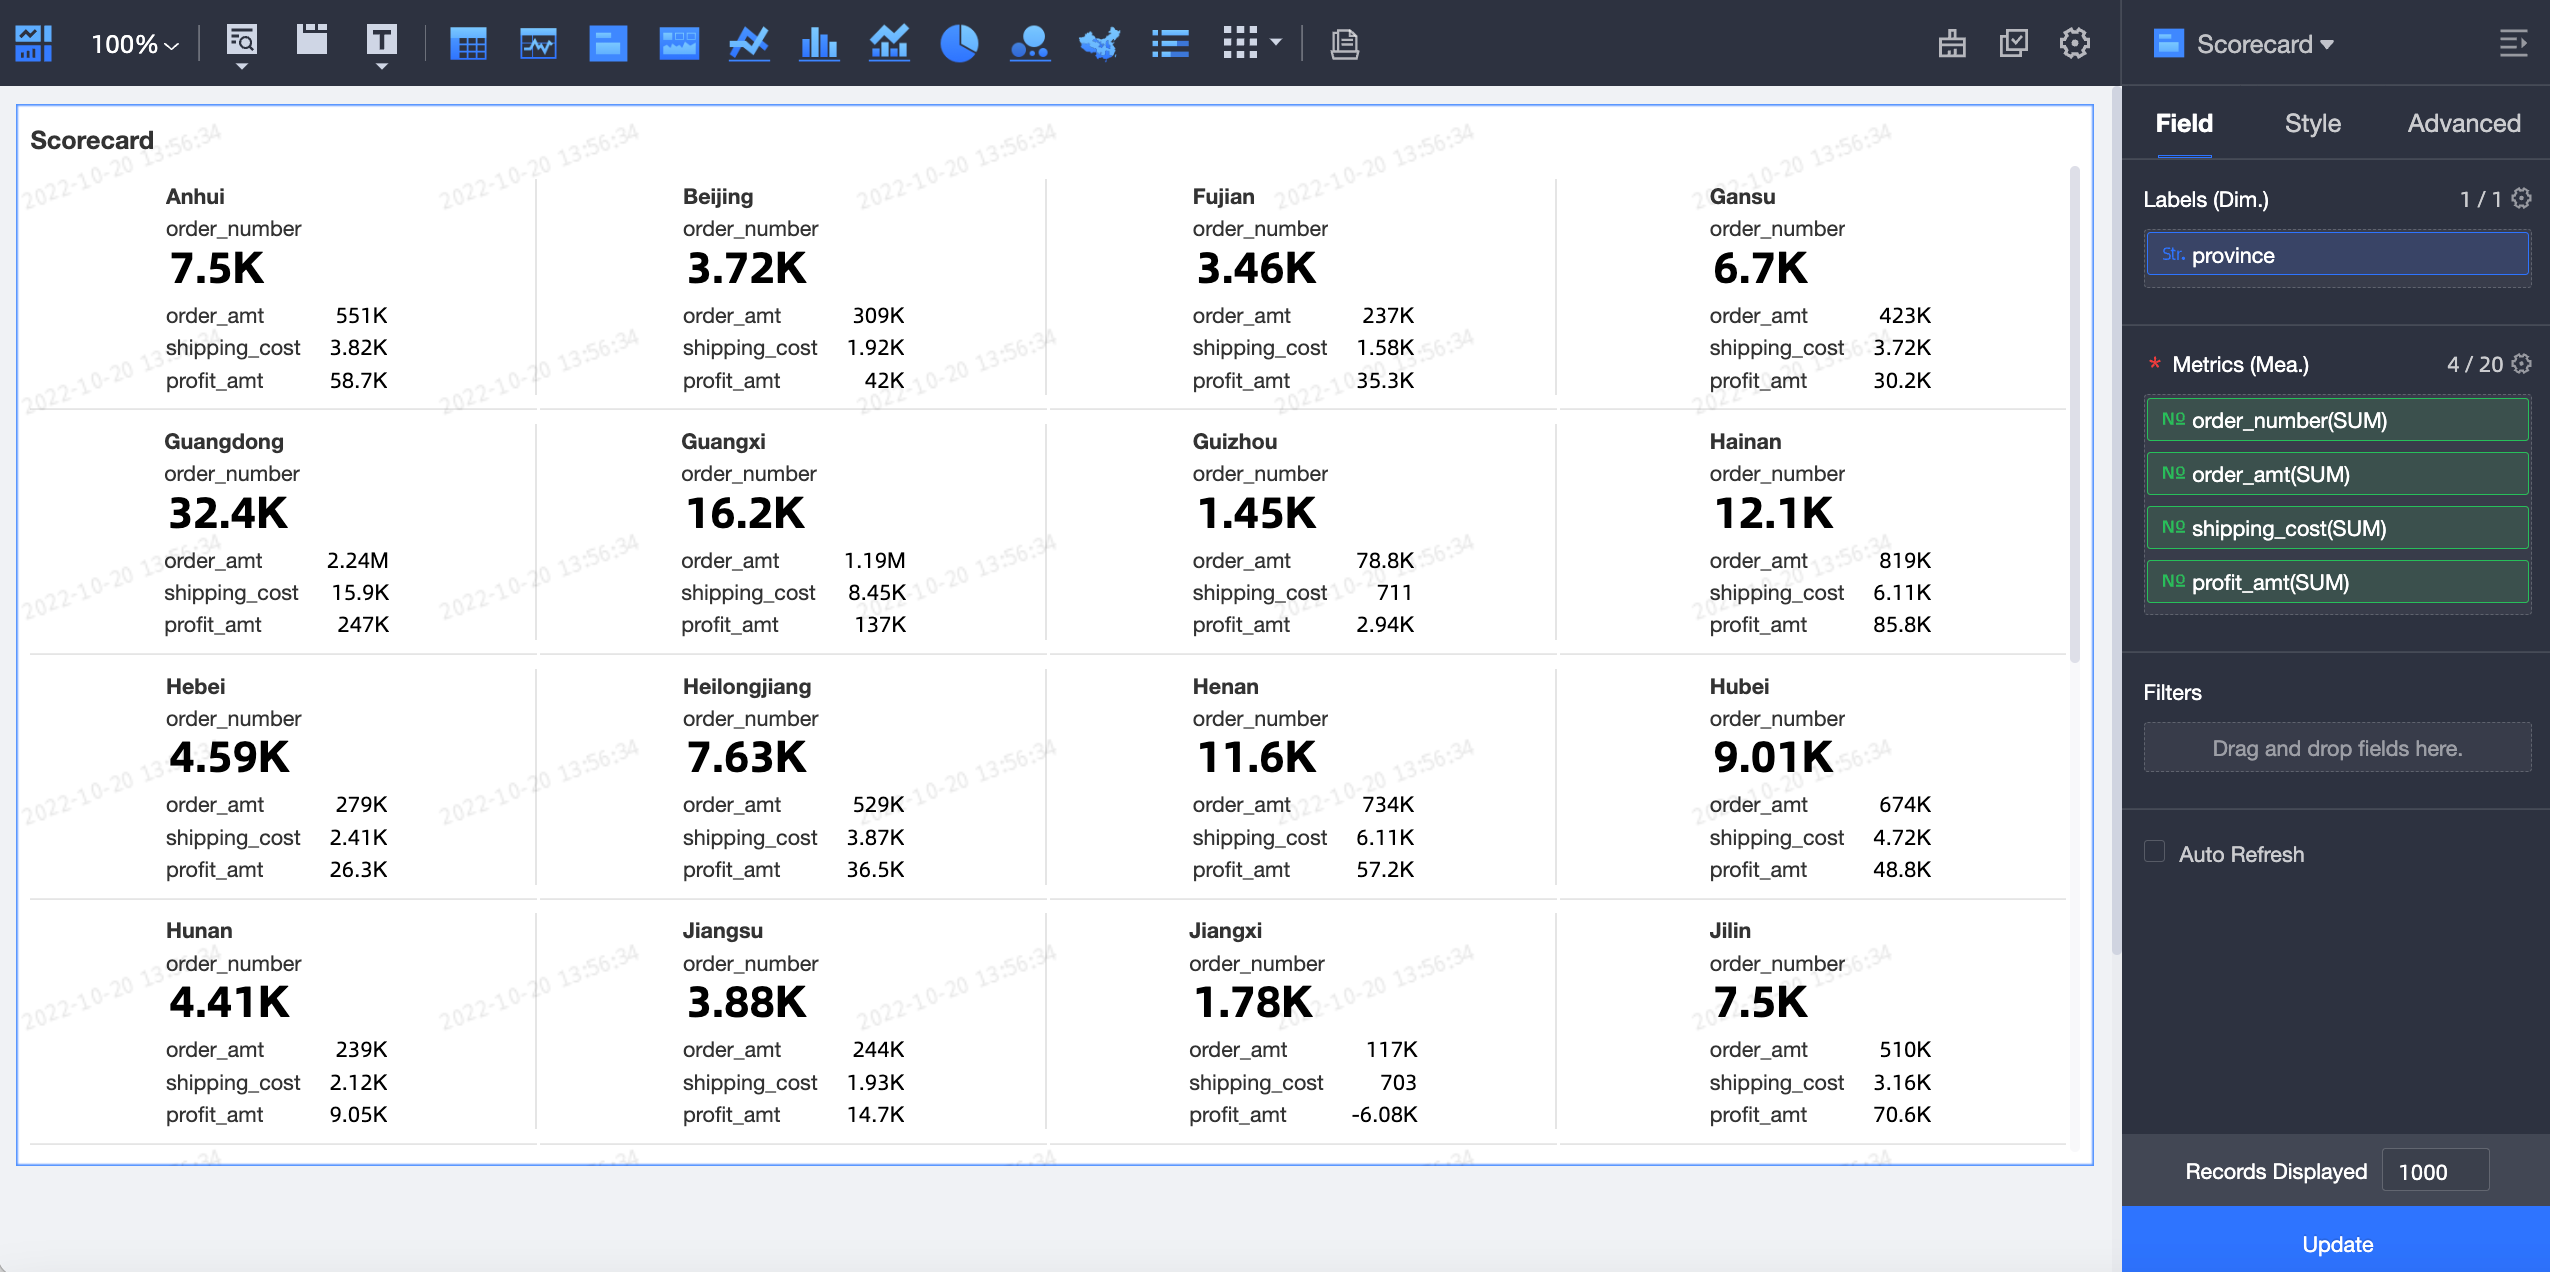
On the Field tab, select a dimension and one or more measures based on your requirements.
In the Dimension list, double-click a dimension or drag this dimension to the Labels (Dim.) section.
In the measure list, double-click a measure or drag the measure to the Metrics (Mea.) section. Add more measures in the same way based on your business requirements.
NoteIn the Metrics (Mea.) section, the first measure is the primary measure. You can rearrange the measures in the Metrics (Mea.) section to change the primary measure.
Click Update to update the kanban.
Configure the style of a kanban
This section describes how to configure the style of a kanban. For more information about how to configure common chart styles, see Configure the chart title.
In the Indicator Settings section, configure the style of metric blocks.
Parameter
Description
Metric Relationships
Options: Parataxis and Primary and Secondary.

Layout for Multiple Indicators

Maximum Indicators Each Row
Specify the number of metric blocks to display in each row on the kanban.
Show Dimension Names
Specify whether to display the name of the dimension on the kanban.
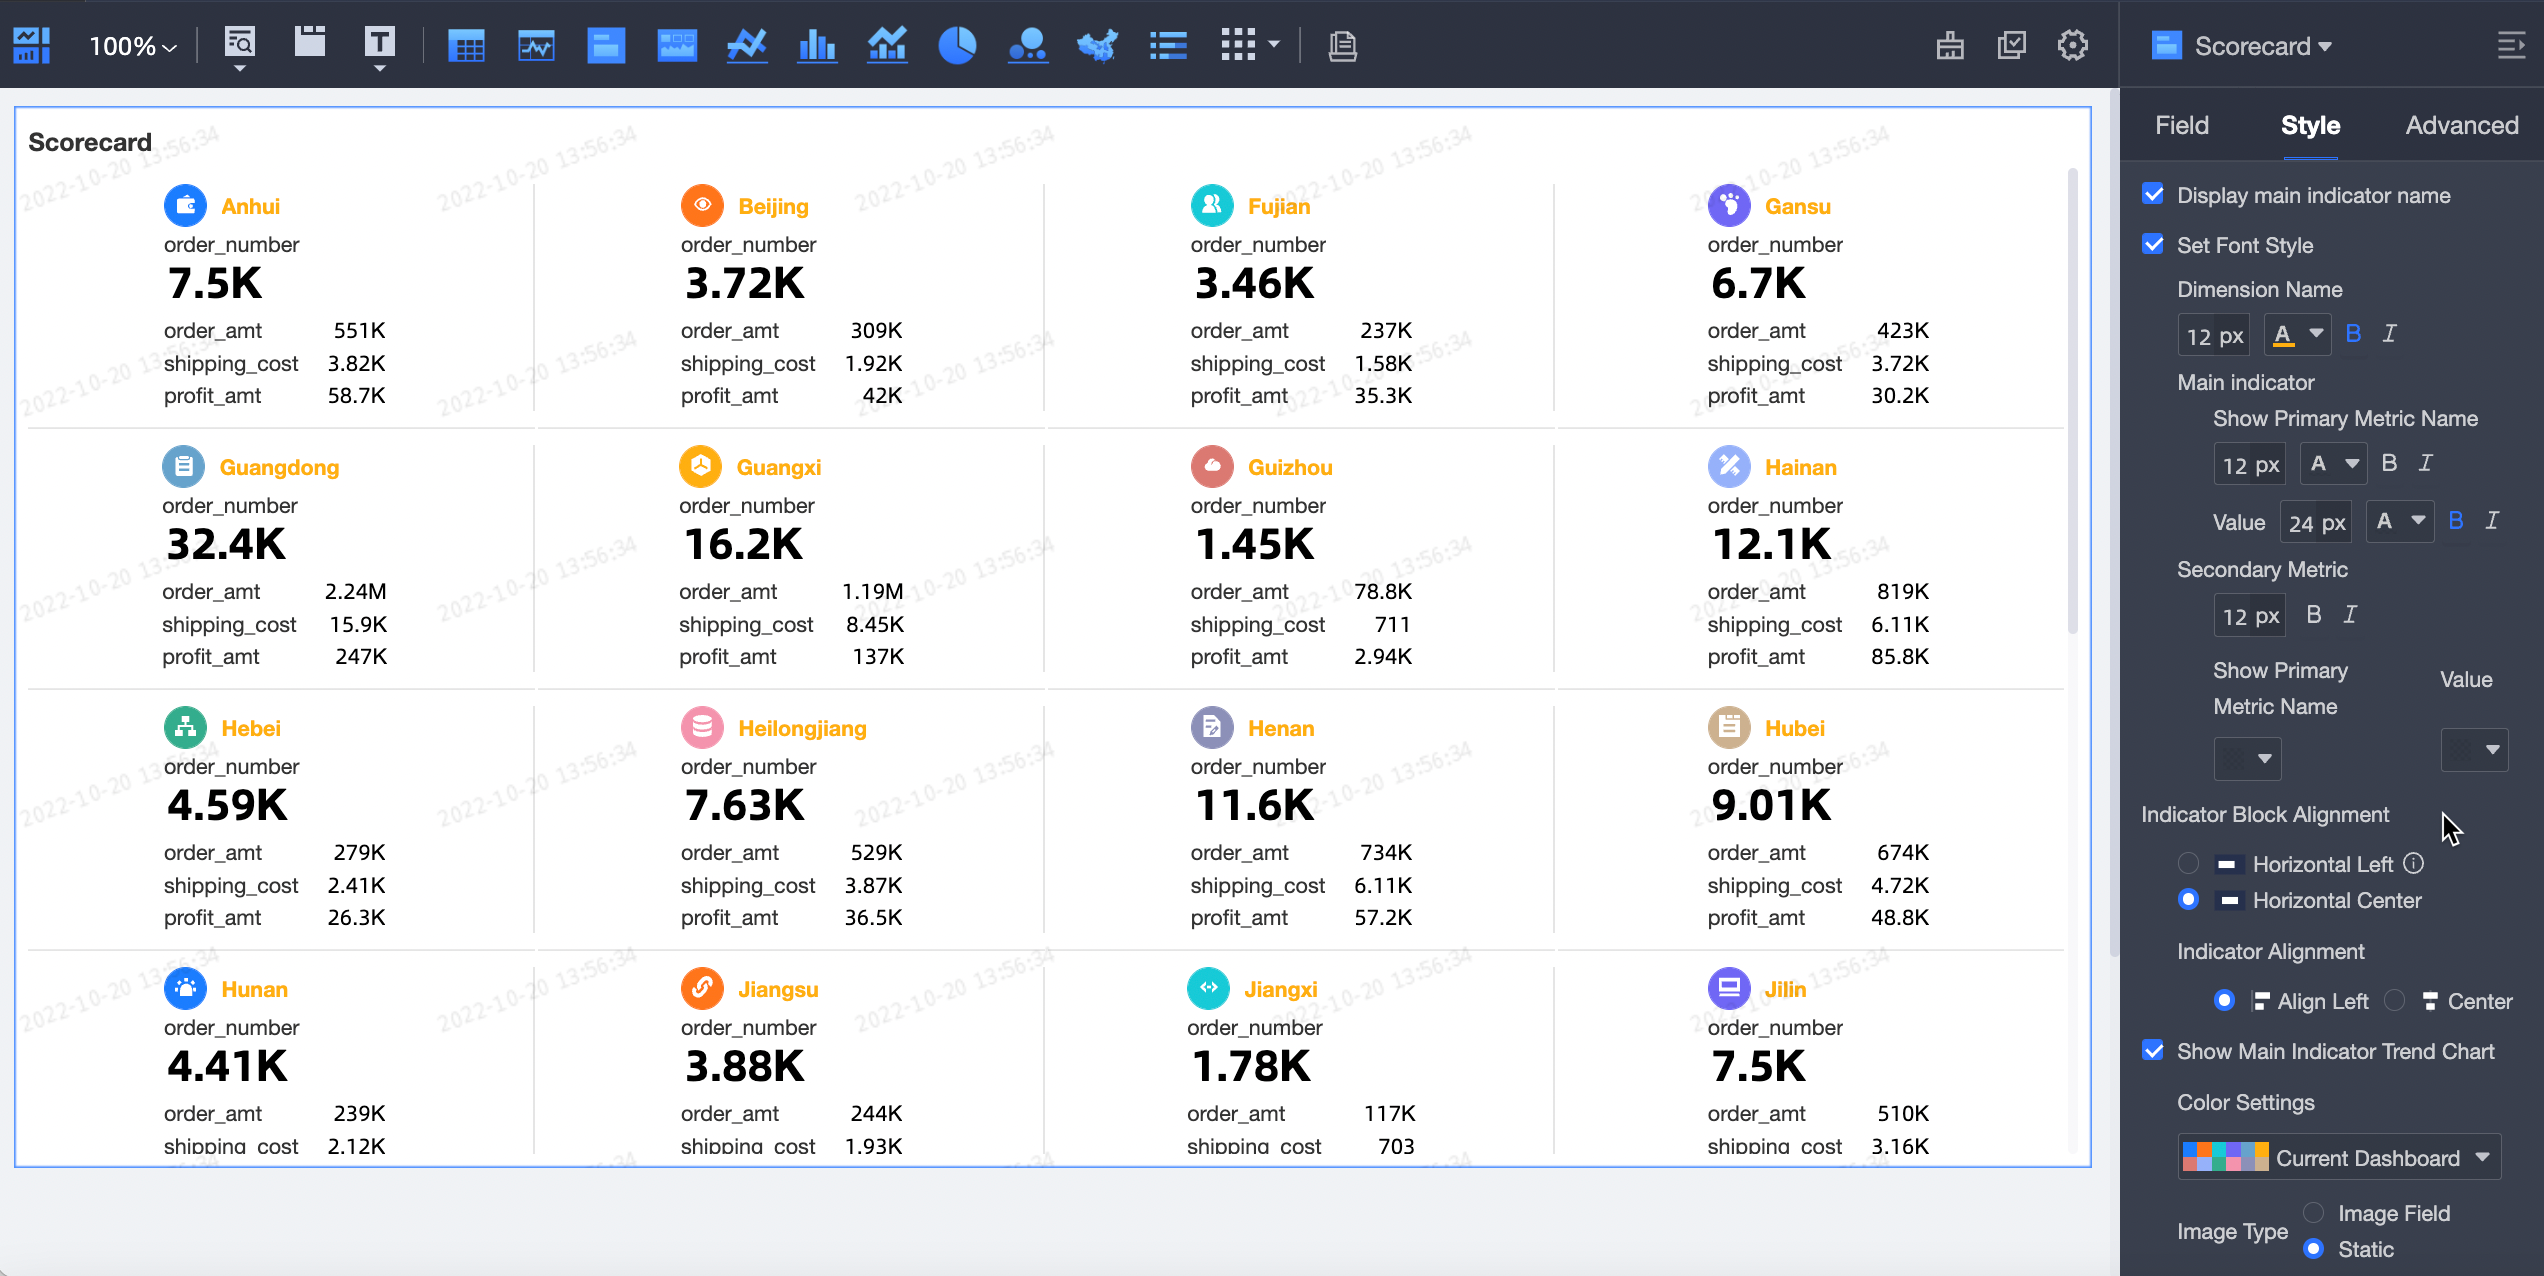
Display main indicator name
Specify whether to display the name of the primary measure on the kanban.
Set Font Style
Set the font sizes and colors for the dimension name and the names and values of the primary and secondary measures.
NoteIn the Metrics (Mea.) section, the first measure is the primary measure. The rest measures are secondary measures.
Indicator Block Alignment
Specify the alignment of a metric block.
Indicator Alignment
Options: Align Left and Center.
Show Main Indicator Trend Chart
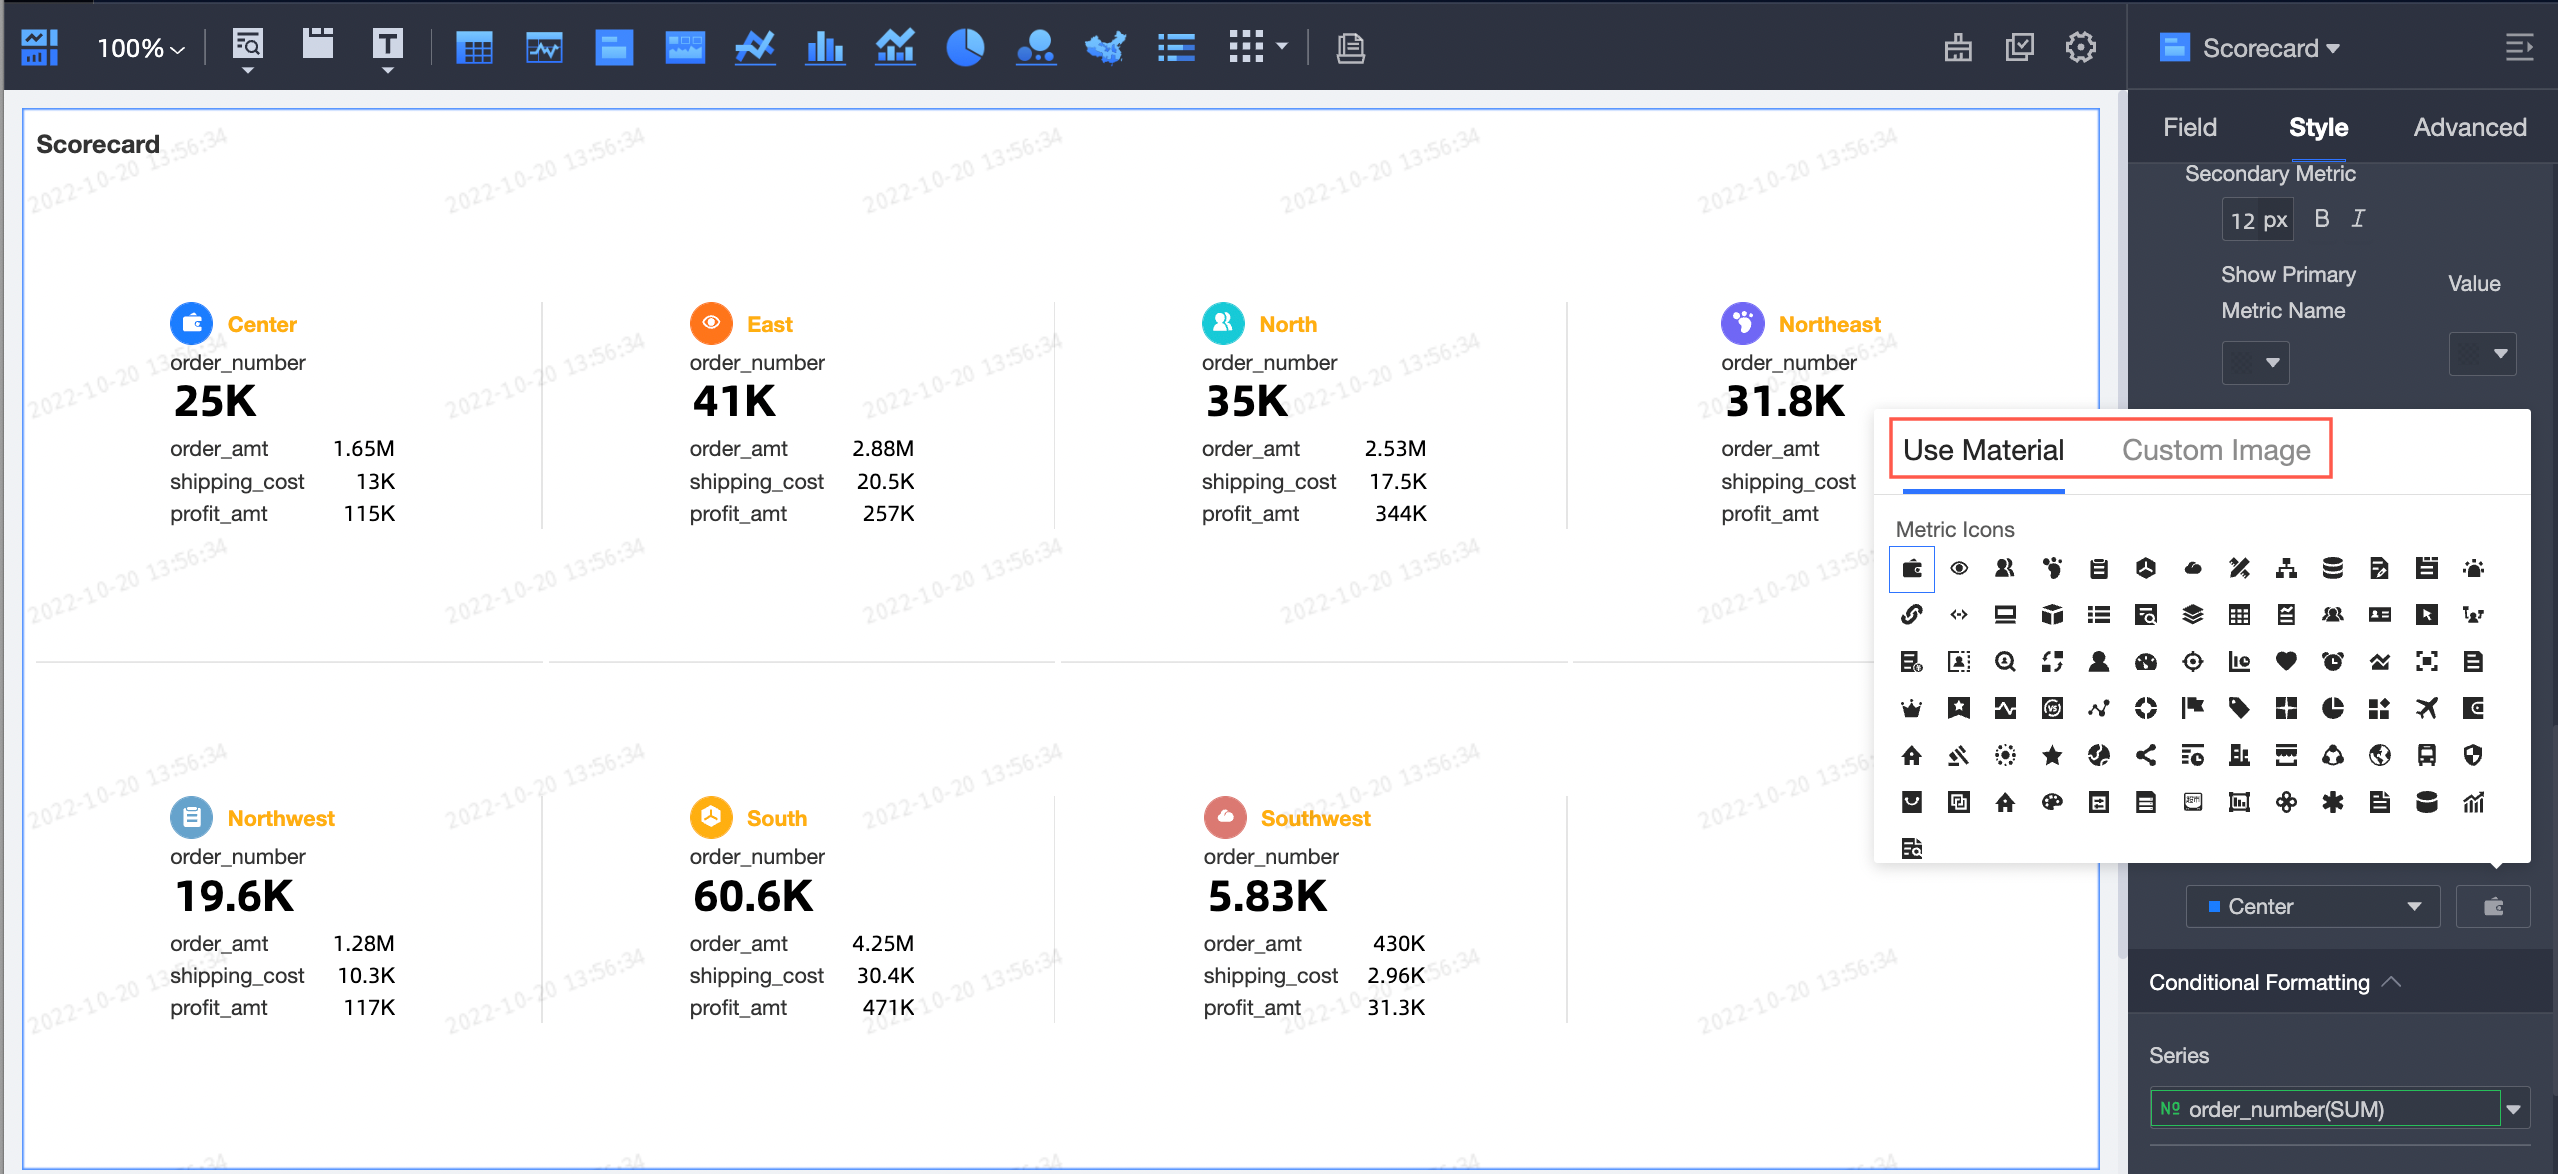
Specify whether to show icons for the dimension. If you select Show Main Indicator Trend Chart, you can configure Color Settings and Image Type.
In the Color Settings section, you can specify the colors of the icons.
You can set the Image Type parameter to Image Field or Static.
The Image Field option is available only when fields of the image type (
 ) are included in your dataset.
If you select Static, you can use metric icons or upload custom images.
 Note
NoteOnly PNG, JPG, and GIF images are supported.
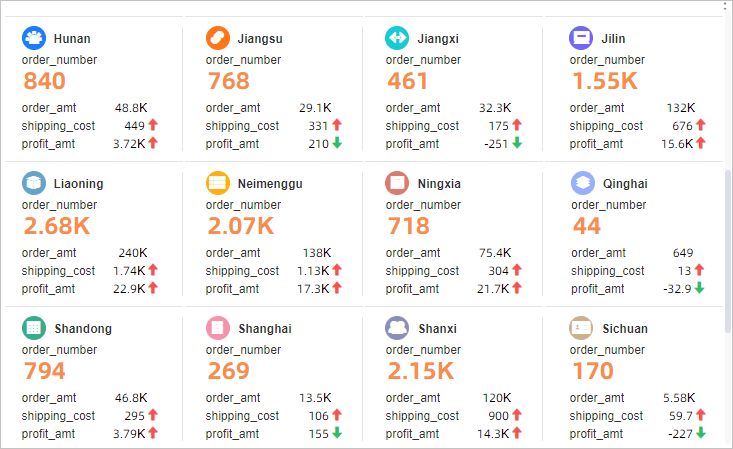
In the Conditional Formatting section, configure conditional formats for measures.
Parameter
Description
Series
Select a measure that you added to the Metrics (Mea.) field.
Shortcut Style
Configure the marker icons and font colors.
Custom Style
Customize text, icon style, marker icons, range values, and font colors.
Synchronize Style To
Replicate the conditional formatting settings of a measure to other measures.
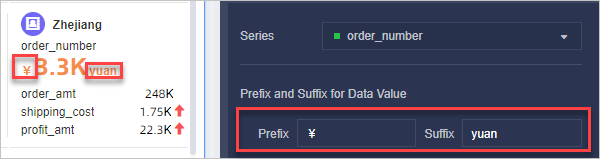
In the Series Settings section, configure Series and Prefix and Suffix for Data Value.
Parameter
Description
Series
The series. You can select a measure that you added to the Metrics (Mea.) field.
Prefix and Suffix for Data Value
The prefix and suffix of a value.
Configure advanced settings
Parameter | Description |
Linkage | If the data that you want to analyze belongs to different charts or tables, you can configure this feature to associate the charts and tables, and then analyze the data. For more information, see the "Configure the filter interaction feature" section of the Drilling, filter interaction, and hyperlink topic. |
Hyperlink | If the data that you want to analyze belongs to different dashboards, you can configure this feature to associate the dashboards and then analyze the data. You can set the Hyperlink parameter to Parameter or External link. For more information, see the "Configure the hyperlink feature" section of the Drilling, filter interaction, and hyperlink topic. |
Limits
When you create a kanban, you must specify Labels (Dim.) and Metrics (Mea.).
You can specify only one dimension for Labels (Dim.), such as area.
You can specify 1 to 20 measures for Metrics (Mea.), such as order_number and order_amt.
What to do next
You can share a dashboard with specific users if they want to view the dashboard. For more information, see Share a dashboard.
If you want to create a complex navigation menu for thematic analysis, you can integrate the dashboard that you create into a business intelligence (BI) portal. For more information, see Create a BI portal.