Category | Link |
Log collection | |
Application Monitoring | |
Managed Service for Prometheus |
|
Open source Prometheus monitoring (ack-prometheus-operator component) | |
Alert management | |
Other issues |
Log collection
How do I troubleshoot container log collection errors?
Symptoms
If you followed the instructions in Collect ACK cluster container logs but cannot find the logs on the Preview page of the Simple Log Service console, the log collection may have failed. To troubleshoot this issue, check the configuration, the status of collection components and nodes, and the operational logs of the log collection container.
Before you begin
Note the following points when you collect logs from container files.
The log collection component collects only incremental logs. If the log file is not updated after the Logtail configuration is applied, the component does not collect logs from the file. For more information, see Read logs.
You can collect logs only from files that use the default container storage or are mounted to a local path. Other storage methods are not supported.
After logs are collected, you must create an index before you can query and analyze the logs in the Logstore. For more information, see Create an index.
Step 1: Check the collection configuration
Verify that the Logtail configuration is correct. Make sure that all log collection settings are accurate and that the container continuously generates logs.
Console
Log on to the Container Service for Kubernetes console.
On the Clusters page, click the target cluster. In the left navigation pane, choose .
On the Resource Object Browser tab, search for clusteraliyunpipelineconfig and click the ClusterAliyunPipelineConfig result.
In the ClusterAliyunPipelineConfig panel, find the target resource and click Edit YAML in the Actions column.
kubectl
Run the following command to view all Logtail configurations created by
AliyunPipelineConfig.kubectl get clusteraliyunpipelineconfigsView the details and status of a Logtail configuration created by
AliyunPipelineConfig.Run the following command. Replace
<config_name>with the name of theAliyunPipelineConfigas needed.kubectl get clusteraliyunpipelineconfigs <config_name> -o yaml
For more information about the configuration items, see CRD parameters.
Configuration item | Checkpoint overview | Example |
| Check whether the project name is correct. Log on to the Simple Log Service console, and find the name of the project generated by the installed log collection component. |
|
| Check whether the log file path exists and has output. For more information, see Container file path mapping. |
|
| The container discovery feature is enabled. |
|
| The Simple Log Service Endpoint is correct. |
|
| The region information is correct. |
|
Step 2: Check the status of the collection component and machine group
Confirm that a collection component, such as Logtail or LoongCollector, is deployed and running on each worker node, and that the number of OK heartbeats from the collection containers matches the number of worker nodes.
Check the status of the collection component pod.
Run the following command to check whether all related collection pods are in the
Runningstate. If a pod is in an abnormal state, see Troubleshoot pod exceptions.kubectl get pods -n kube-system -l 'k8s-app in (loongcollector-ds,logtail)'The output is similar to the following:
NAME                      READY   STATUS    RESTARTS   AGE
loongcollector-ds-fn5zn   1/1     Running   0          3d19h
loongcollector-ds-ks76g   1/1     Running   0          3d19h
Check the heartbeat status of the machine group.
Log on to the Simple Log Service console.
In the Projects section, click the one you want.

In the navigation pane on the left, choose
 Resource > Machine Groups.
In the machine group list, click the destination machine group.
On the Machine Group Configuration page, note the number of machines with a heartbeat status of OK. Verify that this number matches the number of worker nodes in the cluster. For more information, see Heartbeat Status Solution.
Step 3: View the LoongCollector (Logtail) operational logs
Check the collection container for collection errors or error messages to further analyze the cause of the problem.
Enter the collection component pod.
kubectl exec -it -n kube-system loongcollector-ds-XXXX -- bashLogtail logs are stored in the
/usr/local/ilogtail/directory of the Logtail container. The filenames areilogtail.LOGandlogtail_plugin.LOG. You can log on to the Logtail container and run the following commands to view the log files:# Open the /usr/local/ilogtail/ directory. cd /usr/local/ilogtail # View the ilogtail.LOG and logtail_plugin.LOG files. cat ilogtail.LOG cat logtail_plugin.LOGView the alarm metric of the error log and find the corresponding solution in Common error types for data collection in Simple Log Service.
Other O&M operations
View the status of Simple Log Service components in a Kubernetes cluster
View the status of Simple Log Service components in a Kubernetes cluster
Run the following command to view the status and information of the Simple Log Service deployment.
kubectl get deploy -n kube-system | grep -E 'alibaba-log-controller|loongcollector-operator'The following result is returned:
NAME                     READY   UP-TO-DATE   AVAILABLE   AGE
alibaba-log-controller   1/1     1            1           11d
Run the following command to view the status information of the DaemonSet resource.
kubectl get ds -n kube-system | grep -E 'logtail-ds|loongcollector-ds'The following result is returned:
NAME         DESIRED   CURRENT   READY   UP-TO-DATE   AVAILABLE   NODE SELECTOR  AGE
logtail-ds   2         2         2       2            2           **ux           11d
View the version number, IP address, and startup time of Logtail
The information is stored in the
/usr/local/ilogtail/app_info.jsonfile of the Logtail container.kubectl exec logtail-ds-****k -n kube-system cat /usr/local/ilogtail/app_info.jsonA result similar to the following is returned.
{
   "UUID" : "",
   "hostname" : "logtail-****k",
   "instance_id" : "0EB****_172.20.4.2_1517810940",
   "ip" : "172.20.4.2",
   "logtail_version" : "0.16.2",
   "os" : "Linux; 3.10.0-693.2.2.el7.x86_64; #1 SMP Tue Sep 12 22:26:13 UTC 2017; x86_64",
   "update_time" : "2018-02-05 06:09:01"
}
Transfer ACK cluster logs to a project in another Alibaba Cloud account
Why can't I delete a project?
Symptoms
This topic describes how to delete a project and what to do if you cannot delete a project and receive an "insufficient permissions" error message.
Solution
For more information about how to delete a project or Logstore, see Manage projects and Manage a Logstore. If a project fails to be deleted, see What do I do if the "Operation denied, insufficient permissions" error message is returned when I delete a project?
Common error types for data collection in Simple Log Service
Error type | Description | Solution |
LOG_GROUP_WAIT_TOO_LONG_ALARM | A data packet waits too long to be sent after it is generated. | Check whether packets are being sent as expected. This error can be caused by a data volume that exceeds the default configuration, an insufficient quota, or network issues. |
LOGFILE_PERMISSION_ALARM | Logtail does not have permission to read the specified file. | Check the Logtail startup account on the server. Resolve this by starting Logtail as the root user. |
SPLIT_LOG_FAIL_ALARM | The regular expression for the start of a line does not match the log content, which prevents Logtail from splitting the log into separate lines. | Check whether the regular expression is correct. For single-line logs, set the regular expression to |
MULTI_CONFIG_MATCH_ALARM | By default, a log file can match only one Logtail configuration. If multiple Logtail configurations match the same file, only one takes effect. Note Multiple Logtail configurations can be used to collect the standard output from Docker. |
|
REGEX_MATCH_ALARM | In full regular expression mode, the log content does not match the specified regular expression. | Copy the log sample from the error message to generate a new regular expression. |
PARSE_LOG_FAIL_ALARM | In modes such as JSON and delimiter, parsing fails because the log format does not conform to the defined format. | Click the error message to view the detailed error report. |
CATEGORY_CONFIG_ALARM | The Logtail collection configuration is invalid. | A common cause is that the regular expression failed to extract the file path to use as a topic. |
LOGTAIL_CRASH_ALARM | Logtail crashed because it exceeded the server resource usage limit. | Increase the CPU and memory usage limits. For more information, see Set Logtail startup parameters. |
REGISTER_INOTIFY_FAIL_ALARM | Logtail failed to register the log listener in Linux. This error may occur because Logtail does not have permission to access the folder, or the folder was deleted. | Check whether Logtail has permission to access the folder or whether the folder was deleted. |
DISCARD_DATA_ALARM | The CPU resources configured for Logtail are insufficient, or throttling is triggered when data is sent over the network. | Increase the CPU usage limit or the network sending concurrency limit. For more information, see Set Logtail startup parameters. |
SEND_DATA_FAIL_ALARM |
|
|
REGISTER_INOTIFY_FAIL_ALARM | Logtail failed to register the inotify watcher for the log directory. | Check whether the directory exists and verify its permission settings. |
SEND_QUOTA_EXCEED_ALARM | The log write traffic exceeds the configured limit. | Increase the number of shards in the console. For more information, see Split a shard. |
READ_LOG_DELAY_ALARM | Log collection is delayed and falling behind log generation. This error is usually caused by insufficient CPU resources for Logtail or by network sending throttling. | Increase the CPU usage limit or the network sending concurrency limit. For more information, see Set Logtail startup parameters. If you are importing historical data, a large amount of data is collected in a short period of time. You can ignore this error. |
DROP_LOG_ALARM | Log collection is delayed, and the number of unprocessed rotated log files exceeds 20. This error is usually caused by insufficient CPU resources for Logtail or by network sending throttling. | Increase the CPU usage limit or the network sending concurrency limit. For more information, see Set Logtail startup parameters. |
LOGDIR_PERMISSION_ALARM | Logtail does not have permission to read the log monitoring directory. | Check whether the log monitoring directory exists. If it does, verify its permission settings. |
ENCODING_CONVERT_ALARM | Encoding conversion failed. | Check that the configured encoding format matches the actual encoding format of the log. |
OUTDATED_LOG_ALARM | The logs are outdated because their timestamps are more than 12 hours older than the collection time. Possible causes include the following:
|
|
STAT_LIMIT_ALARM | The number of files in the directory specified in the collection configuration exceeds the limit. | Check whether the target collection directory contains many files and subdirectories. Set an appropriate root directory for monitoring and specify a maximum monitoring depth for subdirectories. You can also modify the mem_usage_limit parameter. For more information, see Set Logtail startup parameters. |
DROP_DATA_ALARM | Saving logs to the local disk timed out when the process exited. Any logs that were not saved are discarded. | This error usually occurs because the collection process is severely blocked. Increase the CPU usage limit or the network sending concurrency limit. For more information, see Set Logtail startup parameters. |
INPUT_COLLECT_ALARM | An error occurred during collection from the input source. | Resolve the error based on the details in the error message. |
HTTP_LOAD_ADDRESS_ALARM | The Addresses parameter specified in the HTTP data collection configuration is invalid. | Check whether the Addresses parameter is valid. |
HTTP_COLLECT_ALARM | An error occurred during HTTP data collection. | Troubleshoot the issue based on the details in the error message. This error is usually caused by a timeout. |
FILTER_INIT_ALARM | An error occurred during filter initialization. | This error is usually caused by an invalid regular expression in the filter. Correct the expression based on the details in the error message. |
INPUT_CANAL_ALARM | A runtime error occurred in MySQL binary logging. | Troubleshoot the issue based on the details in the error message. The canal service may restart when the configuration is updated. Ignore errors that are caused by a service restart. |
CANAL_INVALID_ALARM | The internal status of MySQL binary logging is abnormal. | This error usually occurs when a change to the table schema during runtime causes metadata inconsistency. Confirm whether the table schema was modified at the time the error was reported. |
MYSQL_INIT_ALARM | An error occurred during MySQL initialization. | Resolve the error based on the details in the error message. |
MYSQL_CHECKPOINT_ALARM | The MySQL checkpoint format is abnormal. | Confirm whether the checkpoint-related settings in this configuration have been modified. |
MYSQL_TIMEOUT_ALARM | The MySQL query timed out. | Confirm that the MySQL server and network are functioning normally. |
MYSQL_PARSE_ALARM | Failed to parse the MySQL query results. | Confirm that the checkpoint format in the MySQL configuration matches the format of the corresponding field. |
AGGREGATOR_ADD_ALARM | Failed to add data to the queue. | This error indicates that data is being sent too quickly. Ignore this error if the actual data volume is large. |
ANCHOR_FIND_ALARM | An error occurred in the processor_anchor plugin. This can be caused by an incorrect configuration or by logs that do not conform to the configuration. | Click the error link to view the detailed error message. The error has the following subtypes. Check your configuration based on the details of the specific subtype.
|
ANCHOR_JSON_ALARM | An error occurred in the processor_anchor plugin when expanding the JSON content defined by the Start and Stop parameters. | Click the error link to view the detailed error message. Check the content being processed and the related configurations to identify configuration errors or find invalid logs. |
CANAL_RUNTIME_ALARM | A runtime error occurred in the binary logging plugin. | Click the error link to view the detailed error message and troubleshoot the issue. This error is usually related to the connected primary MySQL instance. |
CHECKPOINT_INVALID_ALARM | Failed to parse the checkpoint. | Click the error link to view the detailed error message. Troubleshoot the issue based on the checkpoint key, checkpoint content (the first 1024 bytes), and the specific error message. |
DIR_EXCEED_LIMIT_ALARM | The number of directories that Logtail is listening to simultaneously exceeds the limit. | Check whether the collection configuration for the current logstore and other configurations applied to Logtail involve many directories. Set an appropriate root directory for monitoring and specify a maximum monitoring depth for subdirectories. |
DOCKER_FILE_MAPPING_ALARM | Logtail failed to add a Docker file mapping by running a command. | Click the error link to view the detailed error message. Troubleshoot the issue based on the command and the specific error message. |
DOCKER_FILE_MATCH_ALARM | The specified file cannot be found in the Docker container. | Click the error link to view the detailed error message. Troubleshoot the issue based on the container information and the file path being searched. |
DOCKER_REGEX_COMPILE_ALARM | An error occurred in the service_docker_stdout plugin. The plugin failed to compile the BeginLineRegex from the configuration. | Click the error link to view the detailed error message. Check whether the regular expression is correct. |
DOCKER_STDOUT_INIT_ALARM | The service_docker_stdout plugin failed to initialize. | Click the error link to view the detailed error message. The error has the following subtypes.
|
DOCKER_STDOUT_START_ALARM | The stdout size exceeds the limit during collection by the service_docker_stdout plugin. | This error usually occurs if stdout data already exists during the first collection. Ignore this error. |
DOCKER_STDOUT_STAT_ALARM | The service_docker_stdout plugin cannot detect the stdout. | This error usually occurs because stdout is inaccessible when the container exits. Ignore this error. |
FILE_READER_EXCEED_ALARM | The number of file objects that Logtail has open simultaneously exceeds the limit. | This error usually occurs because too many files are being collected at the same time. Check whether the collection configuration is reasonable. |
GEOIP_ALARM | An error occurred in the processor_geoip plugin. | Click the error link to view the detailed error message. The error has the following subtypes.
|
HTTP_INIT_ALARM | An error occurred in the metric_http plugin. The ResponseStringMatch regular expression specified in the configuration failed to compile. | Click the error link to view the detailed error message. Check whether the regular expression is correct. |
HTTP_PARSE_ALARM | An error occurred in the metric_http plugin. The plugin failed to retrieve the HTTP response. | Click the error link to view the detailed error message. Check the configuration content or the requested HTTP server based on the specific error message. |
INIT_CHECKPOINT_ALARM | An error occurred in the binary logging plugin. The plugin failed to load the checkpoint file. The plugin ignores the checkpoint and starts processing from the beginning. | Click the error link to view the detailed error message. Determine whether to ignore this error based on the specific error information. |
LOAD_LOCAL_EVENT_ALARM | Logtail is handling a local event. | This warning is uncommon. If it is not caused by a manual operation, you must troubleshoot the issue. Click the error link to view the detailed error message. Troubleshoot the issue based on the file name, configuration name, project, and logstore. |
LOG_REGEX_FIND_ALARM | An error occurred in the processor_split_log_regex and processor_split_log_string plugins. The SplitKey specified in the configuration cannot be found in the logs. | Click the error link to view the detailed error message and check for configuration errors. |
LUMBER_CONNECTION_ALARM | An error occurred in the service_lumberjack plugin. The server was shut down while the plugin was stopping. | Click the error link to view the detailed error message. Troubleshoot the issue based on the specific error information. You can usually ignore this error. |
LUMBER_LISTEN_ALARM | An error occurred in the service_lumberjack plugin during listener initialization. | Click the error link to view the detailed error message. The error has the following subtypes.
|
LZ4_COMPRESS_FAIL_ALARM | An error occurred when Logtail performed LZ4 compression. | Click the error link to view the detailed error message. Troubleshoot the issue based on the values of the log lines, project, category, and region. |
MYSQL_CHECKPOINT_ALARM | An error occurred in the MySQL plugin related to checkpoints. | Click the error link to view the detailed error message. The error has the following subtypes.
|
NGINX_STATUS_COLLECT_ALARM | An error occurred in the nginx_status plugin while retrieving the status. | Click the error link to view the detailed error message. Troubleshoot the issue based on the URL and the specific error information. |
NGINX_STATUS_INIT_ALARM | An error occurred in the nginx_status plugin. The plugin failed to initialize and parse the URL specified in the configuration. | Click the error link to view the detailed error message. Check whether the URL is configured correctly. |
OPEN_FILE_LIMIT_ALARM | The number of files opened by Logtail exceeds the limit, and no new files can be opened. | Click the error link to view the detailed error message. Troubleshoot the issue based on the log file path, project, and logstore. |
OPEN_LOGFILE_FAIL_ALARM | An error occurred when Logtail tried to open a file. | Click the error link to view the detailed error message. Troubleshoot the issue based on the log file path, project, and logstore. |
PARSE_DOCKER_LINE_ALARM | An error occurred in the service_docker_stdout plugin. The plugin failed to parse the log. | Click the error link to view the detailed error message. The error has the following subtypes.
|
PLUGIN_ALARM | An error occurred during plugin initialization and related calls. | Click the error link to view the detailed error message. The error has the following subtypes. Troubleshoot the issue based on the specific error details.
|
PROCESSOR_INIT_ALARM | An error occurred in the processor_regex plugin. The plugin failed to compile the Regex regular expression specified in the configuration. | Click the error link to view the detailed error message. Check whether the regular expression is correct. |
PROCESS_TOO_SLOW_ALARM | Logtail is parsing logs too slowly. |
|
REDIS_PARSE_ADDRESS_ALARM | An error occurred in the Redis plugin. The plugin failed to parse the ServerUrls provided in the configuration. | Click the error link to view the detailed error message. Check the URL for which the error was reported. |
REGEX_FIND_ALARM | An error occurred in the processor_regex plugin. The plugin cannot find the field specified by SourceKey in the configuration. | Click the error link to view the detailed error message. Check for an incorrect SourceKey configuration or invalid logs. |
REGEX_UNMATCHED_ALARM | An error occurred in the processor_regex plugin. A match failed. | Click the error link to view the detailed error message. The error has the following subtypes. Troubleshoot the issue based on the specific error information.
|
SAME_CONFIG_ALARM | A configuration with the same name already exists for the logstore. The configuration that is discovered later is discarded. | Click the error link to view the detailed error message. Check for configuration errors based on the configuration path and other information. |
SPLIT_FIND_ALARM | An error occurred in the split_char and split_string plugins. The plugins cannot find the field specified by SourceKey in the configuration. | Click the error link to view the detailed error message. Check for an incorrect SourceKey configuration or invalid logs. |
SPLIT_LOG_ALARM | An error occurred in the processor_split_char and processor_split_string plugins. The number of parsed fields is different from the number specified in SplitKeys. | Click the error link to view the detailed error message. Check for an incorrect SourceKey configuration or invalid logs. |
STAT_FILE_ALARM | An error occurred when collecting data from a file using the LogFileReader object. | Click the error link to view the detailed error message. Troubleshoot the issue based on the file path and error information. |
SERVICE_SYSLOG_INIT_ALARM | An error occurred in the service_syslog plugin. The plugin failed to initialize. | Click the error link to view the detailed error message. Check whether the Address parameter in the configuration is correct. |
SERVICE_SYSLOG_STREAM_ALARM | An error occurred in the service_syslog plugin during data collection over TCP. | Click the error link to view the detailed error message. The error has the following subtypes. Troubleshoot the issue based on the specific error details.
|
SERVICE_SYSLOG_PACKET_ALARM | An error occurred in the service_syslog plugin during data collection over UDP. | Click the error link to view the detailed error message. The error has the following subtypes. Troubleshoot the issue based on the specific error details.
|
PARSE_TIME_FAIL_ALARM | The plugin failed to parse the log time. | Identify and resolve the issue in one of the following ways:
|
Application Monitoring
Why is no monitoring data available after I install a probe for an application in an ACK cluster?
Cause
Application monitoring is suspended.
The ARMS agent is not loaded as expected at the pod where the application resides.
Solution
Check whether application monitoring is paused.
Log on to the ARMS console. In the left-side navigation pane, choose .
On the Application List page, select a region in the top navigation bar and click the name of the application.
If the application is not found, proceed to Step 2: Check whether the ARMS agent is loaded as expected.
If you are using the new Application Real-Time Monitoring Service (ARMS) console, choose in the top navigation bar of the application details page. In the Probe switch settings section, check whether application monitoring is suspended.
If Pause application monitoring is turned on, turn off the switch and click Save.
If Pause application monitoring is turned off, proceed to Step 2: Check whether the ARMS agent is loaded as expected.
If you are using the old ARMS console, click Application Settings in the left-side navigation pane of the application details page. On the page that appears, click the Custom Configuration tab. In the Agent Switch Settings section, check whether Probe Master Switch is turned on.
If Probe Master Switch is turned off, turn on Probe Master Switch and click Save in the lower part of the page.
If Probe Master Switch is turned on, proceed to Step 2: Check whether the ARMS agent is loaded as expected.
Check whether the probe is loaded correctly.
Log on to the ACK console. In the left-side navigation pane, click Clusters. On the Clusters page, click the name of the cluster to go to the cluster details page.
In the left-side navigation pane, choose .
On the Pods page, select the namespace in which your application resides, find the application, and then click Edit YAML in the Actions column.
In the Edit YAML dialog box, check whether the YAML file contains initContainers.
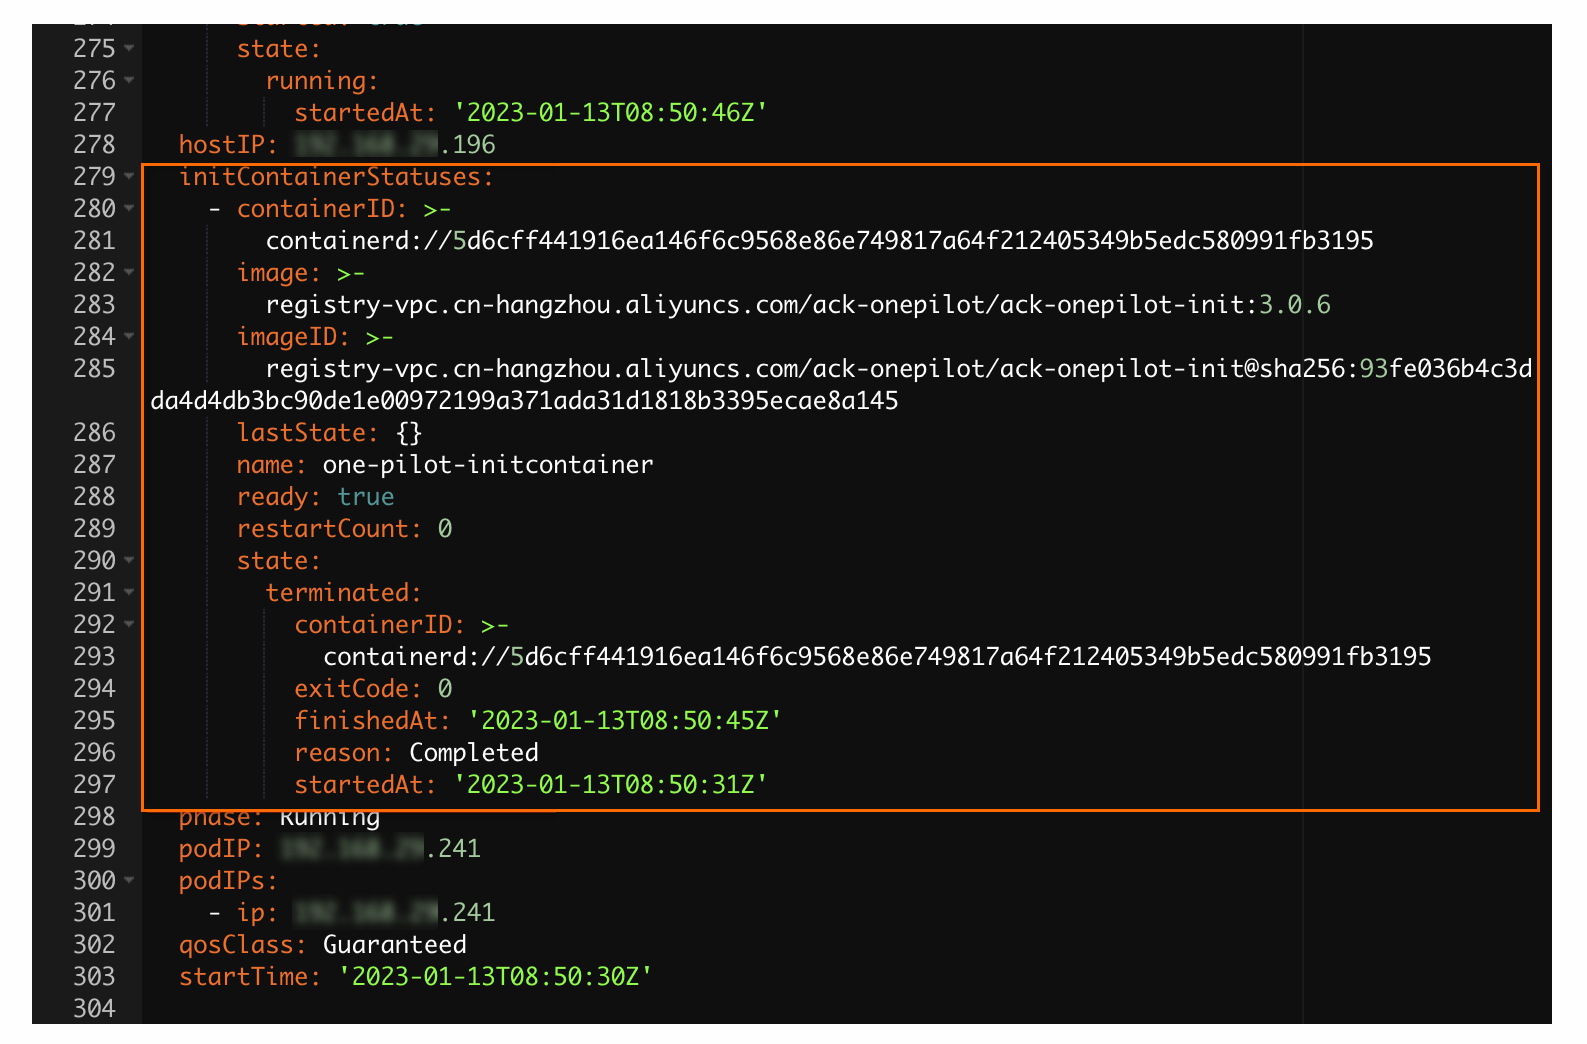
In the left-side navigation pane of the cluster details page, choose . On the page that appears, set the Namespace parameter to ack-onepilot. Check if any pod named
ack-onepilot-*with completed rolling updates exists in the pod list.If the specified pod exists, perform Step 6.
If the specified pod does not exist, install the ack-onepilot component from the application market. For more information, see How do I install ack-onepilot and uninstall arms-pilot?
In the left-side navigation pane of the cluster details page, choose Workloads > Deployments or StatefulSets. On the page that appears, find the application and choose
 > Edit YAML in the Actions column. In the Edit YAML dialog box, check whether the YAML file contains the following labels in the spec.template.metadata section:
 labels: armsPilotAutoEnable: "on" armsPilotCreateAppName: "<your-deployment-name>" # Replace <your-deployment-name> with the actual application name. armsSecAutoEnable: "on" # If you want to connect the application to Application Security, you must configure this parameter.If the YAML file contains the labels, perform Step 7.
If the YAML file does not contain the labels, perform the following operations: In the Edit YAML dialog box, add the labels to the spec > template > metadata section and replace <your-deployment-name> with the actual application name. Then, click Update.
In the left-side navigation pane of the cluster details page, choose . On the page that appears, find the pod and choose in the Actions column to check whether the pod logs of ack-onepilot report a Security Token Service (STS) error in the
"Message":"STS error"format.If the error is reported, authorize the cluster of the application and restart the pod of the application. For more information, see Install the ARMS agent for Java applications deployed in ACK.
If the error is not reported, submit a ticket.
In the left-side navigation pane of the cluster details page, choose , find the pod and click Edit YAML in the Actions column. In the Edit YAML dialog box, check whether the YAML file contains the following javaagent parameter:
-javaagent:/home/admin/.opt/ArmsAgent/aliyun-java-agent.jarNoteIf you use an ARMS agent earlier than 2.7.3.5, replace aliyun-java-agent.jar in the preceding code with arms-bootstrap-1.7.0-SNAPSHOT.jar. We recommend that you upgrade the agent to the latest version at the earliest opportunity.
If the YAML file contains the parameter, find the pod on the Pods page and click Terminal in the Actions column to go to the command line page. Run the following command to check whether the logs file contains a log file with the .log file extension. Then, submit a ticket.
cd /home/admin/.opt/ArmsAgent/logsIf the YAML file does not contain the parameter, submit a ticket.
The ARMS Addon Token does not exist in the cluster
Symptoms
The ARMS Addon Token does not exist in the target cluster.
Log on to the ACK console. In the left-side navigation pane, click Clusters. On the Clusters page, click the name of the cluster to go to the cluster details page.
In the left-side navigation pane, choose .
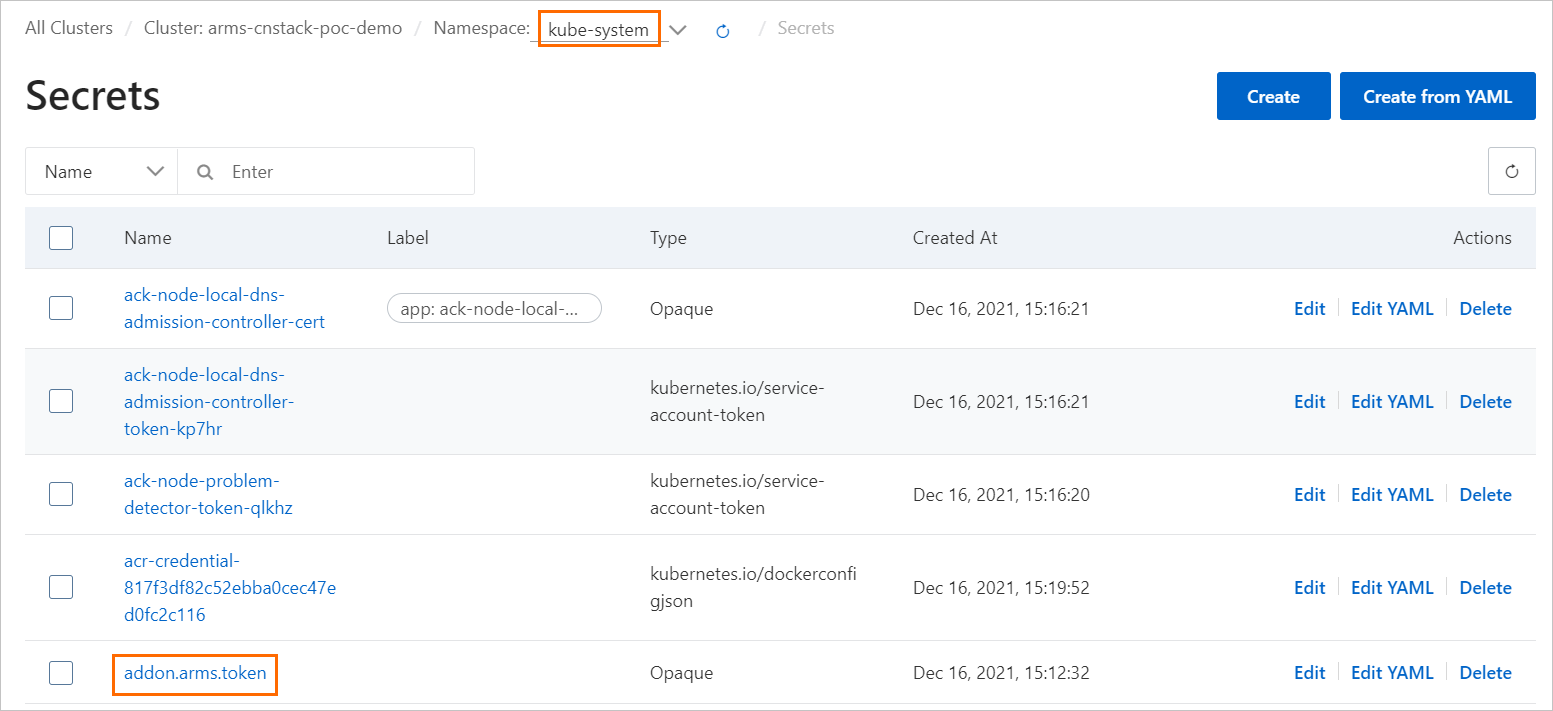
In the upper part of the page, select kube-system from the Namespace drop-down list to check whether addon.arms.token is enabled.
Solution
Grant Container Service for Kubernetes access permissions to ARMS resources.
Why does monitoring data become abnormal after an application is moved to a different cluster or namespace?
Symptoms
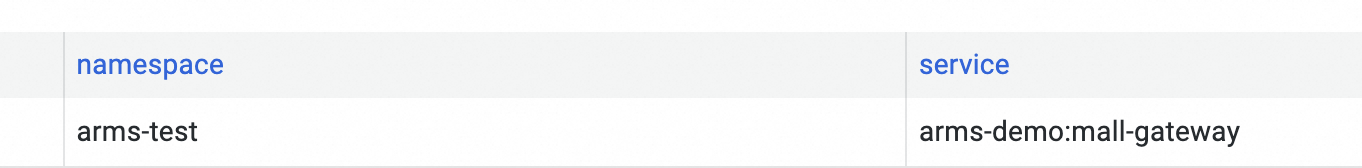
The value displayed in the namespace column on the custom dashboard is not updated after you change the namespace of your application.
After you change the cluster of your application, the data for rate, errors, and duration (RED) metrics is displayed normally but no data is displayed for container monitoring metrics, such as CPU and memory.
Possible cause
Container-related parameters, such as Namespace and ClusterId, are configured when the application is created and the values of these parameters cannot be automatically updated. If you change the cluster or namespace of your application, the container-related data may fail to be queried or displayed.
Solution
Delete the application, recreate the application, and then report monitoring data again. For more information, see Delete applications.
This method causes the loss of historical data.
Submit a ticket.
How do I customize the mount path for a Java probe?
Background
Typically, the ack-onepilot component specifies the mount path for Application Real-Time Monitoring Service (ARMS) agents for Java by injecting the environment variable JAVA_TOOL_OPTIONS. However, you may need to customize this path for scenarios such as:
Centralized configuration management
Manage the mount path through a Kubernetes ConfigMap to ensure environment consistency.
Persistent storage
Store agent files in a custom persistent volume claim (PVC) to meet enterprise security or O&M requirements.
Solution
To customize the mount path for ARMS agents for Java, these version requirements must be met:
ack-onepilot: V4.1.0 or later.
ARMS agent for Java: V4.2.2 or later. You can control the version of your ARMS agent for Java.
This configuration also applies to Microservice Engine (MSE) due to shared ack-onepilot integration.
Add the
disableJavaToolOptionsInjectionannotation to the Kubernetes workload, such as a deployment, that requires a custom mount path.The ack-onepilot component will not automatically set the mount path or other Java Virtual Machine (JVM) parameters using the environment variable
JAVA_TOOL_OPTIONS.To view the YAML file of the deployment, run the following command:
kubectl get deployment {Deployment name} -o yamlNoteIf you're not sure about the deployment name, run the following command to list all deployments:
kubectl get deployments --all-namespaceThen, find the one you want in the results and view its YAML file.
Run the following command to edit the YAML file:
kubectl edit deployment {Deployment name} -o yamlIn the YAML file, add the following labels to
spec.template.metadata:labels: armsPilotAutoEnable: "on" armsPilotCreateAppName: "<your-deployment-name>" # The name of your deployment. disableJavaToolOptionsInjection: "true" # If you want to customize the mount path for the ARMS agent for Java, set this parameter to true.
Replace the default mount path
/home/admin/.opt/AliyunJavaAgent/aliyun-java-agent.jarin your Java startup script or command with your custom path:java -javaagent:/home/admin/.opt/AliyunJavaAgent/aliyun-java-agent.jar ... ... -jar xxx.jarOther information such as the reporting region and license key is provided by ack-onepilot through environment variables.
How do I report data from an ACK cluster across regions?
Symptoms
How do I report data from Region A to Region B?
Solution
Update the ack-onepilot component to V4.0.0 or later.
Add the ARMS_REPORT_REGION environment variable to the ack-onepilot-ack-onepilot application in the ack-onepilot namespace. The value must be the ID of a region where ARMS is available. Example: cn-hangzhou or cn-beijing.
Restart the existing application or deploy a new application to report data across regions.
NoteAfter the environment variable is added, all applications deployed in the cluster report data to the region specified in the previous step.
How do I uninstall arms-pilot and install ack-onepilot?
Background
The old Application Monitoring agent arms-pilot is no longer maintained. You can install the new agent ack-onepilot to monitor your applications. ack-onepilot is fully compatible with arms-pilot. You can seamlessly install ack-onepilot without the need to modify application configurations. This topic describes how to uninstall arms-pilot and install ack-onepilot.
Solution
You must install ack-onepilot in an ACK cluster V1.16 or later. If your cluster is earlier than V1.16, upgrade the cluster first. For more information, see Update the Kubernetes version of an ACK cluster.
You must uninstall arms-pilot before installing ack-onepilot. If you have both ack-onepilot and arms-pilot installed, the ARMS agent cannot be mounted. If arms-pilot is not completely uninstalled, ack-onepilot does not work because it regards that arms-pilot is still working in the environment.
When you uninstall arms-pilot and install ack-onepilot, the configurations of arms-pilot cannot be automatically synchronized to ack-onepilot. We recommend that you record the configurations and then manually configure ack-onepilot.
Uninstall arms-pilot.
Log on to the ACK console. On the Clusters page, click the name of the cluster.
In the left-side navigation pane, choose .
On the Helm page, find arms-pilot and click Delete in the Actions column.
In the Delete message, click OK.
Check whether arms-pilot has been uninstalled.
Go to the cluster details page of the ACK console. In the left-side navigation pane, choose . On the Deployments page, select arms-pilot from the Namespace drop-down list, and check whether the pods of the namespace are deleted as expected.
NoteIf you have modified the namespace to which arms-pilot belongs, select the new namespace.
Install ack-onepilot.
Log on to the ACK console. On the Clusters page, click the name of the cluster.
In the left-side navigation pane, click . On the Add-ons page, search for ack-onepilot.
Click Install on the ack-onepilot card.
NoteBy default, the ack-onepilot component supports 1,000 pods. For every additional 1,000 pods in the cluster, you must add 0.5 CPU cores and 512 MB memory for the component.
In the dialog box that appears, configure the parameters and click OK. We recommend that you use the default values.
NoteAfter you install ack-onepilot, you can upgrade, configure, or uninstall it on the Add-ons page.
Check whether ack-onepilot has been installed.
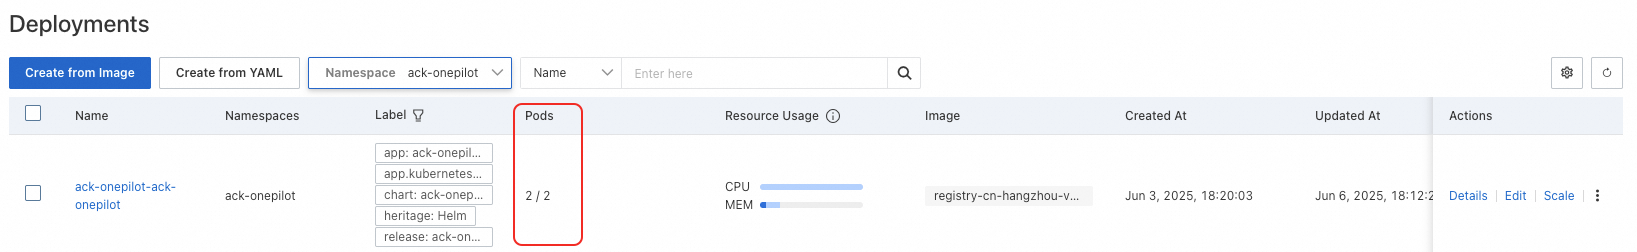
Go to the cluster details page of the ACK console. In the left-side navigation pane, choose . On the Deployments page, select ack-onepilot from the Namespace drop-down list, and check whether the pods of the namespace are running as expected.
Managed Service for Prometheus
The Prometheus monitoring page displays "No related dashboard found"
Symptoms
If you enable Prometheus monitoring and see the message No dashboard is found on the page for the target cluster, follow the procedure below to resolve the issue.

Solution
Reinstall the Prometheus monitoring component.
Reinstall the component:
After confirming that the uninstallation is complete, click Install, and then click OK in the dialog box.
After the installation is complete, return to the Prometheus Monitoring page to check whether the issue is resolved.
If the issue persists, proceed to the next step.
Check the Prometheus instance connection.
In the navigation pane on the left of the ARMS console, click Integration Management.
On the Integrated Environments tab, check the Container Service list for a container environment with the same name as your cluster.
If no corresponding container environment exists: See Connect using the ARMS or Prometheus console.
If you have a container environment, click Configure Agent in the Actions column for the target environment to open the Configure Agent page.
Check whether the installed agents run as expected.
Why is data not displayed in Managed Service for Prometheus?
Cause
Data may not be displayed in Managed Service for Prometheus because the synchronization task with the Alibaba Cloud Prometheus service failed, which leads to resource registration failure, or because the Prometheus instance was not provisioned correctly. Follow the process below to check and resolve the issue.
Solution
Check the status of the provisioning task for Managed Service for Prometheus.
Log on to the Container Service for Kubernetes console. In the left navigation pane, click Clusters.
On the Clusters page, click the name of the target cluster. In the left navigation pane, choose .
On the Jobs page, set Namespace to arms-prom at the top of the page, and then click o11y-init-environment to verify that the job was successful.
If it is not successful, it may be because synchronizing with the Alibaba Cloud Prometheus service and registering resources failed. You can view its pod logs to find the specific reason for the failure. For more information, see Troubleshoot pod exceptions.
If the pod no longer exists, proceed with the following steps.
Reinstall the Prometheus monitoring component.
Reinstall the component:
After confirming that the uninstallation is complete, click Install, and then click OK in the dialog box.
After the installation is complete, return to the Prometheus Monitoring page to check whether the issue is resolved.
If the issue persists, proceed to the next step.
Check the Prometheus instance provisioning.
In the navigation pane on the left of the ARMS console, click Integration Management.
On the Integrated Environments tab, check the Container Service list for a container environment with the same name as your cluster.
If no corresponding container environment exists: See Connect using the ARMS or Prometheus console.
If you have a container environment, click Configure Agent in the Actions column for the target environment to open the Configure Agent page.
Check whether the installed agents run as expected.
Managed Service for Prometheus fails to be reinstalled and an error message "rendered manifests contain a resource that already exists" is reported
Symptoms
When you uninstall and reinstall the Prometheus agent, the following error message appears:
rendered manifests contain a resource that already exists. Unable to continue with install: existing resource conflict: kind: ClusterRole, namespace: , name: arms-pilot-prom-k8s
Cause
After you run commands to manually uninstall the Prometheus agent, resources such as roles may fail to be deleted.
Solution
Run the following command to find the ClusterRoles of the Prometheus agent:
kubectl get ClusterRoles --all-namespaces | grep promRun the following command to delete the ClusterRoles that are queried in the previous step:
kubectl delete ClusterRole [$Cluster_Roles] -n arms-promNoteThe [$Cluster_Roles] parameter specifies the ClusterRoles that are queried in the previous step.
If the issue persists after you delete the ClusterRoles, view the value of kind in the error message to check whether resources other than ClusterRoles exist. Perform the preceding operations to delete them in sequence.
How do I view the version of the ack-arms-prometheus component?
Background
You must check the version of the ack-arms-prometheus component that is deployed in your cluster and whether it needs to be updated.
Solution
Log on to the ACK console. In the left navigation pane, click Clusters.
On the Clusters page, find the one you want to manage and click its name. In the left navigation pane, click Add-ons.
On the Component Management page, click the Log And Monitoring tab and find the ack-arms-prometheus component.
The current version is displayed below the component name. If a later version is available, click Upgrade next to the version number to upgrade the component.
NoteThe Upgrade button is available only if the installed component is not the latest version.
Why can't I deploy GPU monitoring?
Cause
GPU monitoring may fail to deploy if a GPU node has taints. You can perform the following steps to check for taints on a GPU node.
Solution
Run the following command to view the taints of the target GPU node.
If the GPU node has custom taints, you will find entries related to them in the output. This topic uses a taint with a
keyoftest-key, avalueoftest-value, and aneffectofNoScheduleas an example:kubectl describe node cn-beijing.47.100.***.***Expected output:
Taints:test-key=test-value:NoScheduleYou can handle the taints on the GPU node in one of the following ways.
Run the following command to delete the taints of the GPU node.
kubectl taint node cn-beijing.47.100.***.*** test-key=test-value:NoSchedule-Declare a toleration for the taints of the GPU node to allow pods to be scheduled to the node.
# 1. Run the following command to edit ack-prometheus-gpu-exporter.
kubectl edit daemonset -n arms-prom ack-prometheus-gpu-exporter

# 2. Add the following fields to the YAML file to declare the toleration for the taints.
# Omit other fields.
# The tolerations field is added above the containers field and at the same level as the containers field.
tolerations:
- key: "test-key"
  operator: "Equal"
  value: "test-value"
  effect: "NoSchedule"
containers:
 # Omit other fields.
How do I completely uninstall ARMS-Prometheus to avoid reinstallation failures?
Background
If you delete only the namespace of Prometheus Monitoring for Alibaba Cloud, residual configurations may remain and cause reinstallation to fail. To completely and manually delete all ARMS-Prometheus configurations, perform the following operations.
Solution
Delete the arms-prom namespace.
kubectl delete namespace arms-promDelete the ClusterRoles.
kubectl delete ClusterRole arms-kube-state-metrics
kubectl delete ClusterRole arms-node-exporter
kubectl delete ClusterRole arms-prom-ack-arms-prometheus-role
kubectl delete ClusterRole arms-prometheus-oper3
kubectl delete ClusterRole arms-prometheus-ack-arms-prometheus-role
kubectl delete ClusterRole arms-pilot-prom-k8s
kubectl delete ClusterRole gpu-prometheus-exporter
kubectl delete ClusterRole o11y:addon-controller:role
kubectl delete ClusterRole arms-aliyunserviceroleforarms-clusterrole
Delete the ClusterRoleBindings.
kubectl delete ClusterRoleBinding arms-node-exporter
kubectl delete ClusterRoleBinding arms-prom-ack-arms-prometheus-role-binding
kubectl delete ClusterRoleBinding arms-prometheus-oper-bind2
kubectl delete ClusterRoleBinding arms-kube-state-metrics
kubectl delete ClusterRoleBinding arms-pilot-prom-k8s
kubectl delete ClusterRoleBinding arms-prometheus-ack-arms-prometheus-role-binding
kubectl delete ClusterRoleBinding gpu-prometheus-exporter
kubectl delete ClusterRoleBinding o11y:addon-controller:rolebinding
kubectl delete ClusterRoleBinding arms-kube-state-metrics-agent
kubectl delete ClusterRoleBinding arms-node-exporter-agent
kubectl delete ClusterRoleBinding arms-aliyunserviceroleforarms-clusterrolebinding
Delete the Roles and RoleBindings.
kubectl delete Role arms-pilot-prom-spec-ns-k8s
kubectl delete Role arms-pilot-prom-spec-ns-k8s -n kube-system
kubectl delete RoleBinding arms-pilot-prom-spec-ns-k8s
kubectl delete RoleBinding arms-pilot-prom-spec-ns-k8s -n kube-system
After you manually delete the ARMS-Prometheus resources, navigate to Operations Management > Component Management in the Container Service for Kubernetes (ACK) console to reinstall the ack-arms-prometheus component.
An "xxx in use" error occurs when installing the ack-arms-prometheus component
Cause
When you deploy the ack-arms-prometheus component, an "xxx in use" error is reported. This is likely due to a resource being occupied or a residual resource, which causes the component installation to fail.
Solution
On the Clusters page, click the name of the target cluster. In the navigation pane on the left of the cluster details page, choose .
On the Helm page, verify that ack-arms-prometheus exists.
Delete ack-arms-prometheus from the Helm page and then reinstall it on the Add-ons page. For more information, see Manage components.
Not found:
If
ack-arms-prometheusis not found, it indicates that residual resources remain from the deletion of theack-arms-prometheusHelm Release. You must then manually and completely delete ARMS-Prometheus.
The ack-arms-prometheus component fails to be installed after a "Component Not Installed" message is displayed
Symptoms
When you try to install the ack-arms-prometheus component, a "Component Not Installed" message appears first, and the installation still fails on the second attempt.
Solution
Check whether the ack-arms-prometheus component is already installed.
On the Clusters page, click the name of the target cluster. In the navigation pane on the left of the cluster details page, choose .
On the Helm page, verify that ack-arms-prometheus exists.
Delete ack-arms-prometheus from the Helm page and then reinstall it on the Add-ons page. For more information, see Manage components.
Not found:
If
ack-arms-prometheusis not found, it indicates that residual resources remain from the deletion of theack-arms-prometheusHelm Release. You must then manually and completely delete ARMS-Prometheus.
Check the logs of ack-arms-prometheus for errors.
In the navigation pane on the left of the cluster details page, choose .
At the top of the Deployments page, set Namespace to arms-prom and click arms-prometheus-ack-arms-prometheus.
Click the Logs tab and check the logs for errors.
Check whether an error occurred during the agent installation.
Log on to the ARMS console. In the navigation pane on the left, click Integration Management.
On the Integration Management tab, find the target container environment in the Container Service list. In the Actions column, click Configure Agent to open the Configure Agent page.
Open source Prometheus monitoring
How do I configure DingTalk alert notifications?
Symptoms
After you deploy open source Prometheus, you must configure it to send alert notifications using DingTalk.
Solution
Obtain the webhook URL of your DingTalk chatbot. For more information, see Scenario 3: Implement Kubernetes monitoring and alerting with DingTalk chatbot.
On the Parameters wizard page, find the dingtalk section, set enabled to true, and then specify the webhook URL of your DingTalk chatbot in the token field. For more information, see Configure DingTalk alert notifications in Alert configurations.
An error occurs when deploying prometheus-operator
Symptoms
Can't install release with errors: rpc error: code = Unknown desc = object is being deleted: customresourcedefinitions.apiextensions.k8s.io "xxxxxxxx.monitoring.coreos.com" already existsSolution
The error message indicates that the cluster fails to clear custom resource definition (CRD) objects of the previous deployment. Run the following commands to delete the CRD objects. Then, deploy prometheus-operator again:
kubectl delete crd prometheuses.monitoring.coreos.com
kubectl delete crd prometheusrules.monitoring.coreos.com
kubectl delete crd servicemonitors.monitoring.coreos.com
kubectl delete crd alertmanagers.monitoring.coreos.com
Email alerts are not working
Symptoms
After you deploy open source Prometheus, the email alerts that you configured do not send alert notifications.
Solution
Make sure that the value of smtp_auth_password is the SMTP authorization code instead of the logon password of the email account. Make sure that the SMTP server endpoint includes a port number.
The error message "The cluster is inaccessible. Try again later or submit a ticket." appears when I click Update YAML
Symptoms
After you deploy open source Prometheus, when you click Update YAML, the error message "The current cluster is temporarily inaccessible. Please try again later or submit a ticket for feedback" appears.
Solution
If the configuration file of Tiller is overlarge, the cluster cannot be accessed. To solve this issue, you can delete some annotations in the configuration file and mount the file to a pod as a ConfigMap. You can specify the name of the ConfigMap in the configMaps fields of the prometheus and alertmanager sections. For more information, see the second method in Mount a ConfigMap to Prometheus.
How do I enable features after deploying prometheus-operator?
Symptoms
After you deploy open source Prometheus, you may need to perform further configuration to enable its features.
Solution
After prometheus-operator is deployed, you can perform the following steps to enable the features of prometheus-operator. Go to the cluster details page and choose in the left-side navigation pane. On the Helm page, find ack-prometheus-operator and click Update in the Actions column. In Update Release panel, configure the code block to enable the features. Then, click OK.
How do I choose between TSDB and Alibaba Cloud disks?
Symptoms
When choosing a storage solution, how do I choose between TSDB and Alibaba Cloud disks, and how do I configure the data retention policy?
Solution
TSDB storage is available to limited regions. However, disk storage is supported in all regions. The following figure shows how to configure the data retention policy.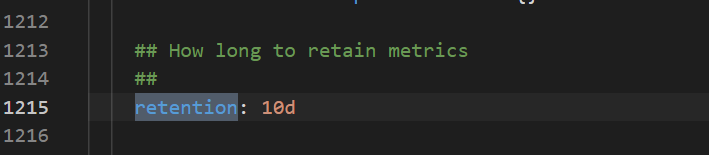
The Grafana dashboard is not displayed correctly
Symptoms
After you deploy open source Prometheus, the Grafana dashboard is not displayed correctly.
Solution
Go to the cluster details page and choose in the left-side navigation pane. On the Helm page, find ack-prometheus-operator and click Update in the Actions column. In the Update Release panel, check whether the value of the clusterVersion field is correct. If the Kubernetes version of your cluster is earlier than 1.16, set clusterVersion to 1.14.8-aliyun.1. If the Kubernetes version of your cluster is 1.16 or later, set clusterVersion to 1.16.6-aliyun.1.
ack-prometheus-operator fails to be reinstalled after its namespace is deleted
Cause
After you delete the ack-prometheus namespace, the related resource configurations may be retained. In this case, you may fail to install ack-prometheus again. You can perform the following operations to delete the related resource configurations:
Solution
Delete role-based access control (RBAC)-related resource configurations.
Run the following commands to delete the related ClusterRoles:
kubectl delete ClusterRole ack-prometheus-operator-grafana-clusterrole
kubectl delete ClusterRole ack-prometheus-operator-kube-state-metrics
kubectl delete ClusterRole psp-ack-prometheus-operator-kube-state-metrics
kubectl delete ClusterRole psp-ack-prometheus-operator-prometheus-node-exporter
kubectl delete ClusterRole ack-prometheus-operator-operator
kubectl delete ClusterRole ack-prometheus-operator-operator-psp
kubectl delete ClusterRole ack-prometheus-operator-prometheus
kubectl delete ClusterRole ack-prometheus-operator-prometheus-psp
Run the following commands to delete the related ClusterRoleBindings:
kubectl delete ClusterRoleBinding ack-prometheus-operator-grafana-clusterrolebinding
kubectl delete ClusterRoleBinding ack-prometheus-operator-kube-state-metrics
kubectl delete ClusterRoleBinding psp-ack-prometheus-operator-kube-state-metrics
kubectl delete ClusterRoleBinding psp-ack-prometheus-operator-prometheus-node-exporter
kubectl delete ClusterRoleBinding ack-prometheus-operator-operator
kubectl delete ClusterRoleBinding ack-prometheus-operator-operator-psp
kubectl delete ClusterRoleBinding ack-prometheus-operator-prometheus
kubectl delete ClusterRoleBinding ack-prometheus-operator-prometheus-psp
Run the following command to delete the related CRD objects:
kubectl delete crd alertmanagerconfigs.monitoring.coreos.com
kubectl delete crd alertmanagers.monitoring.coreos.com
kubectl delete crd podmonitors.monitoring.coreos.com
kubectl delete crd probes.monitoring.coreos.com
kubectl delete crd prometheuses.monitoring.coreos.com
kubectl delete crd prometheusrules.monitoring.coreos.com
kubectl delete crd servicemonitors.monitoring.coreos.com
kubectl delete crd thanosrulers.monitoring.coreos.com
Alert management
An alert rule fails to sync and the error message "The Project does not exist : k8s-log-xxx" is reported
Symptoms
In the Alert Center, the alert rule synchronization status shows the message The Project does not exist : k8s-log-xxx.
Cause
SLS Event Center resources have not been created.
Solution
In the Simple Log Service console, confirm whether the quota limit has been reached. For more information about resources, see Basic resource limits.
If the quota limit has been reached, delete unnecessary projects, or submit a ticket to apply for an increase in the project resource quota limit. For information about how to delete a project, see Manage a project.
If the limit has not been reached, proceed with the following steps.
Reinstall the ack-node-problem-detector component.
Reinstalling the component recreates the default project named k8s-log-xxxxxx.
Uninstall the ack-node-problem-detector component.
On the management page of the target cluster in the Container Service for Kubernetes console, in the left navigation pane, choose .
Click the Logs and Monitoring tab. Then, click Uninstall on the ack-node-problem-detector component card and click Confirm in the dialog box.
After the uninstallation is complete, install the ack-node-problem-detector component.
In the left navigation pane, choose
On the Alert Rules page, click Start Installation. The console automatically creates a project, and installs and upgrades the component.
On the Alert Rules page, disable the corresponding alert rule set. Wait until its Alert Rule Status changes to Rule Disabled, and then re-enable the rule set to retry.
An alert rule fails to sync and an error message this rule have no xxx contact groups reference is reported
Symptom
An alert rule fails to sync during configuration or deployment, and the system displays an error message such as this rule have no xxx contact groups reference. As a result, notifications for this alert rule are not delivered.
Cause
The alert rule synchronization fails, and an error message similar to this rule have no xxx contact groups reference is reported.
Solution
You have created a contact and added it to a contact group.
To the right of the target alert rule set, click Edit Notification Policy to configure which contact groups subscribe to the alert rule set.
Other issues
Why is no data returned for kubectl top pod/node?
Symptom
When you run kubectl top pod or kubectl top node in the command line, no data is returned.
Solution
Run the following command to check whether the metrics-server API Service is normal.
kubectl get apiservices | grep metrics-server
If the returned result for
v1beta1.metrics.k8s.ioshowsTrue, the metrics-server API Service is normal.Optional: If the metrics-server API Service is not normal, run the following commands on a cluster node to check whether ports 443 and 8082 of the metrics-server can be accessed normally within the cluster.
curl -v <metrics-server_Pod_IP>:8082/apis/metrics/v1alpha1/nodes

curl -v <metrics-server_Pod_IP>:443/apis/metrics/v1alpha1/nodes
If the commands return data normally, ports 443 and 8082 of the metrics-server can be accessed normally within the cluster.
Optional: If ports 443 and 8082 of the metrics-server cannot be accessed normally within the cluster, restart the metrics-server.
You can restart the metrics-server by deleting its pod.
Log in to the Container Service for Kubernetes console. In the navigation pane on the left, choose Clusters.
On the Clusters page, click the name of the target cluster. In the navigation pane on the left, choose .
At the top of the Stateless page, set Namespace to `kube-system` and click `metrics-server`.
On the Pods tab, in the Actions column for the metrics-server pod, choose More > Delete, and then click OK in the dialog box.
Why is partial data missing for kubectl top pod/node?
Symptoms
When you run kubectl top pod or kubectl top node, some data is missing.
Solution
Perform the following prechecks.
Check whether all pods on a specific node have no data, or whether a specific pod has no data. If all pods on a specific node have no data, check whether the node has time zone drift. You can use the
datecommand on an NTP server to verify the time zone.Check the network connectivity from the metrics-server pod to port 10255 of the specific node.
What do I do if HPA cannot obtain metrics data?
Symptoms
When you use the Kubernetes Horizontal Pod Autoscaler (HPA), you may encounter a situation where it cannot obtain metrics data.
Solution
Perform the following prechecks.
Check the result of running kubectl top pod for the corresponding pod. If the data is abnormal, see the check methods in Why is no data returned for kubectl top pod/node? and Why is partial data missing for kubectl top pod/node?
Why does HPA create extra pods during a rolling deployment?
Symptom
During a Kubernetes rolling update, you may find that the Horizontal Pod Autoscaler (HPA) unexpectedly starts extra pods.
Solution
Perform the following prechecks.
Check whether the metrics-server has been upgraded to the latest version. If the version is correct, use the kubectl edit deployments -n kube-system metrics-server command to add the following startup parameters in the command section.
--metric-resolution=15s
--enable-hpa-rolling-update-skipped=true