Event monitoring complements resource monitoring by providing better real-time responsiveness, accuracy, and scenario coverage. — for example, when a pod is evicted, an image pull fails, or a node reports a hardware exception. Kubernetes retains these events for only one hour by default. To detect anomalies before data expires, ACK provides end-to-end event monitoring that collects, stores, alerts on, and archives cluster events.
ACK sinks cluster events to Simple Log Service by default and stores them free for 90 days. See Create and use an event center.
How it works
ACK uses two open-source tools:
node-problem-detector (NPD) — Diagnoses Kubernetes nodes. NPD detects node exceptions such as Docker engine hangs, Linux kernel hangs, outbound traffic exceptions, and file descriptor exceptions, generates node events, and works with kube-eventer to close the alert management loop. See NPD.
kube-eventer — ACK-maintained open-source event emitter. kube-eventer forwards Kubernetes events to sinks such as DingTalk, Simple Log Service, and EventBridge, filters events by severity level, and enables real-time collection, alerting, and asynchronous archiving. See kube-eventer.

Kubernetes emits two event types:
Type | When generated | Examples |
Normal | State machine transitions to an expected state | Pod scheduled, container started |
Warning | State machine transitions to an unexpected state | Pod evicted, image pull failed, |
Use cases
Select a scenario based on your monitoring needs:
Scenario | When to use |
Scenario 1: Use NPD with the Simple Log Service event center | Get started quickly. Sink all cluster events to Simple Log Service for visualization, querying, and alerting in one place. |
Detect node-level exceptions such as disk pressure, network issues, and Docker daemon failures, and trigger closed-loop alert management. | |
Route Warning events to a DingTalk group for real-time ChatOps notifications. | |
Persist Kubernetes events in a dedicated Logstore for long-term storage, indexing, and offline analysis. | |
Build an event-driven architecture to trigger automated remediation or downstream workflows from cluster events. |
Scenario 1: Use NPD with the Simple Log Service event center
NPD works with third-party plug-ins to detect node exceptions and generate cluster events. The Simple Log Service event center collects, stores, and visualizes these events with built-in querying and alerting.
Step 1: Install the ack-node-problem-detector component
If you selected Install node-problem-detector and Create Event Center when creating the cluster, skip to Step 2: View the event center. To install during cluster creation, see Create an ACK managed cluster.
Otherwise, install the component manually:
Log on to the ACK console. In the left-side navigation pane, choose Clusters.
On the Clusters page, find the cluster and click its name. In the left-side navigation pane, click Add-ons.
On the Observability tab, find and install ack-node-problem-detector.
Step 2: View the event center
Log on to the ACK console. In the left-side navigation pane, choose Clusters.
On the Clusters page, find the cluster and click its name. In the left-side navigation pane, choose Operations > Event Center.
On the Event Center page, click the Event Overview (Event Center) tab to view all Kubernetes events, their details, and the pod lifecycle. See Collect Kubernetes events.
Scenario 2: Run NPD node diagnosis
NPD with kube-eventer provides closed-loop alert management for node events. When NPD detects an exception, kube-eventer forwards the event to configured sinks and raises an alert.
Prerequisites
Before you begin:
ack-node-problem-detector is installed. If not, see Step 1: Install the ack-node-problem-detector component. If already installed, reinstall first — see Reinstall the ack-node-problem-detector component.
Verify the DaemonSet is running
On the Clusters page, find the cluster and click its name. In the left-side navigation pane, choose Workloads > DaemonSets.
On the DaemonSets tab, select the kube-system namespace and verify that ack-node-problem-detector-daemonset is running. When NPD and kube-eventer are running, the system sinks events and raises alerts per the kube-eventer configuration.
Node diagnosis plug-ins
Starting from NPD 1.2.29, the GPU anomaly detection plugin is deployed as a separate DaemonSet named ack-accel-health-monitor.
Plug-in | What it checks | Default threshold | Enabled by default |
| Whether system clocks are synchronized via Network Time Protocol (NTP) | — | Yes |
| Whether connection tracking (conntrack) table usage exceeds the threshold | 90% | Yes |
| Whether inode usage on the system disk exceeds the threshold (adjustable) | 80% | Yes |
| Whether the PID process ratio exceeds the kernel maximum threshold | 85% | Yes |
| Whether the Docker daemon is running | — | Yes |
| Whether file descriptor usage exceeds the threshold (adjustable). Note This plug-in consumes significant resources. Enable only when needed. | 80% | No |
| Whether nodes have the required RAM role and AccessKey ID/secret configured | — | No |
| Whether NVIDIA GPUs can generate | — | No |
| Whether the Container Storage Interface (CSI) plug-in is running | — | No |
| Whether processes in the uninterruptible sleep (D) state exist | — | No |
| Whether nodes can access the Internet | — | No |
| Whether the | — | No |
Scenario 3: Send alerts to DingTalk
A DingTalk chatbot receiving Kubernetes event alerts is a typical ChatOps pattern. When a Warning-level event occurs, kube-eventer pushes a message to the DingTalk group via webhook.
Prerequisites
Before you begin:
ack-node-problem-detector is installed. If not, see Step 1: Install the ack-node-problem-detector component. If already installed, reinstall first — see Reinstall the ack-node-problem-detector component.
Step 1: Add a DingTalk chatbot
Click
 in the upper-right corner of the chatbox to open Group Settings.
Click Bot > Add Robot. Select Custom as the chatbot type.
On the Robot details page, click Add to open the Add Robot page. Set the parameters below, accept the DingTalk Custom Robot Service Terms of Service, and click Finished:
Parameter
Description
Edit profile picture
Chatbot avatar. Optional.
Chatbot name
Chatbot display name.
Add to Group
DingTalk group to add the chatbot to.
Security settings
Three options: Custom Keywords, additional signatures, and IP addresses (or CIDR blocks). Only Custom Keywords filter cluster event alerts. Select Custom Keywords and enter
Warning. Add up to 10 keywords to narrow the filter.Click Copy to copy the webhook URL.
On the ChatBot page, click
 next to the chatbot to modify its avatar and name, enable or disable message push, reset the webhook URL, or remove the chatbot.
Step 2: Configure kube-eventer to send events to DingTalk
On the Clusters page, find the cluster and click its name. In the left-side navigation pane, choose Applications > Helm.
On the Helm page, find ack-node-problem-detector and click Update in the Actions column.
Set the parameters below, then click OK:
In the
npdsection, setenabledtofalse.Set
eventer.sinks.dingtalk.enabledtotrue.Enter the token from the copied webhook URL.
Result
kube-eventer takes effect 30 seconds after deployment. Warning-level events trigger alerts in the DingTalk group.
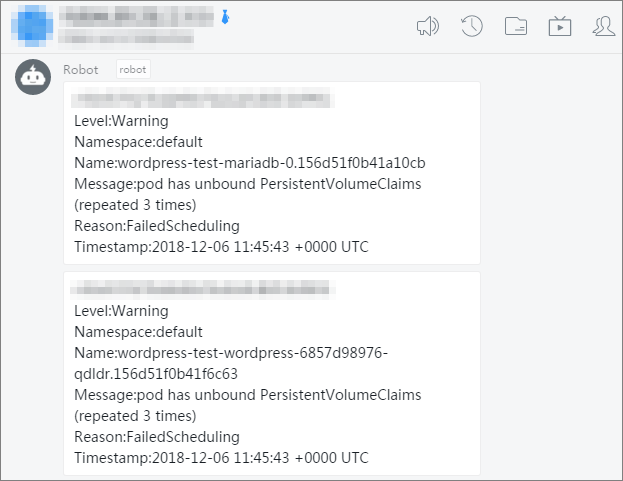
Scenario 4: Archive events to Simple Log Service
Sink Kubernetes events to Simple Log Service for persistent storage, indexing, and audit. For long-term retention or offline archiving, configure the Logstore and optional data shipping to MaxCompute or Object Storage Service (OSS). See Create and use an event center.
Prerequisites
Before you begin:
ack-node-problem-detector is installed with the project and Logstore specified. If already installed, reinstall first — see Reinstall the ack-node-problem-detector component.
Step 1: Create a Simple Log Service project and Logstore
Log on to the Simple Log Service console.
In the Projects section, click Create Project. In the Create Project panel, set the parameters and click Create.
Create the Simple Log Service project in the same region as your cluster. Same-region transmission uses the internal network, which reduces latency and eliminates cross-region bandwidth costs. This example creates a project named
k8s-log4jin China (Hangzhou).In the Projects section, click k8s-log4j to open the project details page.
In the Logstores pane, click + to open the Create Logstore panel.
Set the parameters and click OK. This example creates a Logstore named
k8s-logstore.In the Create Logstore panel, the key configuration items include:
Logstore Type: Standard
Data Retention Period: 30 days (fixed number of days)
Number of Shards: 2
Automatic Shard Split: enabled, with a maximum of 64 splits
Record Public IP: enabled
WebTracking: disabled by default
After the Logstore is created, click Data Import Wizard to open the Import Data dialog box.
Select Log4j 1/2 and complete the configuration. This example uses default settings.
In the Log Description area of the data source configuration page, Log4j is described as consisting of three components: priority levels (ERROR, WARN, INFO, DEBUG), output destination, and output format. The Alibaba Cloud Log Log4j Appender can output logs to Simple Log Service (SLS) (for the download address and usage instructions, refer to GitHub). In the Usage Notes area, click the View Help link to obtain detailed ingestion guidance, and then click Next.
Step 2: Configure kube-eventer to sink events to Simple Log Service
On the Clusters page, find the cluster and click its name. In the left-side navigation pane, choose Applications > Helm.
On the Helm page, find ack-node-problem-detector and click Update in the Actions column.
Set the parameters below, then click OK:
In the
npdsection, setenabledtofalse.Set
eventer.sinks.sls.enabledtotrue.
Step 3: Verify event collection and set up indexing
Trigger a cluster event — for example, delete a pod or create an application.
Log on to the Simple Log Service console to view collected events. See Consume log data by using Simple Log Service SDK.
In the Consumption Preview dialog box, select an index name (for example,
k8s-event), set the Shard and the time range, and then click Preview. If the log data is uploaded successfully, the table displays JSON-formatted logging records of Kubernetes events, including fields such aslevel,eventId,namespace,reason, andmessage.Set up indexing for query and analysis. See Create indexes.
In the Projects section, click the project name.
Click
 next to the Logstore name and select Search & Analysis.
In the upper-right corner, click Enable Index.
In the Search & Analysis panel, set the parameters and click OK. > Note: Index configuration takes effect within 1 minute and applies only to data ingested after the index is enabled or modified.
(Optional) To archive events for offline analysis, ship data from the Logstore to MaxCompute or Object Storage Service (OSS). See Create a data shipping job of the new version to ship data to MaxCompute and Create an OSS data shipping job (new version).
Scenario 5: Route events to EventBridge
EventBridge is a serverless event service that connects Alibaba Cloud services, custom applications, and software as a service (SaaS) applications in a standardized, centralized way. Routing ACK events to EventBridge lets you build a loosely coupled, event-driven architecture — for example, to trigger automated remediation when specific events occur. See What is EventBridge?.
Prerequisites
Before you begin:
EventBridge is activated. See Activate EventBridge and grant permissions to a RAM user.
ack-node-problem-detector is installed. If not, see Step 1: Install the ack-node-problem-detector component. If already installed, reinstall first — see Reinstall the ack-node-problem-detector component.
Enable EventBridge as an event sink
On the Clusters page, find the cluster and click its name. In the left-side navigation pane, choose Applications > Helm.
On the Helm page, find ack-node-problem-detector and click Update in the Actions column.
Set
eventer.sinks.eventbridge.enabledtotrue, then click OK.eventer: accessKeyId: "" accessKeySecret: "" enabled: true env: - TZ: Asia/Shanghai image: pullPolicy: Always repository: registry-cn-hangzhou-vpc.ack.aliyuncs.com/acs/kube-eventer tag: v1.2.11-0620284-aliyun othersinks: null resources: limits: cpu: "1.0" memory: 1024Mi requests: cpu: 100m memory: 200Mi sinks: dingtalk: enabled: false label: "" level: Warning monitorkinds: Node,Pod monitornamespaces: "" token: "" eventbridge: enabled: false
View Kubernetes events in EventBridge
Log on to the EventBridge console.
In the left-side navigation pane, click Event Buses.
On the Event Buses page, click the target event bus.
In the left-side navigation pane, click Event Tracking.
Select a query method, set conditions, and click Query.
Find the event and click Details in the Actions column. See Query events by event ID.
Reinstall the ack-node-problem-detector component
Reinstall the component when you change the sink target (for example, from Simple Log Service to DingTalk) or update the component configuration.
Log on to the ACK console. In the left-side navigation pane, choose Clusters.
On the Clusters page, find the cluster and click its name. In the left-side navigation pane, choose Workloads > Jobs.
On the Jobs page, click More next to
kube-eventer-init-v1.7-xxxxand click Delete.On the Clusters page, find the cluster and click its name. In the left-side navigation pane, choose Applications > Helm.
On the Helm page, delete the ack-node-problem-detector component.
On the Clusters page, find the cluster and click its name. In the left-side navigation pane, choose Operations > Add-ons.
On the Observability tab, find and reinstall ack-node-problem-detector.