Deploy open source Prometheus in a Container Service for Kubernetes (ACK) cluster to collect metrics from cluster components, workloads, and custom applications. This guide covers deploying the ack-prometheus-operator Helm chart, accessing Prometheus and Grafana dashboards, configuring alert notifications, and cleaning up the installation.
What you can monitor
| Category | Examples | How monitoring is configured |
|---|---|---|
| Cluster components | API server, cloud-controller-manager, etcd | Configuration files |
| Static resource entities | Node resource status, kernel events | Configuration files |
| Dynamic resource entities | Deployments, DaemonSets, pods | Deploy Prometheus in the cluster |
| Custom application metrics | Port-level metrics, online user count | Port exposure + Prometheus |
Prerequisites
Before you begin, make sure you have:
An ACK cluster with sufficient permissions to deploy Helm charts and modify Services
Access to the ACK console
Deploy open source Prometheus
Log on to the ACK console. In the left navigation pane, click Clusters.
Click the name of the target cluster. In the left navigation pane, choose Applications > Helm.
On the Helm page, click Deploy. In the Chart section of the Deploy panel, find and select ack-prometheus-operator, use the default values for other parameters, and click Next. By default, the chart installs in the monitoring namespace with the chart's default application name. To use a custom name or namespace, configure Application Name and Namespace in the Basic Information step.
On the Parameters page, select 12.0.0 as the chart version, then click OK. Chart 12.0.0 supports alert configuration through built-in functions. The following optional parameters are available:
Alert configuration: Send alert notifications via DingTalk messages or email. See Alert configurations.
Mount a custom ConfigMap to Prometheus: Mount a custom ConfigMap based on your requirements. See Mount a custom ConfigMap to Prometheus.
Mount a dashboard file to Grafana: Use custom dashboards for data visualization. See Configure Grafana.
After deployment, check the application status on the Helm page.
View Prometheus collection tasks
Expose the Prometheus Service to access the Prometheus UI and verify that data collection tasks are running.
Creating a Server Load Balancer (SLB) instance incurs charges. See Classic Load Balancer (CLB) billing for details.
Log on to the ACK console. In the left navigation pane, click Clusters.
Click the name of the target cluster. In the left navigation pane, choose Network > Services.
On the Services page, select the namespace where
ack-prometheus-operatoris deployed (monitoring by default). Find ack-prometheus-operator-prometheus and click Update in the Actions column.In the Update Service dialog box, set the following parameters and click OK:
Parameter Value Service Type SLB Create Resource Select Create Resource Access Method Public Access Billing Method Pay-as-you-go After the update completes, copy the external IP address. Access Prometheus by entering
<IP address>:9090in your browser. Example:47.XX.XX.12:9090.In the Prometheus top navigation bar, choose Status > Targets to see all data collection tasks. Tasks in the UP state are running properly.

To view alert rules, click Alerts in the top navigation bar.

View Grafana aggregated data
Expose the Grafana Service to access the Grafana dashboard.
Creating an SLB instance incurs charges. See CLB billing for details.
Log on to the ACK console. In the left navigation pane, click Clusters.
Click the name of the target cluster. In the left navigation pane, choose Network > Services.
On the Services page, select the namespace where
ack-prometheus-operatoris deployed (monitoring by default). Find ack-prometheus-operator-grafana and click Update in the Actions column.In the Update Service dialog box, set the following parameters and click OK:
Parameter Value Service Type SLB Create Resource Select Create Resource Access Method Public Access Billing Method Pay-as-you-go (Pay-by-CU) After the update completes, copy the external IP address. Access Grafana by entering
<IP address>:80in your browser (default port is 80). Example:47.XX.XX.12:80.
Alert configurations
Configure prometheus-operator to send alert notifications via DingTalk messages or email.
Log on to the ACK console. In the left navigation pane, click Clusters.
Click the name of the target cluster. In the left navigation pane, choose Applications > Helm.
Configure alert parameters using one of the following methods:
New installation: Click Deploy, select ack-prometheus-operator in the Chart section, click Next, then proceed to the Parameters step.
Existing installation: Click the name of the
ack-prometheus-operatorrelease in the list, then click the Parameters tab.
Configure the alert parameters based on your notification method:
Configure DingTalk notifications
In the configuration file, find the
dingtalkfield and setenabledtotrue.Enter your DingTalk chatbot webhook URL in the
tokenfield. For instructions on getting the webhook URL, see Implement Kubernetes monitoring and alerting with DingTalk chatbot.In the
alertmanagersection, find thereceiverparameter in theconfigfield and enter the DingTalk chatbot name defined in thereceiversfield. The default value iswebhook.
Configure multiple DingTalk chatbots
If you have two DingTalk chatbots:
In the
tokenfield, replace the placeholder webhook URLs (for example,https://oapi.dingtalk.com/robot/send?access_token=xxxxxxxxxx) with the actual addresses ofdingtalk1anddingtalk2.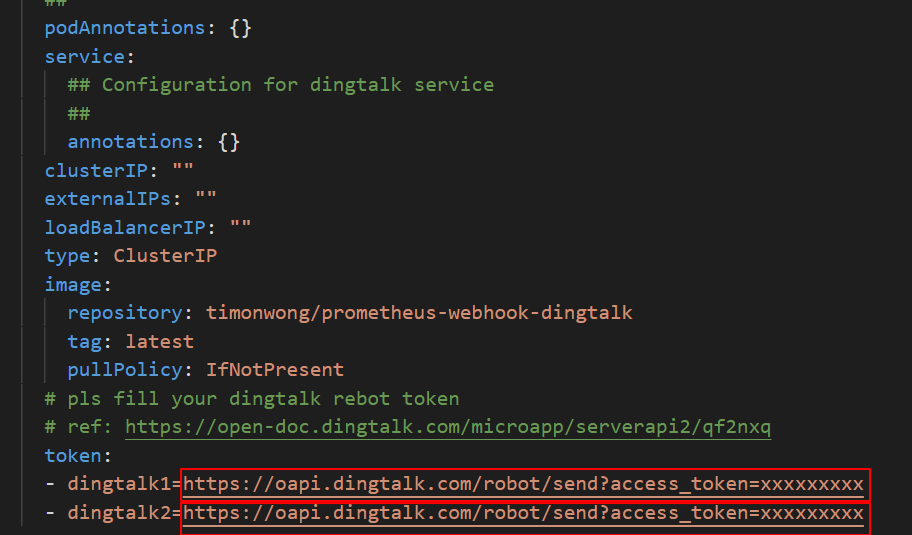
In the
alertmanagersection, find thereceiverparameter in theconfigfield and enter the chatbot names defined in thereceiversfield — for example,webhook1andwebhook2.Replace the value of the
urlparameter with your chatbot names — for example,dingtalk1anddingtalk2.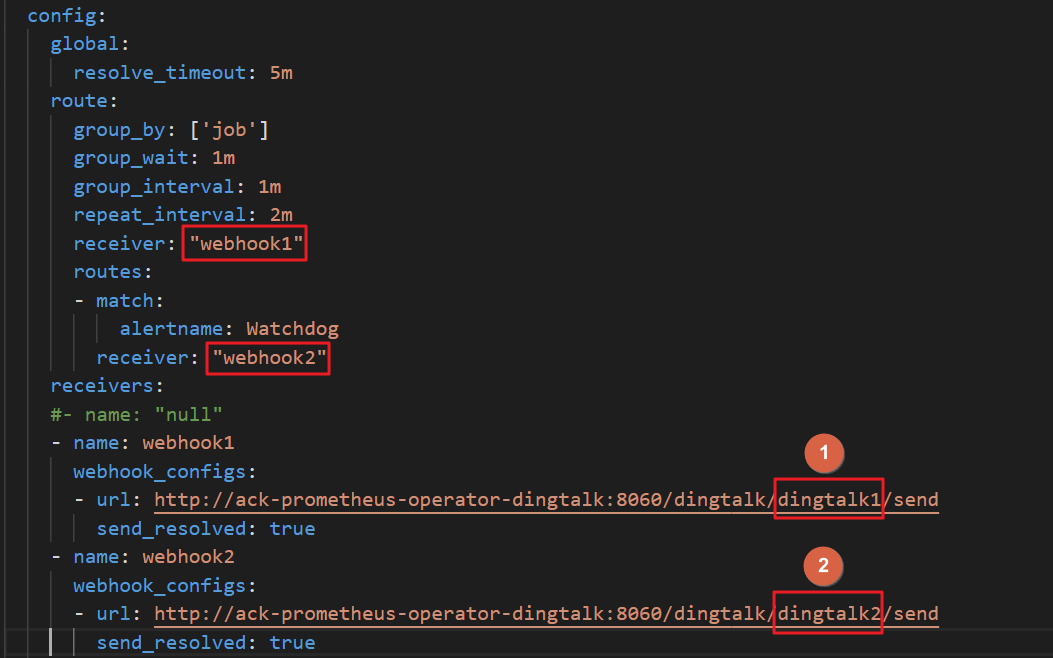
To add more DingTalk chatbots, add more webhook URLs.
Configure email notifications
Enter your email address details in the email configuration fields.
In the
alertmanagersection, find thereceiverparameter in theconfigfield and enter the email receiver name defined in thereceiversfield. The default value ismail.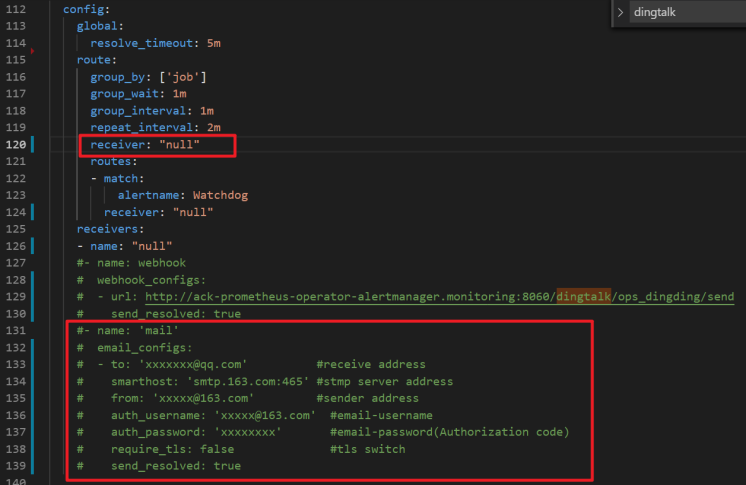
Set alert notification templates
Customize alert notification templates in the
templateFilesfield of thealertmanagersection.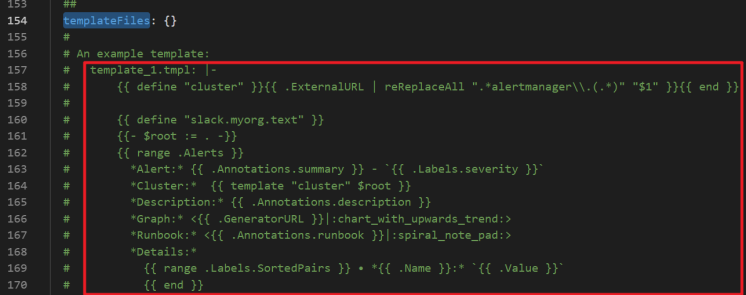
Suppress alerts
Silence specific alerts by configuring silence rules in Alertmanager. When an alert matches a silence rule, notifications are withheld until the silence period ends or you delete the rule.
Run the following command to forward the Alertmanager Service to local port 9093:
kubectl --address 0.0.0.0 port-forward svc/alertmanager-operated 9093 -n monitoringAssociate an Elastic IP address (EIP) with your ECS instance, then access Alertmanager at
<EIP>:9093in your browser.Make sure your ECS security group allows traffic from your local IP on port 9093. See Add a security group rule.
Click Silence and follow the on-screen instructions to configure alert suppression.

Mount a custom ConfigMap to Prometheus
Mount a custom configuration file to Prometheus via a ConfigMap. The ConfigMap is passed to Prometheus using the --config.file parameter at pod startup.
Create a ConfigMap named
special-config:apiVersion: v1 kind: ConfigMap metadata: name: special-config data: config.yaml: |- global: # The scrape interval. Default: 1m [ scrape_interval: <duration> | default = 1m ] # The scrape timeout. Default: 10s [ scrape_timeout: <duration> | default = 10s ] # The rule evaluation interval. Default: 1m [ evaluation_interval: <duration> | default = 1m ] # Scrape configurations scrape_configs: [ - <scrape_config> ... ] # Rule configurations rule_files: [ - <filepath_glob> ... ] # Alert configurations alerting: alert_relabel_configs: [ - <relabel_config> ... ] alertmanagers: [ - <alertmanager_config> ... ]In the Parameters step, add the ConfigMap to the
configmapsfield. This mountsspecial-configto/etc/prometheus/configmaps/in the Prometheus pod. The following figure shows the sample configuration of theconfigmapsfield in theprometheussection: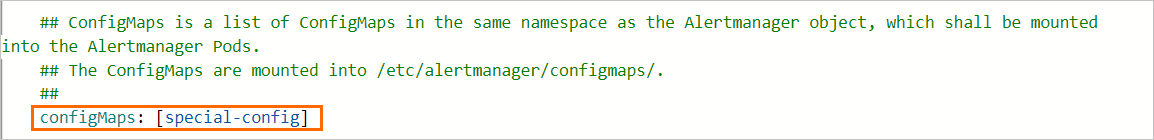

Configure Grafana
Mount dashboard configuration files to Grafana
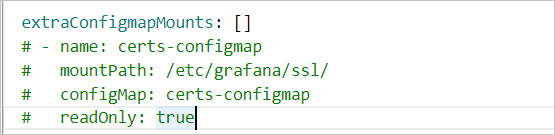
Mount dashboard files into the Grafana pod via ConfigMap using the extraConfigmapMounts field in the parameter configuration wizard.
Before mounting, make sure that:
The dashboard exists in the cluster as a ConfigMap, and the ConfigMap labels match the format of other ConfigMaps.
The
extraConfigmapMountsfield includes the following details:Field Value mountPath/tmp/dashboards/ConfigMapName of your custom ConfigMap nameName of the JSON file storing the dashboard configuration
Enable data persistence for dashboards
To keep dashboard configurations across pod restarts, export the dashboard as a JSON file and configure persistence.
In Grafana, export the target dashboard as a JSON file. See Export a dashboard as JSON.
Log on to the ACK console. In the left navigation pane, click Clusters.
Click the name of the target cluster. In the left navigation pane, choose Applications > Helm.
Find
ack-prometheus-operator, click Update in the Actions column, and configure thepersistencefield in thegrafanasection.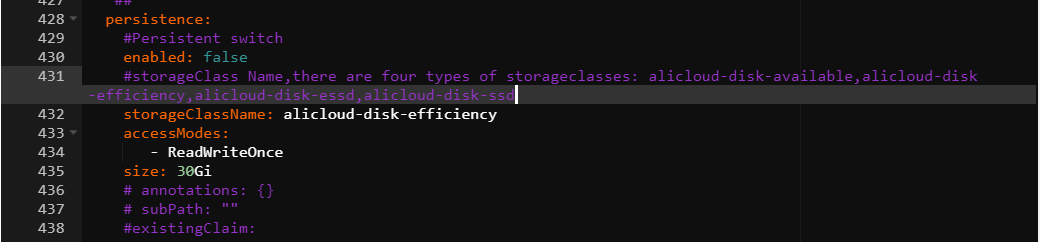
Uninstall the open source Prometheus component
Uninstall ack-prometheus-operator by removing the Helm release, namespace, CustomResourceDefinitions (CRDs), and the kubelet Service in sequence.
Helm does not automatically delete CRDs or the kubelet Service during uninstallation. Delete them manually to prevent residual resources from causing errors on reinstallation. If the kubelet Service cannot be deleted automatically, see GitHub issue #1523 for details.
First, check the Helm chart version of your installation, then follow the steps for your version.
Chart v12.0.0
Use the ACK console
Log on to the ACK console. In the left navigation pane, click Clusters.
Click the name of the target cluster. In the left navigation pane, perform the following operations in order:
Uninstall the Helm release: Choose Applications > Helm. Find the
ack-prometheus-operatorrelease and click Delete in the Actions column. In the Delete dialog box, select Clear Release Records and click OK.Delete the namespace: Click Namespaces and Quotas. Select the monitoring namespace, click Delete, confirm the information, and click Confirm Deletion.
Delete the CRDs: Choose Workloads > Custom Resources. Click the CRDs tab, select all CRDs in the
monitoring.coreos.comAPI group, click Delete, and then click Confirm Deletion. The CRDs in this group are:AlertmanagerConfig
Alertmanager
PodMonitor
Probe
Prometheus
PrometheusRule
ServiceMonitor
ThanosRuler
Delete the kubelet Service: Choose Network > Services. Select the
ack-prometheus-operator-kubeletService in thekube-systemnamespace, click Delete, and then click Confirm Deletion.
Use kubectl
# Uninstall the Helm release
helm uninstall ack-prometheus-operator -n monitoring

# Delete the namespace
kubectl delete namespace monitoring

# Delete the CRDs
kubectl delete crd alertmanagerconfigs.monitoring.coreos.com
kubectl delete crd alertmanagers.monitoring.coreos.com
kubectl delete crd podmonitors.monitoring.coreos.com
kubectl delete crd probes.monitoring.coreos.com
kubectl delete crd prometheuses.monitoring.coreos.com
kubectl delete crd prometheusrules.monitoring.coreos.com
kubectl delete crd servicemonitors.monitoring.coreos.com
kubectl delete crd thanosrulers.monitoring.coreos.com

# Delete the kubelet Service
kubectl delete service ack-prometheus-operator-kubelet -n kube-system
Chart v65.1.1
Use the ACK console
Log on to the ACK console. In the left navigation pane, click Clusters.
Click the name of the target cluster. In the left navigation pane, perform the following operations in order:
Uninstall the Helm release: Choose Applications > Helm. Select the
ack-prometheus-operatorrelease and click Delete in the Actions column. In the Delete dialog box, select Clear Release Records and click OK.Delete the namespace: Click Namespaces and Quotas. Select the monitoring namespace, click Delete, confirm the information, and click Confirm Deletion.
Delete the CRDs: Choose Workloads > Custom Resources. Click the CRD tab, select all CRDs in the
monitoring.coreos.comAPI group, click Delete, and then click Confirm Deletion. The CRDs in this group are:AlertmanagerConfig
Alertmanager
PodMonitor
Probe
PrometheusAgent
Prometheus
PrometheusRule
ScrapeConfig
ServiceMonitor
ThanosRuler
Delete the kubelet Service: Choose Network > Services. Select the
ack-prometheus-operator-kubeletService in thekube-systemnamespace, click Delete, and then click Confirm Deletion.
kubectl
# Uninstall the Helm release
helm uninstall ack-prometheus-operator -n monitoring

# Delete the namespace
kubectl delete namespace monitoring

# Delete the CRDs
kubectl delete crd alertmanagerconfigs.monitoring.coreos.com
kubectl delete crd alertmanagers.monitoring.coreos.com
kubectl delete crd podmonitors.monitoring.coreos.com
kubectl delete crd probes.monitoring.coreos.com
kubectl delete crd prometheusagents.monitoring.coreos.com
kubectl delete crd prometheuses.monitoring.coreos.com
kubectl delete crd prometheusrules.monitoring.coreos.com
kubectl delete crd scrapeconfigs.monitoring.coreos.com
kubectl delete crd servicemonitors.monitoring.coreos.com
kubectl delete crd thanosrulers.monitoring.coreos.com

# Delete the kubelet Service
kubectl delete service ack-prometheus-operator-kubelet -n kube-system
FAQ
What do I do if I fail to receive DingTalk alert notifications?
Get the webhook URL for your DingTalk chatbot (see Implement Kubernetes monitoring and alerting with DingTalk chatbot), then go to the Parameters wizard page and find the dingtalk section. Set enabled to true and enter the webhook URL in the token field. See Alert configurations for the full steps.
What do I do if I see a CRD conflict error when deploying prometheus-operator?
The following error means the cluster still has CRD objects from a previous installation that were not fully cleaned up:
Can't install release with errors: rpc error: code = Unknown desc = object is being deleted: customresourcedefinitions.apiextensions.k8s.io "xxxxxxxx.monitoring.coreos.com" already existsDelete the leftover CRDs, then redeploy:
kubectl delete crd prometheuses.monitoring.coreos.com
kubectl delete crd prometheusrules.monitoring.coreos.com
kubectl delete crd servicemonitors.monitoring.coreos.com
kubectl delete crd alertmanagers.monitoring.coreos.com
What do I do if I fail to receive email alert notifications?
Make sure smtp_auth_password is set to the SMTP authorization code, not the login password of your email account. Also verify that the SMTP server endpoint includes a port number.
What do I do if the console shows "The current cluster is temporarily unavailable" when I click Update?
This happens when the Tiller configuration file is too large for the cluster to handle. Delete some annotations from the configuration file and mount it to a pod as a ConfigMap. Specify the ConfigMap name in the configMaps fields of the prometheus and alertmanager sections. See Mount a custom ConfigMap to Prometheus.
How do I enable prometheus-operator features after deployment?
Go to the cluster details page and choose Applications > Helm in the left navigation pane. Find ack-prometheus-operator and click Update in the Actions column. In the Update Release panel, configure the relevant code block to enable the feature, then click OK.
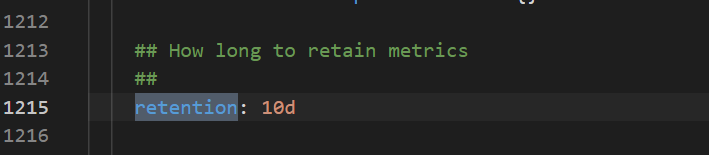
How do I choose between TSDB and disk storage?
TSDB storage is available only in select regions. Disk storage is supported in all regions. The following figure shows how to configure the data retention policy.
What do I do if a Grafana dashboard fails to display data?
Go to the cluster details page and choose Applications > Helm. Find ack-prometheus-operator and click Update. In the Update Release panel, check the value of the clusterVersion field:
Kubernetes earlier than 1.16: set
clusterVersionto1.14.8-aliyun.1Kubernetes 1.16 or later: set
clusterVersionto1.16.6-aliyun.1
What do I do if reinstalling ack-prometheus fails after deleting the namespace?
Deleting the namespace does not remove all associated resource configurations. Run the following commands to clean up role-based access control (RBAC) resources and CRDs before reinstalling.
Delete the ClusterRoles:
kubectl delete ClusterRole ack-prometheus-operator-grafana-clusterrole
kubectl delete ClusterRole ack-prometheus-operator-kube-state-metrics
kubectl delete ClusterRole psp-ack-prometheus-operator-kube-state-metrics
kubectl delete ClusterRole psp-ack-prometheus-operator-prometheus-node-exporter
kubectl delete ClusterRole ack-prometheus-operator-operator
kubectl delete ClusterRole ack-prometheus-operator-operator-psp
kubectl delete ClusterRole ack-prometheus-operator-prometheus
kubectl delete ClusterRole ack-prometheus-operator-prometheus-psp
Delete the ClusterRoleBindings:
kubectl delete ClusterRoleBinding ack-prometheus-operator-grafana-clusterrolebinding
kubectl delete ClusterRoleBinding ack-prometheus-operator-kube-state-metrics
kubectl delete ClusterRoleBinding psp-ack-prometheus-operator-kube-state-metrics
kubectl delete ClusterRoleBinding psp-ack-prometheus-operator-prometheus-node-exporter
kubectl delete ClusterRoleBinding ack-prometheus-operator-operator
kubectl delete ClusterRoleBinding ack-prometheus-operator-operator-psp
kubectl delete ClusterRoleBinding ack-prometheus-operator-prometheus
kubectl delete ClusterRoleBinding ack-prometheus-operator-prometheus-psp
Delete the CRDs:
kubectl delete crd alertmanagerconfigs.monitoring.coreos.com
kubectl delete crd alertmanagers.monitoring.coreos.com
kubectl delete crd podmonitors.monitoring.coreos.com
kubectl delete crd probes.monitoring.coreos.com
kubectl delete crd prometheuses.monitoring.coreos.com
kubectl delete crd prometheusrules.monitoring.coreos.com
kubectl delete crd servicemonitors.monitoring.coreos.com
kubectl delete crd thanosrulers.monitoring.coreos.com