Integrate Managed Service for Prometheus with a Container Service for Kubernetes (ACK) cluster to monitor containers, view dashboards, and configure alerts.
Prerequisites
-
Managed Service for Prometheus is activated. Billing for Managed Service for Prometheus.
-
An ACK cluster is available. Create an ACK managed cluster.
-
Alibaba Cloud Resource Center is activated. Activate Resource Center.
Step 1: Integrate a container cluster
Managed Service for Prometheus natively integrates with ACK. Use one of the following methods to integrate your container cluster.
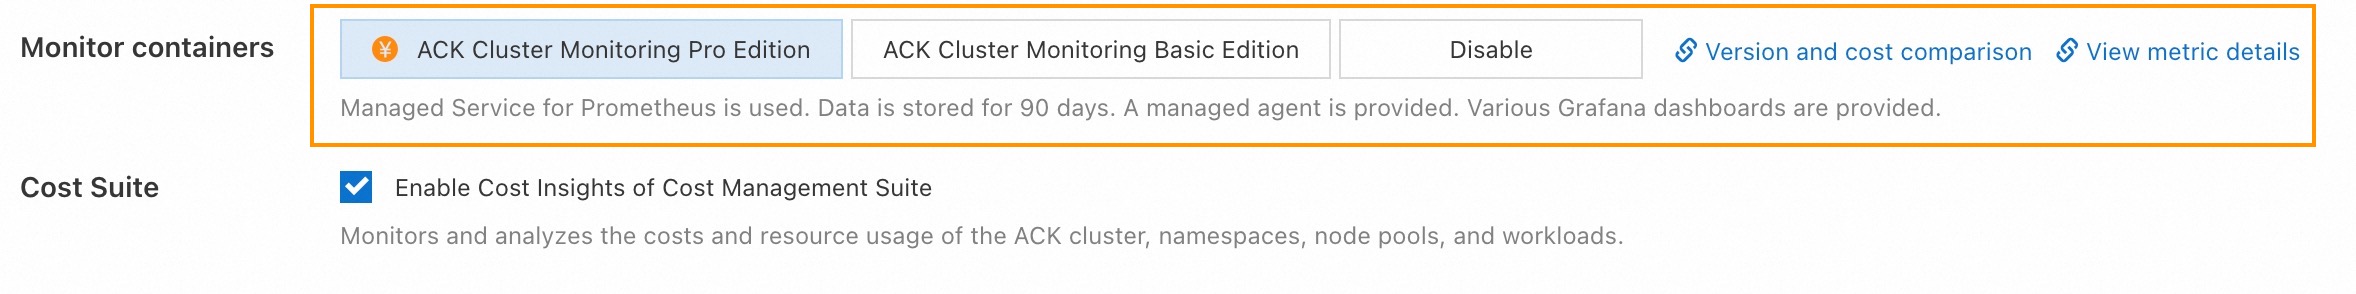
For an ACK managed Pro cluster, enable Container Monitoring Basic Edition or Container Monitoring Pro Edition. Container Monitoring Basic Edition is free; Container Monitoring Pro Edition is billed per node. Billing for Container Monitoring.
Method 1: ACK console
-
Integrate when you create a cluster
When you create an ACK cluster, Managed Service for Prometheus integrates by default.
-
Integrate an existing cluster
To integrate an existing cluster:
Log on to the ACK console. In the left navigation pane, click Clusters.
-
On the Clusters page, click the name of your cluster. In the left navigation pane, click .
-
On the Prometheus Monitoring page, click Install.
Note-
The console installs the required components and sets up dashboards. After installation, click each tab to view monitoring data.
-
Data may take 1 to 2 minutes to appear on dashboards after integration.
-
Method 2: ARMS or Prometheus console
Integrate your container cluster from the ARMS console or the Managed Service for Prometheus console.
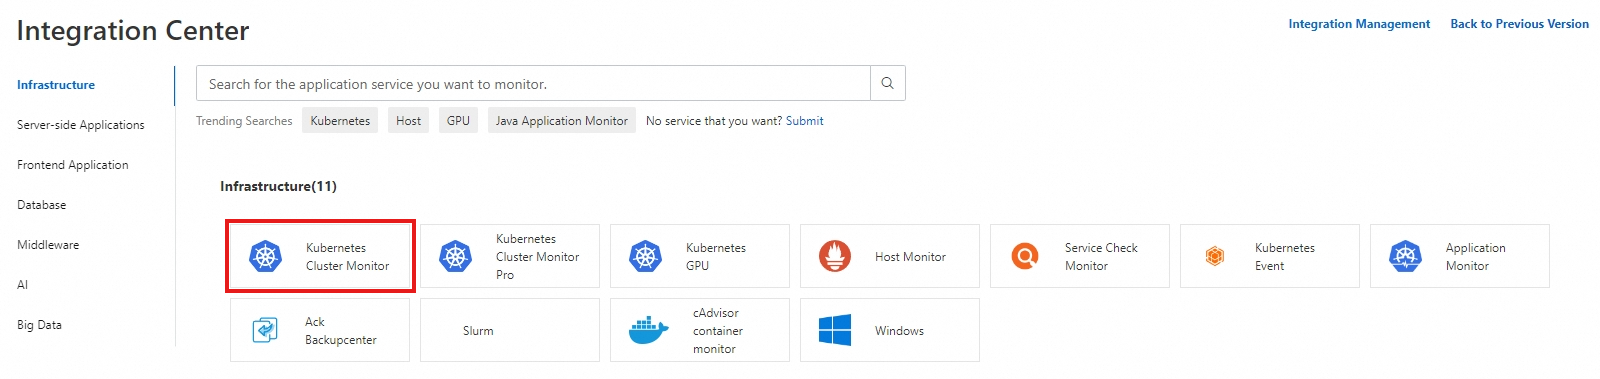
Log on to the Managed Service for Prometheus console. In the left-side navigation pane, click Integration Center.
-
On the Integration Center page, click the Infrastructure tab. In the Infrastructure section, click Container Cluster Monitoring.
-
In the Container Cluster Monitoring panel, follow the on-screen instructions to complete the integration.
Data may take 1 to 2 minutes to appear on dashboards after integration.
Step 2: View monitoring dashboards
Managed Service for Prometheus provides built-in dashboards for clusters, core components, nodes, and pods. Access them from the ACK, ARMS, or Prometheus console.
Method 1: ACK console
-
Log on to the ACK console. In the left navigation pane, click Clusters.
On the Clusters page, click the name of your cluster. In the left navigation pane, click .
-
On the Prometheus Monitoring page, click a dashboard tab to view the corresponding monitoring data.
Method 2: ARMS or Prometheus console
Log on to the ARMS console or the Managed Service for Prometheus console to view dashboards.
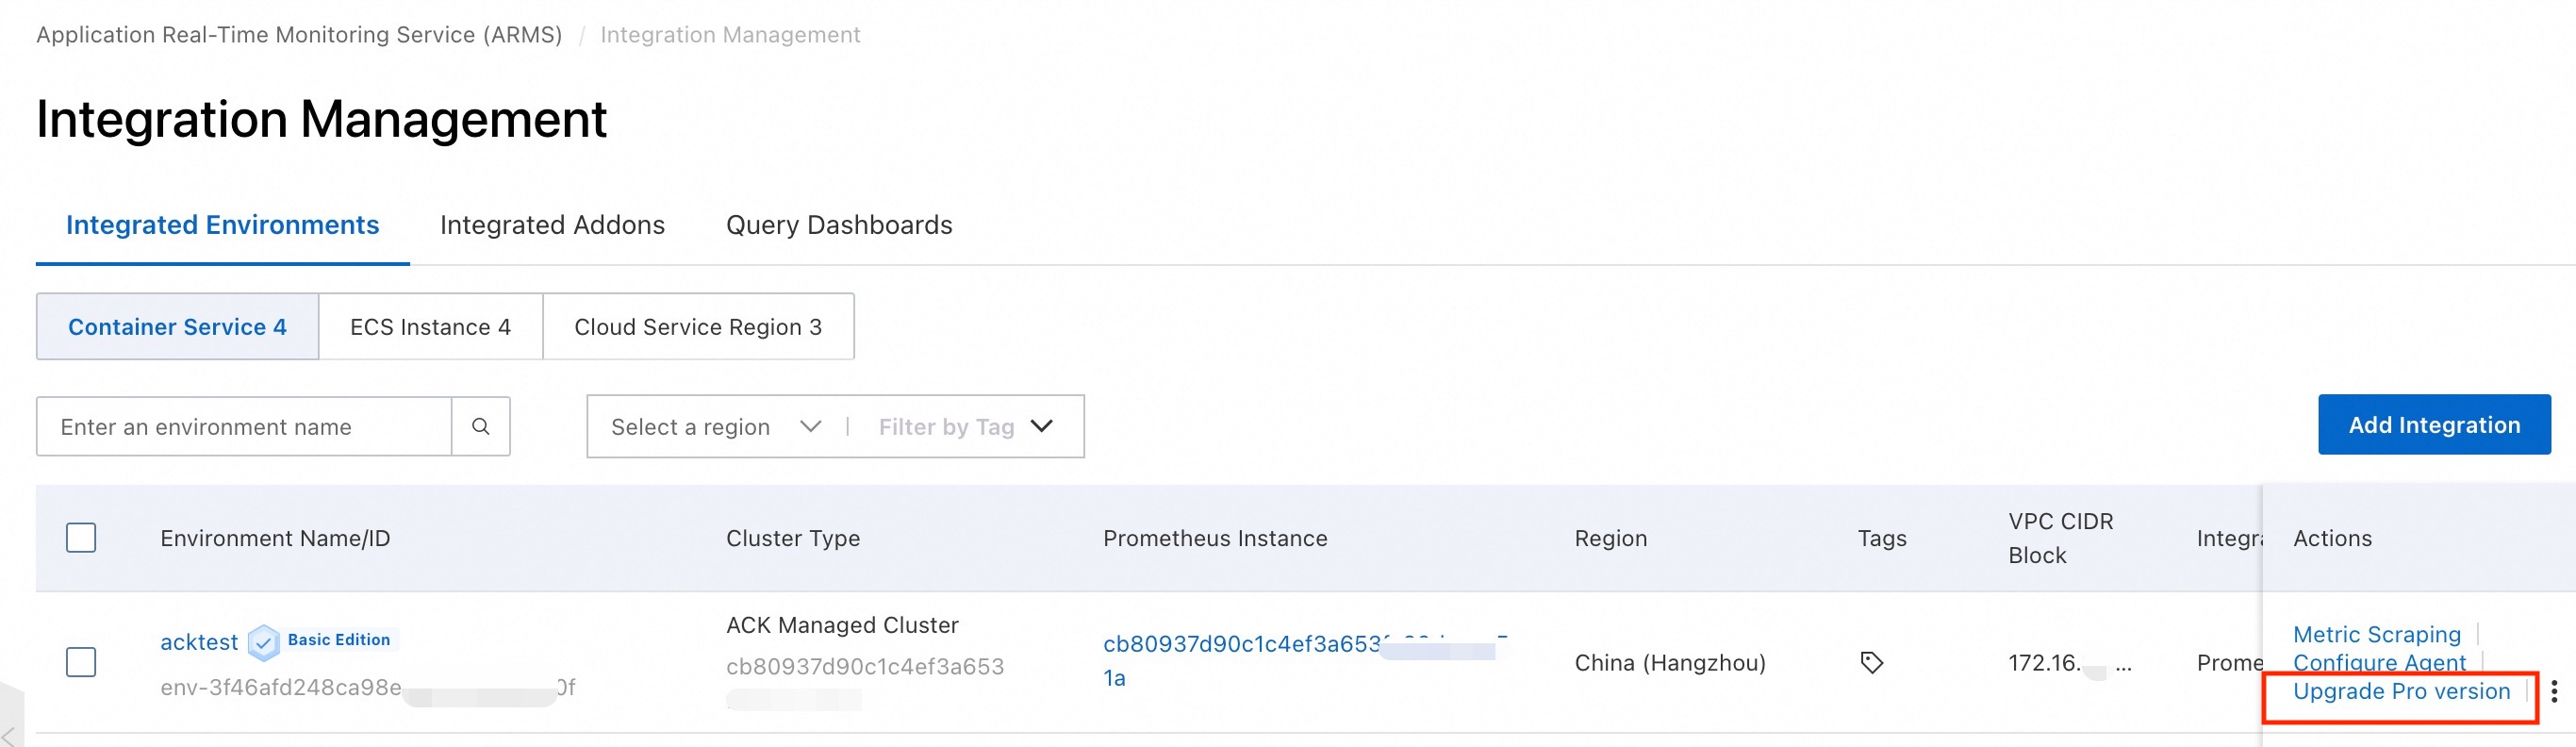
Log on to the Managed Service for Prometheus console. In the left-side navigation pane, click Integration Management.
-
On the Integration Management page, click the Dashboard Query tab.
-
In the container environment section, select the target cluster.
Step 3: Configure alerts
Log on to the Managed Service for Prometheus console. In the left-side navigation pane, click Integration Management.
-
On the Integration Management page, click the Integrated Environments tab, select Container Environment, and then click the name of the target environment to go to its details page.
-
On the Component Management tab, in the Add-on Type section, click Alert Rules to view the built-in alert rules for Prometheus.
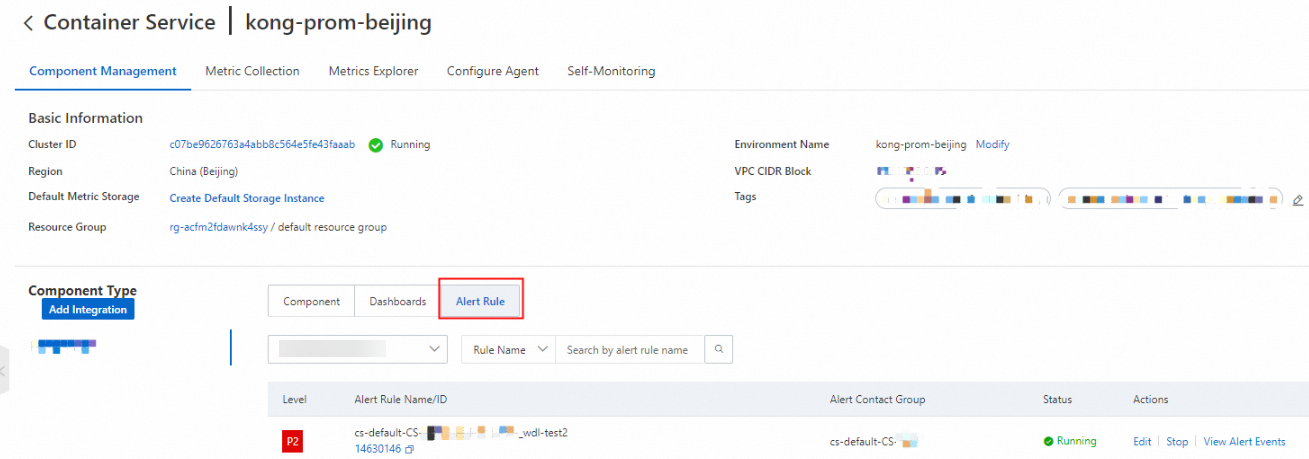
By default, built-in alert rules generate events but do not send notifications. To receive notifications, click Edit to configure a notification method. You can also customize the alert threshold, duration, and content. Create a Prometheus alert rule.

In simple mode, configure notification recipients, periods, and repeat policies.
Related operations
Upgrade to Pro Edition
On the Application Real-Time Monitoring Service (ARMS) console, go to the Integration Management page and click Upgrade to Pro Edition.