ACK is tightly integrated with Simple Log Service, providing a log collection component that simplifies the collection and management of container logs. This topic explains how to install the log collection component and configure log collection to automatically collect, query, and analyze your logs. These capabilities improve operational efficiency and lower management costs.
Use cases
The log collection component collects container logs in two ways:
DaemonSet: This method is suitable for clusters with single-purpose workloads and clearly categorized logs. For more information, see this topic.
Sidecar: This method is suitable for large-scale and heterogeneous clusters. For more information, see Collect container text logs from a Kubernetes cluster by using a sidecar.
For a comparison of the two collection methods, see Collection methods. For details about Log Service billing, see Billing overview.
Index
Steps | Details |
Step 1: Install a log collection component | Install one of the following log collection components.
|
Step 2: Create a collection configuration | You can collect text logs or standard output based on your needs.
|
Step 3: Query and analyze logs | Query and analyze logs in the console. |
Step 1: Install a log collection component
LoongCollector (recommended)
LoongCollector (formerly Logtail): The next-generation log collection agent from Simple Log Service. Deploy it on servers, Kubernetes nodes, or Docker hosts to collect logs from files without modifying application code. It is backward-compatible with Logtail and delivers enhanced performance.
Existing ACK cluster
Log on to the ACK console. In the left navigation pane, click Clusters.
On the Clusters page, click the name of your cluster. In the left navigation pane, click Components and Add-ons.
On the Logs and Monitoring tab, find loongcollector and click Install.
After installation, Simple Log Service (SLS) automatically creates the following resources in the ACK cluster's region. You can view them in the Simple Log Service (SLS) console.
Resource type
Resource name
Purpose
Project
k8s-log-${cluster_id}Isolates logs from different services.
Machine group
k8s-group-${cluster_id}The machine group for loongcollector-ds, used for log collection.
k8s-group-${cluster_id}-clusterThe machine group for loongcollector-cluster, used for metric collection.
k8s-group-${cluster_id}-singletonA machine group for specific single-instance collection configurations.
ImportantThe LoongCollector component does not create a logstore named
config-operation-log. If this logstore already exists, LoongCollector will not write logs to it.
Logtail
Logtail-based data collection: Logtail is a log collection agent that is provided by Simple Log Service. You can use Logtail to collect logs from multiple data sources, such as Alibaba Cloud Elastic Compute Service (ECS) instances, servers in data centers, and servers from third-party cloud service providers. Logtail supports non-intrusive log collection based on log files. You do not need to modify your application code, and log collection does not affect the operation of your applications.
Install Logtail components in an existing ACK cluster
Log on to the ACK console. In the left navigation pane, click Clusters.
On the Clusters page, click the name of your cluster. In the left navigation pane, click Components and Add-ons.
On the Logs and Monitoring tab of the Add-ons page, find the logtail-ds component and click Install.
Install Logtail components when you create an ACK cluster
Log on to the ACK console. In the left navigation pane, click Clusters.
On the Clusters page, click Create Kubernetes Cluster. In the Component Configurations step of the wizard, select Enable Log Service.
This topic describes only the settings related to Simple Log Service. For more information about other settings, see Create an ACK managed cluster.
After you select Enable Log Service, the system prompts you to create a Simple Log Service project. You can use one of the following methods to create a project:
Select Project
You can select an existing project to manage the collected container logs.

Create Project
Simple Log Service automatically creates a project to manage the collected container logs.
ClusterIDindicates the unique identifier of the created Kubernetes cluster.
In the Component Configurations step of the wizard, Enable is selected for the Control Plane Component Logs parameter by default. If Enable is selected, the system automatically configures collection settings and collects logs from the control plane components of a cluster, and you are charged for the collected logs based on the pay-as-you-go billing method. You can determine whether to select Enable based on your business requirements. For more information, see Collect logs of control plane components in ACK managed clusters.
After the Logtail components are installed, Simple Log Service automatically generates a project named k8s-log-<YOUR_CLUSTER_ID> and resources in the project. You can log on to the Simple Log Service console to view the resources.
Resource type | Resource name | Description | Example |
Machine group | k8s-group- | The machine group of logtail-daemonset, which is used in log collection scenarios. | k8s-group-my-cluster-123 |
k8s-group- | The machine group of logtail-statefulset, which is used in metric collection scenarios. | k8s-group-my-cluster-123-statefulset | |
k8s-group- | The machine group of a single instance, which is used to create a Logtail configuration for the single instance. | k8s-group-my-cluster-123-singleton | |
Logstore | config-operation-log | The logstore is used to store logs of the alibaba-log-controller component. We recommend that you do not create a Logtail configuration for the logstore. You can delete the logstore. After the logstore is deleted, the system no longer collects the operational logs of the alibaba-log-controller component. You are charged for the logstore in the same manner as you are charged for regular logstores. For more information, see Billable items for the pay-by-ingested-data model. | None |
Step 2: Create collection configuration
Collect text logs
You can use the following four methods to create a LoongCollector configuration. We recommend using a single method to manage your configurations.
Configuration method | Configuration description | Scenario |
CRD - AliyunPipelineConfig (recommended) | Use the AliyunPipelineConfig Custom Resource Definition (CRD), which is a Kubernetes CRD, to manage a LoongCollector configuration. | This method is suitable for scenarios that require complex collection and processing, and version consistency between the LoongCollector configuration and the LoongCollector container in an ACK cluster. |
CRD - AliyunLogConfig | Use the AliyunLogConfig CRD, which is an old version CRD, to manage a LoongCollector configuration. | This method is suitable for known scenarios in which LoongCollector configurations can be managed by using the old version CRD. You must gradually replace the AliyunLogConfig CRD with the AliyunPipelineConfig CRD to obtain better extensibility and stability. For more information about the differences between the CRD - AliyunPipelineConfig and CRD - AliyunLogConfig methods, see CRDs. |
Simple Log Service console | Manage a LoongCollector configuration in the GUI based on quick deployment and configuration. | This method is suitable for scenarios in which simple settings are required to manage a LoongCollector configuration. If you use this method to manage a LoongCollector configuration, specific advanced features and custom settings cannot be used. |
Environment variable | You can use environment variables to configure parameters used to manage a LoongCollector configuration in an efficient manner. | You can use environment variables only to configure simple settings. Complex processing logic is not supported. Only single-line text logs are supported. You can use environment variables to create a LoongCollector configuration that can meet the following requirements:
|
When you use the (Recommended) CRD-AliyunPipelineConfig method, the version of the logtail-ds component must be 1.8.10 or later. For upgrade details, see Upgrade Logtail to the latest version. This version requirement does not apply to the LoongCollector component.
CRD - AliyunPipelineConfig (recommended)
To create a LoongCollector configuration, you need to only create a Custom Resource (CR) from the AliyunPipelineConfig CRD. After the CR is created, the LoongCollector configuration takes effect.
If you create a LoongCollector configuration by creating a CR and you want to modify the LoongCollector configuration, you can only modify the CR. If you modify the LoongCollector configuration in the Simple Log Service console, the new settings are not synchronized to the CR.
Log on to the ACK console.
On the Clusters page, click the name of your cluster. In the left navigation pane, click .
On the Custom Resources page, click the CRDs tab, then click Create from YAML.
Modify the parameters in the following YAML example as needed, copy and paste it into the template, then click Create.
The YAML file is used to collect logs from the
test.LOGfile in the/data/logs/app_1directory of pods labeled withapp: ^(.*test.*)$to the automatically createdk8s-filelogstore in thek8s-log-<YOUR_CLUSTER_ID>project. Modify the following parameters in the YAML file as needed:project: Example:k8s-log-<YOUR_CLUSTER_ID>.Log on to the Simple Log Service console. Check the name of the project generated after LoongCollector is installed.
IncludeK8sLabel: The label used to filter pods. Example:app: ^(.*test.*)$. In this example, pods whose label key is app and label value contains test are collected.NoteIf you want to collect all pods whose names contain test in your cluster, you can replace the IncludeK8sLabel parameter with the K8sContainerRegex parameter and use wildcards to specify a value for the K8sContainerRegex parameter. Example:
K8sContainerRegex: ^(. test.) $.FilePaths: Example:/data/logs/app_1/**/test.LOG. For more information, see File path mapping for containers.EndpointandRegion(Region ID): Example for theEndpointparameter:cn-hangzhou.log.aliyuncs.com. Example for theRegionparameter:cn-hangzhou.
The value of the
configparameter includes the types of input, output, and processing plug-ins and container filtering methods. For more information, see PipelineConfig. For more information about the complete parameters in the YAML file, see CR parameters.apiVersion: telemetry.alibabacloud.com/v1alpha1 kind: ClusterAliyunPipelineConfig metadata: # Specify the name of the resource. The name must be unique in the current Kubernetes cluster. The name is the same as the name of the created LoongCollector configuration. If the resource name already exists, the name does not take effect. name: example-k8s-file spec: # Specify the name of the project. project: name: k8s-log-<YOUR_CLUSTER_ID> logstores: # Create a Logstore named k8s-file. - name: k8s-file # Create a LoongCollector configuration. config: # Enter a sample log. You can leave this parameter empty. sample: | 2024-06-19 16:35:00 INFO test log line-1 line-2 end # Specify the input plug-in. inputs: # Use the input_file plug-in to collect multi-line text logs from containers. - Type: input_file # Specify the file path in the containers. FilePaths: - /data/logs/app_1/**/test.LOG # Enable the container discovery feature. EnableContainerDiscovery: true # Add conditions to filter containers. Multiple conditions are evaluated by using a logical AND. CollectingContainersMeta: true ContainerFilters: # Specify the namespace of the pods to which the required containers belong. Regular expression matching is supported. K8sNamespaceRegex: default # Specify the name of the required containers. Regular expression matching is supported. IncludeK8sLabel: app: ^(.*app.*)$ # Enable multi-line log collection. If you want to collect single-line logs, delete this parameter. Multiline: # Specify the custom mode to match the beginning of the first line of a log based on a regular expression. Mode: custom # Specify the regular expression that is used to match the beginning of the first line of a log. StartPattern: '\d+-\d+-\d+\s\d+:\d+:\d+' # Specify the processing plug-in. processors: # Use the processor_parse_regex_native plug-in to parse logs based on the specified regular expression. - Type: processor_parse_regex_native # Specify the name of the original field. SourceKey: content # Specify the regular expression that is used for parsing. Use capturing groups to extract fields. Regex: (\d+-\d+-\d+\s\S+)(.*) # Specify the fields that you want to extract. Keys: ["time", "detail"] # Specify the output plug-in. flushers: # Use the flusher_sls plug-in to deliver logs to a specific Logstore. - Type: flusher_sls # Make sure that the logstore exists. Logstore: k8s-file # Make sure that the endpoint is valid. Endpoint: cn-beijing.log.aliyuncs.com Region: cn-beijing TelemetryType: logs
CRD - AliyunLogConfig
To create a LoongCollector configuration, you need to only create a CR from the AliyunLogConfig CRD. After the CR is created, the LoongCollector configuration takes effect.
If you create a LoongCollector configuration by creating a CR and you want to modify the LoongCollector configuration, you can only modify the CR. If you modify the LoongCollector configuration in the Simple Log Service console, the new settings are not synchronized to the CR.
Log on to the ACK console.
On the Clusters page, click the name of your cluster. In the left navigation pane, click .
On the Custom Resources page, click the CRDs tab, then click Create from YAML.
Modify the parameters in the following YAML example as needed, copy and paste it into the template, then click Create.
The YAML file is used to create a LoongCollector configuration named
example-k8s-filethat collects the content oftest.LOGfrom the/data/logs/app_1path for all containers whose names start withappin your cluster in simple mode.. The collected data is sent to thek8s-filelogstore automatically created in thek8s-log-<YOUR_CLUSTER_ID>project.Modify the log file path in the example as needed. For more information, see File path mapping for containers.
logPath: The log file path. Example:/data/logs/app_1.filePattern: The name of the file from which you want to collect logs. Example:test.LOG.
The Config parameter specifies the LoongCollector details, such as the types of input, output, and processing plug-ins and container filtering methods. For more information, see AliyunLogConfigDetail. For more information about the complete parameters in the YAML file, see CR parameters.
apiVersion: log.alibabacloud.com/v1alpha1
kind: AliyunLogConfig
metadata:
  # Specify the name of the resource. The name must be unique in the current Kubernetes cluster.
  name: example-k8s-file
  # Specify the namespace to which the resource belongs.
  namespace: kube-system
spec:
  # Specify the name of the project. If you leave this parameter empty, the project named k8s-log-<your_cluster_id> is used.
  # project: k8s-log-test
  # Specify the name of the logstore. If the specified logstore does not exist, Simple Log Service automatically creates a logstore.
  logstore: k8s-file
  # Create a LoongCollector configuration.
  logtailConfig:
    # Specify the type of the data source. If you want to collect text logs, set the value to file.
    inputType: file
    # Specify the name of the LoongCollector configuration. The name must be the same as the resource name that is specified by metadata.name.
    configName: example-k8s-file
    inputDetail:
      # Specify the settings that allow LoongCollector to collect text logs in simple mode.
      logType: common_reg_log
      # Specify the log file path.
      logPath: /data/logs/app_1
      # Specify the log file name. You can use wildcard characters such as asterisks (*) and question marks (?) when you specify the log file name. Example: log_*.log.
      filePattern: test.LOG
      # If you want to collect text logs from containers, set the value to true.
      dockerFile: true
      # Enable multi-line log collection. If you want to collect single-line logs, delete this parameter.
      # Specify the regular expression to match the beginning of the first line of a log.
      logBeginRegex: \d+-\d+-\d+.*
      # Specify the conditions to filter containers.
      advanced:
        k8s:
          K8sPodRegex: '^(app.*)$'
Simple Log Service console
This method is suitable for scenarios in which simple settings are required to manage a LoongCollector configuration without the need to log on to a Kubernetes cluster. You cannot batch create LoongCollector configurations by using this method.
Log on to the Simple Log Service console.
In the Projects section, click the project you want. Example:
k8s-log-<YOUR_CLUSTER_ID>. On the page that appears, click the logstore you want, and then click Logtail Configurations. On the Logtail Configuration page, click Add Logtail Configuration. In the Quick Data Import dialog box, find the Kubernetes - File card and click Integrate Now.
In the Machine Group Configurations step of the Import Data wizard, set the Scenario parameter to Kubernetes Clusters and the Deployment Method parameter to ACK Daemonset, select the k8s-group-${your_k8s_cluster_id} machine group and click the > icon to move the machine group from the Source Machine Group section to the Applied Server Groups section, then click Next.

Create a LoongCollector configuration. In the Logtail Configuration step of the Import Data wizard, configure the required parameters and click Next. It takes about one minute to create a LoongCollector configuration. The following list describes the main parameter settings. For more information, see Create a Logtail configuration.
Global Configurations
In the Global Configurations section, configure the Configuration Name parameter.

Input Configurations
Logtail Deployment Mode: The LoongCollector deployment mode. Select Daemonset.
File Path Type: The type of the file path that you want to use to collect logs. Valid values: Path in Container and Host Path. If a hostPath volume is mounted to a container and you want to collect logs from files based on the mapped file path on the container host, set this parameter to Host Path. In other scenarios, set it to Path in Container.
File Path: The directory used to store the logs that you want to collect. The file path must start with a forward slash (/). In this example, set the File Path parameter to
/data/wwwlogs/main/**/*.Log, which indicates that logs are collected from files suffixed with .Log in the/data/wwwlogs/maindirectory. Configure the Maximum Directory Monitoring Depth parameter to specify the maximum number of levels of the subdirectories that you want to monitor. The subdirectories are in the log file directory that you specify. This parameter specifies the levels of the subdirectories that the**wildcard characters can match in the value of the File Path parameter. The value 0 specifies that only the specified log file directory is monitored.
Create indexes and preview data. By default, full-text indexing is enabled for Simple Log Service. In this case, full-text indexes are created. You can query all fields in logs based on the indexes. You can also manually create indexes for fields based on the collected logs. Alternatively, you can click Automatic Index Generation. Then, Simple Log Service generates indexes for fields. You can query data in an accurate manner based on field indexes. This reduces indexing costs and improves query efficiency. For more information, see Create indexes.

Environment variable
This method supports only single-line text logs. If you want to collect multi-line text logs or logs of other formats, use the preceding methods.
Create an application and configure Simple Log Service.
Configure Simple Log Service in the ACK console
Log on to the ACK console. In the left-side navigation pane, click Clusters.
On the Clusters page, click the name of the cluster you want. In the left-side navigation pane, choose .
On the Deployments page, click Create From Image.
On the Application Basic Information tab, set the Application Name, click Next, and on the Container Configuration page, set the image name.
The following section describes only the settings related to Simple Log Service. For more information about other settings, see Create a stateless workload (Deployment).
In the Log section, configure log-related information.
Create a Logtail configuration.
Click Collection Configuration to create a Logtail configuration. Each Logtail configuration consists of the Logstore and Log Path In Container parameters.
Logstore: the name of the logstore used to store the collected logs. If the logstore does not exist, ACK automatically creates a logstore in the Simple Log Service project that is associated with your ACK cluster.
NoteThe default retention period of logs in a logstore is 90 days.
Log Path in Container: the path from which you want to collect logs. A value of /usr/local/tomcat/logs/catalina.*.log indicates that Logtail collects text logs from the Tomcat application.

By default, each logstore corresponds to a Logtail configuration that you can use to collect logs by line in simple mode.
Create custom tags.
Click Custom Tag to create custom tags. Each custom tag is a key-value pair and is added to the collected logs. You can use custom tags to identify container logs. For example, specify a version number for the Tag Value parameter.

Configure Simple Log Service by using a YAML template
Log on to the ACK console. In the left-side navigation pane, click Clusters.
On the Clusters page, click the name of the cluster that you want to manage. In the left-side navigation pane, choose .
On the Deployments page, select a namespace from the Namespace drop-down list in the upper part of the page. Then, click Create From YAML in the upper-right corner of the page.
Configure a YAML template.
The syntax of the YAML template is the same as the Kubernetes syntax. However, to specify a collection configuration for a container, you must use
envto add Collection Configurations and Custom Tags to the container. You must also create the correspondingvolumeMountsandvolumesbased on the collection configuration. The following code is an example:apiVersion: v1 kind: Pod metadata: name: my-demo spec: containers: - name: my-demo-app image: 'registry.cn-hangzhou.aliyuncs.com/log-service/docker-log-test:latest' env: # Configure environment variables - name: aliyun_logs_log-varlog value: /var/log/*.log - name: aliyun_logs_mytag1_tags value: tag1=v1 # Configure volume mounting volumeMounts: - name: volumn-sls-mydemo mountPath: /var/log # If the pod is repetitively restarted, you can add a sleep command to the startup parameters of the pod. command: ["sh", "-c"] # Run commands in the shell. args: ["sleep 3600"] # Make the pod sleep 3,600 seconds (1 hour). volumes: - name: volumn-sls-mydemo emptyDir: {}Use environment variables to create Collection Configurations and Custom Tags. All environment variables related to configurations use
aliyun_logs_as the prefix.Create collection configurations in the following format:
- name: aliyun_logs_log-varlog
  value: /var/log/*.log
In the example, a collection configuration is created in the
aliyun_logs_{key}format. The value of{key}islog-varlog.aliyun_logs_log-varlog: This environment variable creates a configuration to collect the content of `/var/log/*.log` files from the container and store the content in aLogstorenamedlog-varlog. The name of the corresponding Simple Log Service collection configuration is alsolog-varlog. The purpose is to collect the content of the `/var/log/*.log` files from the container to thelog-varlogLogstore.
Create Custom Tags in the following format:
- name: aliyun_logs_mytag1_tags
  value: tag1=v1
After a tag is added, the tag is automatically appended to the log data that is collected from the container.
mytag1isa name that does not contain underscores (_).
If your collection configuration specifies a collection path other than stdout, you must create the corresponding
volumeMountsin this section.In the example, the collection configuration adds the collection of /var/log/*.log. Therefore, the corresponding
volumeMountsfor /var/log is added.
After you complete the YAML template, click Create. The Kubernetes cluster executes the configuration.
Use environment variables to configure advanced settings.
Environment variable-based LoongCollector configuration supports various parameters. You can use environment variables to configure advanced settings to meet your log collection requirements.
ImportantYou cannot use environment variables to configure log collection in edge computing scenarios.
Variable
Description
Example
Usage note
aliyun_logs_{key}
Required. {key} can contain only lowercase letters, digits, and hyphens (-).
If the specified aliyun_logs_{key}_logstore variable does not exist, a logstore named {key} is automatically created to store the collected logs.
To collect the stdout of a container, set the value to stdout. You can also set the value to a log file path in the containers.
- name: aliyun_logs_catalina

  value: stdout
- name: aliyun_logs_access-log value: /var/log/nginx/access.log
By default, logs are collected in simple mode. If you want to parse the collected logs, we recommend that you configure the related settings in the Simple Log Service console or by using CRDs.
{key} specifies the name of the LoongCollector configuration. The configuration name must be unique in the Kubernetes cluster.
aliyun_logs_{key}_tags
Optional. The variable is used to add tags to logs. The value must be in the {tag-key}={tag-value} format.
- name: aliyun_logs_catalina_tags

  value: app=catalina
N/A.
aliyun_logs_{key}_project
Optional. The variable specifies a Simple Log Service project. The default project is the one that is generated after LoongCollector is installed.
- name: aliyun_logs_catalina_project

  value: my-k8s-project
The project must be deployed in the same region as LoongCollector.
aliyun_logs_{key}_logstore
Optional. The variable specifies a logstore. Default value: {key}.
- name: aliyun_logs_catalina_logstore

  value: my-logstore
N/A.
aliyun_logs_{key}_shard
Optional. The variable specifies the number of shards of the logstore. Valid values: 1 to 10. Default value: 2.
NoteIf the logstore that you specify already exists, this variable does not take effect.
- name: aliyun_logs_catalina_shard

  value: '4'
N/A.
aliyun_logs_{key}_ttl
Optional. The variable specifies the log retention period. Valid values: 1 to 3650.
If you set the value to 3650, logs are permanently stored.
The default retention period is 90 days.
NoteIf the logstore that you specify already exists, this variable does not take effect.
- name: aliyun_logs_catalina_ttl

  value: '3650'
N/A.
aliyun_logs_{key}_machinegroup
Optional. The variable specifies the machine group in which the application is deployed. The default machine group is the one in which LoongCollector is deployed. For more information about how to use this variable, see Collect container logs from ACK clusters.
- name: aliyun_logs_catalina_machinegroup

  value: my-machine-group
N/A.
aliyun_logs_{key}_logstoremode
Optional. The variable specifies the type of logstore. Default value: standard. Valid values: standard and query.
NoteIf the logstore that you specify already exists, this variable does not take effect.
standard: Standard logstore. This type of logstore supports the log analysis feature and is suitable for scenarios such as real-time monitoring and interactive analysis. You can use this type of logstore to build a comprehensive observability system.
query: Query logstore. This type of logstore supports high-performance queries. The index traffic fee of a Query logstore is approximately half that of a Standard Logstore. Query logstores do not support SQL analysis. Query logstores are suitable for scenarios in which the amount of data is large, the log retention period is long, or log analysis is not required. If logs are stored for weeks or months, the log retention period is considered long.
- name: aliyun_logs_catalina_logstoremode
  value: standard
- name: aliyun_logs_catalina_logstoremode value: query
N/A.
Custom Requirement 1: Collect Data From Multiple Applications To The Same Logstore
In this scenario, configure the aliyun_logs_{key}_logstore parameter. The following example shows how to collect stdout from two applications to the stdout-logstore.
The
{key}of Application 1 is set toapp1-stdout, and the{key}of Application 2 is set toapp2-stdout.Configure the following environment variables for Application 1:
# Configure environment variables
    - name: aliyun_logs_app1-stdout
      value: stdout
    - name: aliyun_logs_app1-stdout_logstore
      value: stdout-logstore
Configure the following environment variables for Application 2:
# Configure environment variables
    - name: aliyun_logs_app2-stdout
      value: stdout
    - name: aliyun_logs_app2-stdout_logstore
      value: stdout-logstore
Custom Requirement 2: Collect Data From Multiple Applications To Different Projects
In this scenario, perform the following steps:
Create a machine group in each project and set the custom identifier of the machine group in the following format:
k8s-group-{cluster-id}, where{cluster-id}is the ID of the cluster. You can specify a custom machine group name.Specify the project, logstore, and machine group in the environment variables for each application. The name of the machine group is the same as the one that you create in the previous step.
In the following example, the
{key}of Application 1 is set toapp1-stdout, and the{key}of Application 2 is set toapp2-stdout. If the two applications are deployed in the same ACK cluster, you can use the same machine group for the applications.Configure the following environment variables for Application 1:
# Configure environment variables
    - name: aliyun_logs_app1-stdout
      value: stdout
    - name: aliyun_logs_app1-stdout_project
      value: app1-project
    - name: aliyun_logs_app1-stdout_logstore
      value: app1-logstore
    - name: aliyun_logs_app1-stdout_machinegroup
      value: app1-machine-group
Configure the following environment variables for Application 2:
# Configure environment variables
    - name: aliyun_logs_app2-stdout
      value: stdout
    - name: aliyun_logs_app2-stdout_project
      value: app2-project
    - name: aliyun_logs_app2-stdout_logstore
      value: app2-logstore
    - name: aliyun_logs_app2-stdout_machinegroup
      value: app1-machine-group
Collect stdout
You can create a collection configuration in one of four ways. We recommend that you use only one method to manage your collection configurations:
Configuration method | Configuration description | Scenario |
CRD - AliyunPipelineConfig (recommended) | Use the AliyunPipelineConfig Custom Resource Definition (CRD), which is a Kubernetes CRD, to manage a LoongCollector configuration. | This method is suitable for scenarios that require complex collection and processing, and version consistency between the LoongCollector configuration and the LoongCollector container in an ACK cluster. |
CRD - AliyunLogConfig | Use the AliyunLogConfig CRD, which is an old version CRD, to manage a LoongCollector configuration. | This method is suitable for known scenarios in which LoongCollector configurations can be managed by using the old version CRD. You must gradually replace the AliyunLogConfig CRD with the AliyunPipelineConfig CRD to obtain better extensibility and stability. For more information about the differences between the CRD - AliyunPipelineConfig and CRD - AliyunLogConfig methods, see CRDs. |
Simple Log Service console | Manage a LoongCollector configuration in the GUI based on quick deployment and configuration. | This method is suitable for scenarios in which simple settings are required to manage a LoongCollector configuration. If you use this method to manage a LoongCollector configuration, specific advanced features and custom settings cannot be used. |
Environment variable | You can use environment variables to configure parameters used to manage a LoongCollector configuration in an efficient manner. | You can use environment variables only to configure simple settings. Complex processing logic is not supported. Only single-line text logs are supported. You can use environment variables to create a LoongCollector configuration that can meet the following requirements:
|
Using the (Recommended) CRD-AliyunPipelineConfig method requires the logtail-ds component to be version 1.8.10 or later. For details on upgrading the component, see Upgrade Logtail to the latest version. This version requirement does not apply to the LoongCollector component.
Crd-AliyunPipelineConfig (recommended)
To create Logtail configurations, simply create the AliyunPipelineConfig custom resources, which will take effect automatically.
For configurations created through custom resources, modifications must be made by updating the corresponding custom resource. Changes made in the Simple Log Service console will not sync to the custom resource.
Log on to the ACK console.
On the Clusters page, click the name of your cluster. In the left navigation pane, click .
On the Custom Resources page, click the CRDs tab, then click Create from YAML.
Modify the parameters in the following YAML example as needed, copy and paste it into the template, then click Create.
NoteYou can use the Logtail configuration generator to create a target scenario YAML script. This tool helps you quickly complete the configuration and reduces manual operations.
The example YAML file below captures standard output from Pods labeled with
app: ^(.*test.*)$within the default namespace, using multi-line text mode, and forwards it to a logstore calledk8s-stdout, which is automatically created within a project namedk8s-log-<YOUR_CLUSTER_ID>. Adjust the parameters in the YAML as needed:project: Log on to the Simple Log Service Console, and identify the project name created by the Logtail you installed, typically in the formatk8s-log-<YOUR_CLUSTER_ID>.IncludeK8sLabel: Used to filter the labels of the target pod. For example,app: ^(.*test.*)$indicates that the label key isapp, and it will collect pods with values that includetest.EndpointandRegion: For example,ap-southeast-1.log.aliyuncs.comandap-southeast-1.
For more information on
configin the YAML file, such as supported inputs, outputs, processing plug-in types, and container filtering methods, see PipelineConfig. For a comprehensive list of YAML parameters, see CR parameters.apiVersion: telemetry.alibabacloud.com/v1alpha1 # Create a ClusterAliyunPipelineConfig. kind: ClusterAliyunPipelineConfig metadata: # Specify the name of the resource. The name must be unique in the current Kubernetes cluster. This name is also the name of the Logtail configuration created. name: example-k8s-stdout spec: # Specify the target project. project: name: k8s-log-<YOUR_CLUSTER_ID> # Create a logstore for storing logs. logstores: - name: k8s-stdout # Define the Logtail configuration. config: # Sample log (optional) sample: | 2024-06-19 16:35:00 INFO test log line-1 line-2 end # Define input plug-ins. inputs: # Use the service_docker_stdout plug-in to collect text logs inside the container. - Type: service_docker_stdout Stdout: true Stderr: true # Configure container information filter conditions. Multiple options are in an "and" relationship. # Specify the namespace to which the pod containing the container to be collected belongs. Supports regular expression matching. K8sNamespaceRegex: "^(default)$" # Enable container metadata preview. CollectContainersFlag: true # Collect containers that meet the Pod label conditions. Multiple entries are in an "or" relationship. IncludeK8sLabel: app: ^(.*test.*)$ # Configure multi-line chunk configuration. Invalid configuration for single-line log collection. # Configure the regular expression for the beginning of the line. BeginLineRegex: \d+-\d+-\d+.* # Define output plug-ins flushers: # Use the flusher_sls plug-in to send logs to the specified logstore. - Type: flusher_sls # Make sure that the logstore exists. Logstore: k8s-stdout # Make sure that the endpoint is valid. Endpoint: ap-southeast-1.log.aliyuncs.com Region: ap-southeast-1 TelemetryType: logs
CRD-AliyunLogConfig
To create Logtail configurations, simply create the AliyunLogConfig custom resources, which will take effect automatically.
For configurations created through custom resources, modifications must be made by updating the corresponding custom resource. Changes made in the Simple Log Service Console will not sync to the custom resource.
Log on to the ACK console.
On the Clusters page, click the name of your cluster. In the left navigation pane, click .
On the Custom Resources page, click the CRDs tab, then click Create from YAML.
Modify the parameters in the following YAML example as needed, copy and paste it into the template, then click Create.
This YAML script will establish a Logtail configuration called
simple-stdout-example. It will collect the standard output from all containers within the cluster that have names beginning withapp, using multi-line mode. The collected data will then be transmitted to a logstore calledk8s-stdoutwithin a project namedk8s-log-<YOUR_CLUSTER_ID>.For more information on the logtailConfig item in the YAML file, including supported inputs, outputs, processing plug-in types, and container filtering methods, see AliyunLogConfigDetail. For a comprehensive list of YAML parameters, see CR parameters.
# Standard output configuration
apiVersion: log.alibabacloud.com/v1alpha1
kind: AliyunLogConfig
metadata:
  # Specify the name of the resource. The name must be unique in the current Kubernetes cluster.
  name: simple-stdout-example
spec:
  # Specify the target project name (optional, default is k8s-log-<your_cluster_id>)
  # project: k8s-log-test
  # Specify the name of the logstore. If the specified logstore does not exist, Simple Log Service automatically creates a Logstore.
  logstore: k8s-stdout
  # Specify the Logtail configuration.
  logtailConfig:
    # Specify the type of the data source. To collect standard output, set the value to plugin.
    inputType: plugin
    # Specify the name of the Logtail collection configuration. The name must be the same as the resource name that is specified in metadata.name.
    configName: simple-stdout-example
    inputDetail:
      plugin:
        inputs:
          - type: service_docker_stdout
            detail:
              # Specify the collection of stdout and stderr.
              Stdout: true
              Stderr: true
              # Specify the namespace to which the pod containing the container to be collected belongs. Supports regular expression matching.
              K8sNamespaceRegex: "^(default)$"
              # Specify the name of the container to be collected. Supports regular expression matching.
              K8sContainerRegex: "^(app.*)$"
              # Configure multi-line chunk configuration.
              # Configure the regular expression for the beginning of the line.
              BeginLineRegex: \d+-\d+-\d+.*
Simple Log Service console
Log on to the Simple Log Service Console.
Select your project from the list, such as
k8s-log-<YOUR_CLUSTER_ID>. On the project page, click Logtail Configurations for the target logstore, click Add Logtail Configuration, and click Integrate Now under K8s - Stdout and Stderr - Old Version.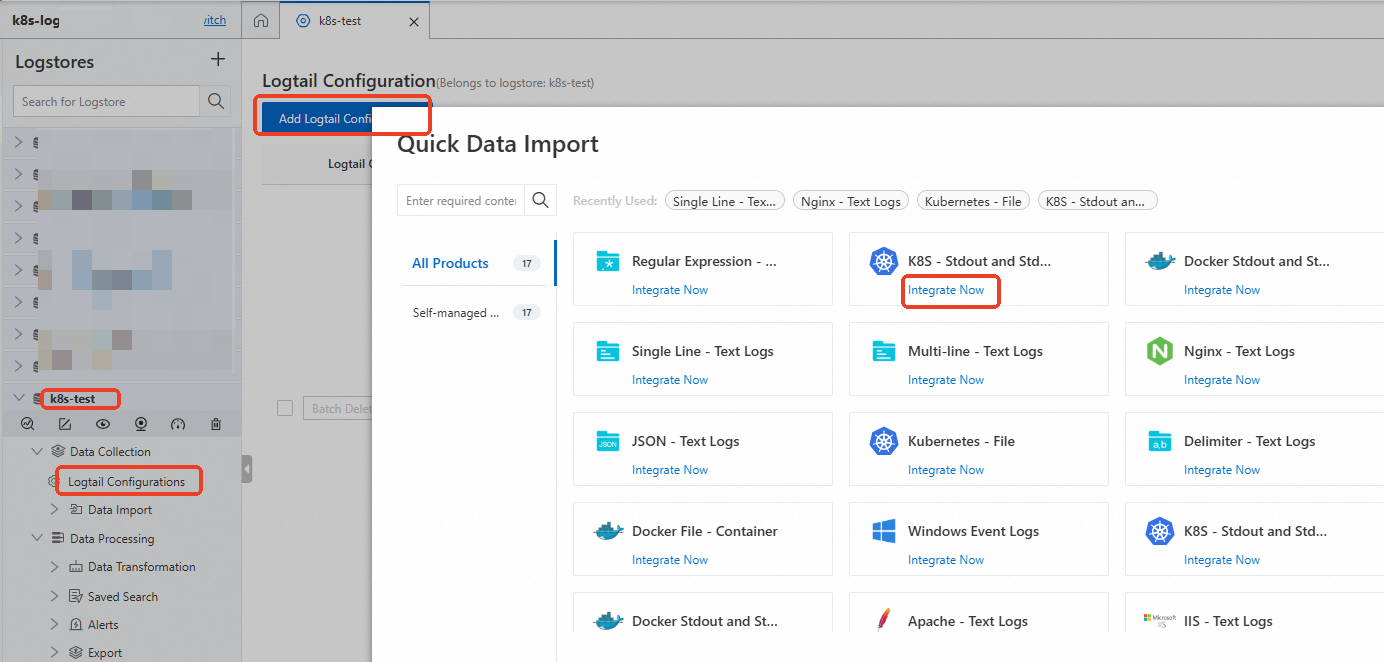
Since Logtail is already installed for the ACK cluster, select Use Existing Machine Groups.

On the Machine Group Configurations page, select the k8s-group-${your_k8s_cluster_id} machine group under the ACK Daemonset method in the Kubernetes Clusters scenario, add it to the applied machine group, then click Next.

Create a Logtail configuration, enter the required configurations as described below, and click Next. It will take about 1 minute for the configuration to take effect.
This section covers only the necessary configurations. For a complete list, see Global Configurations.
Global Configuration
Enter the configuration name in Global Configuration.
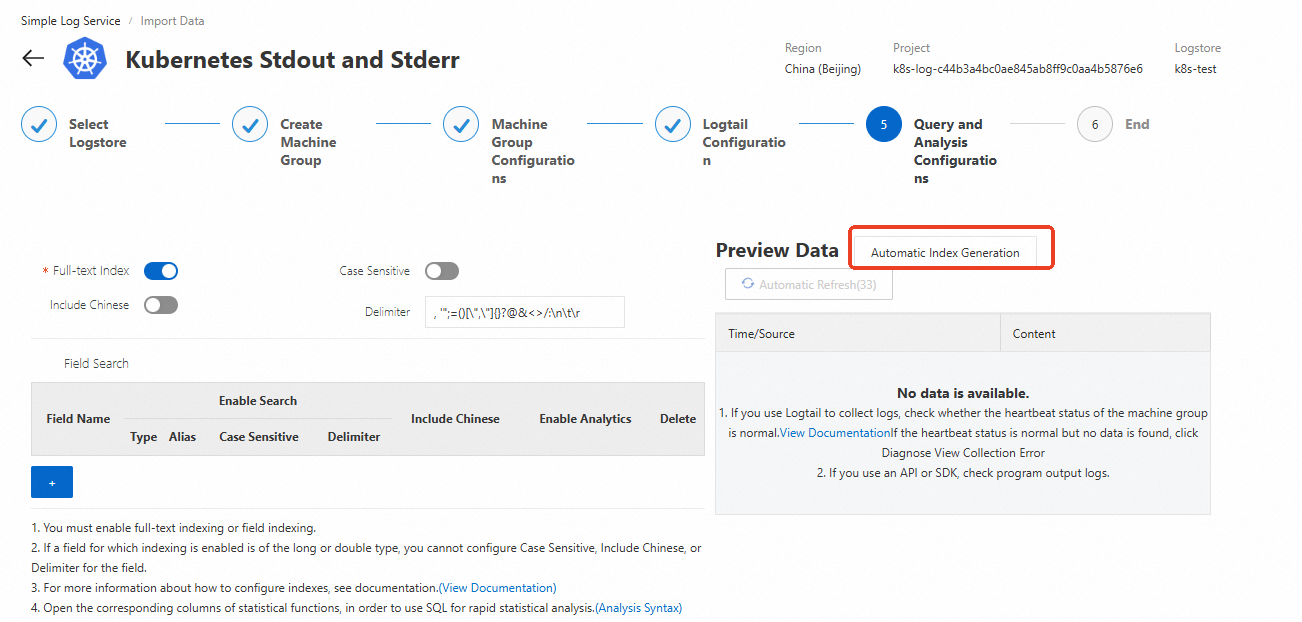
Create indexes and preview data: By default, Simple Log Service enables a full-text index, indexing all fields in the log for queries. You can also create a field index manually based on the collected logs, or click Automatic Index Generation. This will generate a field index for term queries on specific fields, reducing index costs and improving query efficiency.
Environment variables
Configure Simple Log Service when creating an application.
Console
Log on to the Container Service Management Console and click Clusters in the left-side navigation pane.
On the Clusters page, click the target cluster, then select from the left-side navigation pane.
On the Deployments page, select a namespace and click Create from Image.
On the Basic Information page, set the application name, then click Next to enter the Container page.
This section introduces configurations related to Simple Log Service. For more information about other application configurations, see Create a stateless workload (Deployment).
In the Log section, configure log-related information.
Set Collection Configuration.
Click Collection Configuration to create a new collection configuration. Each configuration consists of two items:
Logstore: Specify the logstore where the collected logs are stored. If the logstore does not exist, ACK will automatically create it in the Simple Log Service project associated with your cluster.
NoteThe default log retention period for newly created logstores is 90 days.
Log Path in Container (Can be set to stdout): Specify stdout to collect standard output and error output from the container.

Each collection configuration is automatically created as a logstore configuration, and logs are collected in simple mode (by row) by default.
Set Custom Tag.
Click Custom Tag to create a custom tag. Each tag is a key-value pair that will be appended to the collected logs. Use it to label the log data of the container, such as the version number.

After configuring all settings, click Next. For subsequent steps, see Create a stateless workload (Deployment).
YAML template
Log on to the Container Service Management Console or the , and select Clusters from the left-side navigation pane.
On the Clusters page, click the target cluster name, and then select from the left-side navigation pane.
On the Deployments page, select a namespace and click Create from YAML.
Configure the YAML file.
The syntax of the YAML template is consistent with Kubernetes. To specify the collection configuration for the container, use
envto add Collection Configuration and Custom Tag to the container, and create correspondingvolumeMountsandvolumesbased on the collection configuration. Below is a simple pod example:apiVersion: apps/v1 kind: Deployment metadata: annotations: deployment.kubernetes.io/revision: '1' labels: app: deployment-stdout cluster_label: CLUSTER-LABEL-A name: deployment-stdout namespace: default spec: progressDeadlineSeconds: 600 replicas: 1 revisionHistoryLimit: 10 selector: matchLabels: app: deployment-stdout strategy: rollingUpdate: maxSurge: 25% maxUnavailable: 25% type: RollingUpdate template: metadata: labels: app: deployment-stdout cluster_label: CLUSTER-LABEL-A spec: containers: - args: - >- while true; do date '+%Y-%m-%d %H:%M:%S'; echo 1; echo 2; echo 3; echo 4; echo 5; echo 6; echo 7; echo 8; echo 9; sleep 10; done command: - /bin/sh - '-c' - '--' env: - name: cluster_id value: CLUSTER-A - name: aliyun_logs_log-stdout value: stdout image: 'mirrors-ssl.aliyuncs.com/busybox:latest' imagePullPolicy: IfNotPresent name: timestamp-test resources: {} terminationMessagePath: /dev/termination-log terminationMessagePolicy: File dnsPolicy: ClusterFirst restartPolicy: Always schedulerName: default-scheduler securityContext: {} terminationGracePeriodSeconds: 30Create your Collection Configuration and Custom Tag using environment variables. All related environment variables start with the prefix
aliyun_logs_.The rules for creating collection configurations are as follows:
- name: aliyun_logs_log-varlog
  value: /var/log/*.log
The example creates a collection configuration in the format
aliyun_logs_{key}, where{key}islog-varlog.aliyun_logs_log-varlog: This variable indicates the creation of alogstorenamedlog-varlog. The log collection path is set to /var/log/*.log, and the corresponding Simple Log Service collection configuration name is alsolog-varlog. The goal is to collect the contents of the container's /var/log/*.log files into thelog-varlogLogstore.
The rules for Creating Custom Tags are as follows:
- name: aliyun_logs_mytag1_tags
  value: tag1=v1
After a tag is configured, the corresponding field is automatically appended to the log data collected from the container. The
mytag1must beany name that does not contain '_'.
If your collection configuration specifies a path other than stdout, you need to create the corresponding
volumeMountsin this section.In the example, the collection configuration adds collection for /var/log/*.log, so the corresponding
volumeMountsfor /var/log is added.
After completing the YAML, click Create to submit the configuration to the Kubernetes cluster for execution.
Configure advanced parameters for environment variables.
Environment variables support various configuration parameters for log collection. Set advanced parameters as needed.
ImportantConfiguring log collection through environment variables is not suitable for edge computing scenarios.
Field
Description
Example
Notes
aliyun_logs_{key}
Required. {key} can contain only lowercase letters, digits, and hyphens (-).
If aliyun_logs_{key}_logstore does not exist, a logstore named {key} is created by default.
If the value is stdout, it indicates the collection of the container's standard output. Other values indicate the log path inside the container.
- name: aliyun_logs_catalina

  value: stdout
- name: aliyun_logs_access-log value: /var/log/nginx/access.log
The default collection mode is simple mode. To parse log content, use the Simple Log Service Console and refer to Collect text logs from Kubernetes containers in DaemonSet mode or Collect stdout and stderr from Kubernetes containers in DaemonSet mode (old version) for configuration.
{key} specifies the name of the Logtail configuration in Simple Log Service. The configuration name must be unique in the Kubernetes cluster.
aliyun_logs_{key}_tags
Optional. The value must be in the format {tag-key}={tag-value} and is used to tag the logs.
- name: aliyun_logs_catalina_tags

  value: app=catalina
None.
aliyun_logs_{key}_project
Optional. The value specifies a project in Simple Log Service. If this environment variable does not exist, the project you selected during installation is used.
- name: aliyun_logs_catalina_project

  value: my-k8s-project
The project must be deployed in the same region as Logtail.
aliyun_logs_{key}_logstore
Optional. The value specifies a Logstore in Simple Log Service. If this environment variable does not exist, the Logstore is the same as {key}.
- name: aliyun_logs_catalina_logstore

  value: my-logstore
None.
aliyun_logs_{key}_shard
Optional. The value specifies the number of shards when creating a logstore. Valid values: 1 to 10. If this environment variable does not exist, the value is 2.
NoteIf the logstore already exists, this parameter does not take effect.
- name: aliyun_logs_catalina_shard

  value: '4'
None.
aliyun_logs_{key}_ttl
Optional. The value specifies the log retention period. Valid values: 1 to 3650.
If the value is 3650, the log retention period is set to permanent.
If this environment variable does not exist, the default log retention period is 90 days.
NoteIf the logstore already exists, this parameter does not take effect.
- name: aliyun_logs_catalina_ttl

  value: '3650'
None.
aliyun_logs_{key}_machinegroup
Optional. The value specifies the machine group of the application. If this environment variable does not exist, the default machine group where Logtail is installed is used. For detailed usage of this parameter, see Collect container logs from ACK clusters.
- name: aliyun_logs_catalina_machinegroup

  value: my-machine-group
None.
aliyun_logs_{key}_logstoremode
Optional. The value specifies the logstore type. Default value: standard. Valid values:
NoteIf the logstore already exists, this parameter does not take effect.
standard: Supports one-stop data analysis features of Simple Log Service. Suitable for real-time monitoring, interactive analysis, and building complete observability systems.
query: Supports high-performance queries. The index traffic cost is about half of standard, but does not support SQL analysis. Suitable for scenarios with large data volumes, long storage periods (weekly or monthly), and no log analysis.
- name: aliyun_logs_catalina_logstoremode
  value: standard
- name: aliyun_logs_catalina_logstoremode value: query
This parameter requires the logtail-ds image version to be >=1.3.1.
Customization requirement 1: Collect data from multiple applications into the same logstore
To collect data from multiple applications into the same Logstore, set the aliyun_logs_{key}_logstore parameter. For example, the following configuration collects stdout from two applications into stdout-logstore.
In the example, the
{key}for Application 1 isapp1-stdout, while for Application 2 it is{key}app2-stdout.The environment variables for Application 1 are as follows:
# Configure environment variables
    - name: aliyun_logs_app1-stdout
      value: stdout
    - name: aliyun_logs_app1-stdout_logstore
      value: stdout-logstore
The environment variables for Application 2 are as follows:
# Configure environment variables
    - name: aliyun_logs_app2-stdout
      value: stdout
    - name: aliyun_logs_app2-stdout_logstore
      value: stdout-logstore
Customization requirement 2: Collect data from different applications into different projects
To collect data from different applications into multiple projects, follow these steps:
Create a machine group in each project with a custom ID named
k8s-group-{cluster-id}, where{cluster-id}is your cluster ID. The machine group name is customizable.Configure the project, logstore, and machine group information in the environment variables for each application. Use the same machine group name as created in the previous step.
In the following example, the
{key}for Application 1 isapp1-stdout, and the{key}for Application 2 isapp2-stdout. If both applications are deployed within the same K8s cluster, you can utilize the same machine group for them.The environment variables for Application 1 are as follows:
# Configure environment variables
    - name: aliyun_logs_app1-stdout
      value: stdout
    - name: aliyun_logs_app1-stdout_project
      value: app1-project
    - name: aliyun_logs_app1-stdout_logstore
      value: app1-logstore
    - name: aliyun_logs_app1-stdout_machinegroup
      value: app1-machine-group
The environment variables for Application 2 are as follows:
# Application 2 Configure environment variables
    - name: aliyun_logs_app2-stdout
      value: stdout
    - name: aliyun_logs_app2-stdout_project
      value: app2-project
    - name: aliyun_logs_app2-stdout_logstore
      value: app2-logstore
    - name: aliyun_logs_app2-stdout_machinegroup
      value: app1-machine-group
Step 3: Query and analyze logs
Log on to the Simple Log Service console.
In the Projects section, click the project you want to go to its details page.

In the left-side navigation pane, click the
 icon of the logstore you want. In the drop-down list, select Search & Analysis to view the logs that are collected from your Kubernetes cluster.
Default log fields
Text logs
K8s log fields
The following table describes the default fields that are included in each container text log in Kubernetes.
Field | Description |
__tag__:__hostname__ | The name of the container host. |
__tag__:__path__ | The log file path in the container. |
__tag__:_container_ip_ | The IP address of the container. |
__tag__:_image_name_ | The name of the image used by the container. Note If there are multiple images with the same hash but different names or tags, the collection configuration will select one name based on the hash for collection. It cannot ensure that the selected name matches the one defined in the YAML file. |
__tag__:_pod_name_ | The name of the pod. |
__tag__:_namespace_ | The namespace to which the pod belongs. |
__tag__:_pod_uid_ | The unique identifier (UID) of the pod. |
Standard output
The following table describes the fields uploaded by default for each log in a Kubernetes cluster.
Field | Description |
_time_ | The time when the log was collected. |
_source_ | The type of the log source. Valid values: stdout and stderr. |
_image_name_ | The name of the image. |
_container_name_ | The name of the container. |
_pod_name_ | The name of the pod. |
_namespace_ | The namespace of the pod. |
_pod_uid_ | The unique identifier of the pod. |
References
After you collect logs, you can use the query and analysis feature of Simple Log Service to understand the logs. For more information, see Query and analyze logs.
After you collect logs, you can use the visualization feature of Simple Log Service to visually analyze and understand the logs. For more information, see Quick start: Create a dashboard.
After you collect logs, you can use the alerting feature of Simple Log Service to automatically receive notifications about exceptions in the logs. For more information, see Configure alert rules.
By default, Simple Log Service only collects incremental logs. To collect historical logs, see Import historical logs from log files.
Troubleshoot collection errors:
Check whether error messages are displayed in the console. For more information, see View Logtail collection errors.
If no error messages are displayed in the console, check the heartbeat of the machine group and the Logtail configuration. For more information, see Troubleshoot errors when collecting logs from containers.