Monitor ACK clusters across four layers: infrastructure, container, application, and business.
Observability of ACK
The ACK observability architecture consists of four layers, from bottom to top: infrastructure, container performance, application performance, and business.
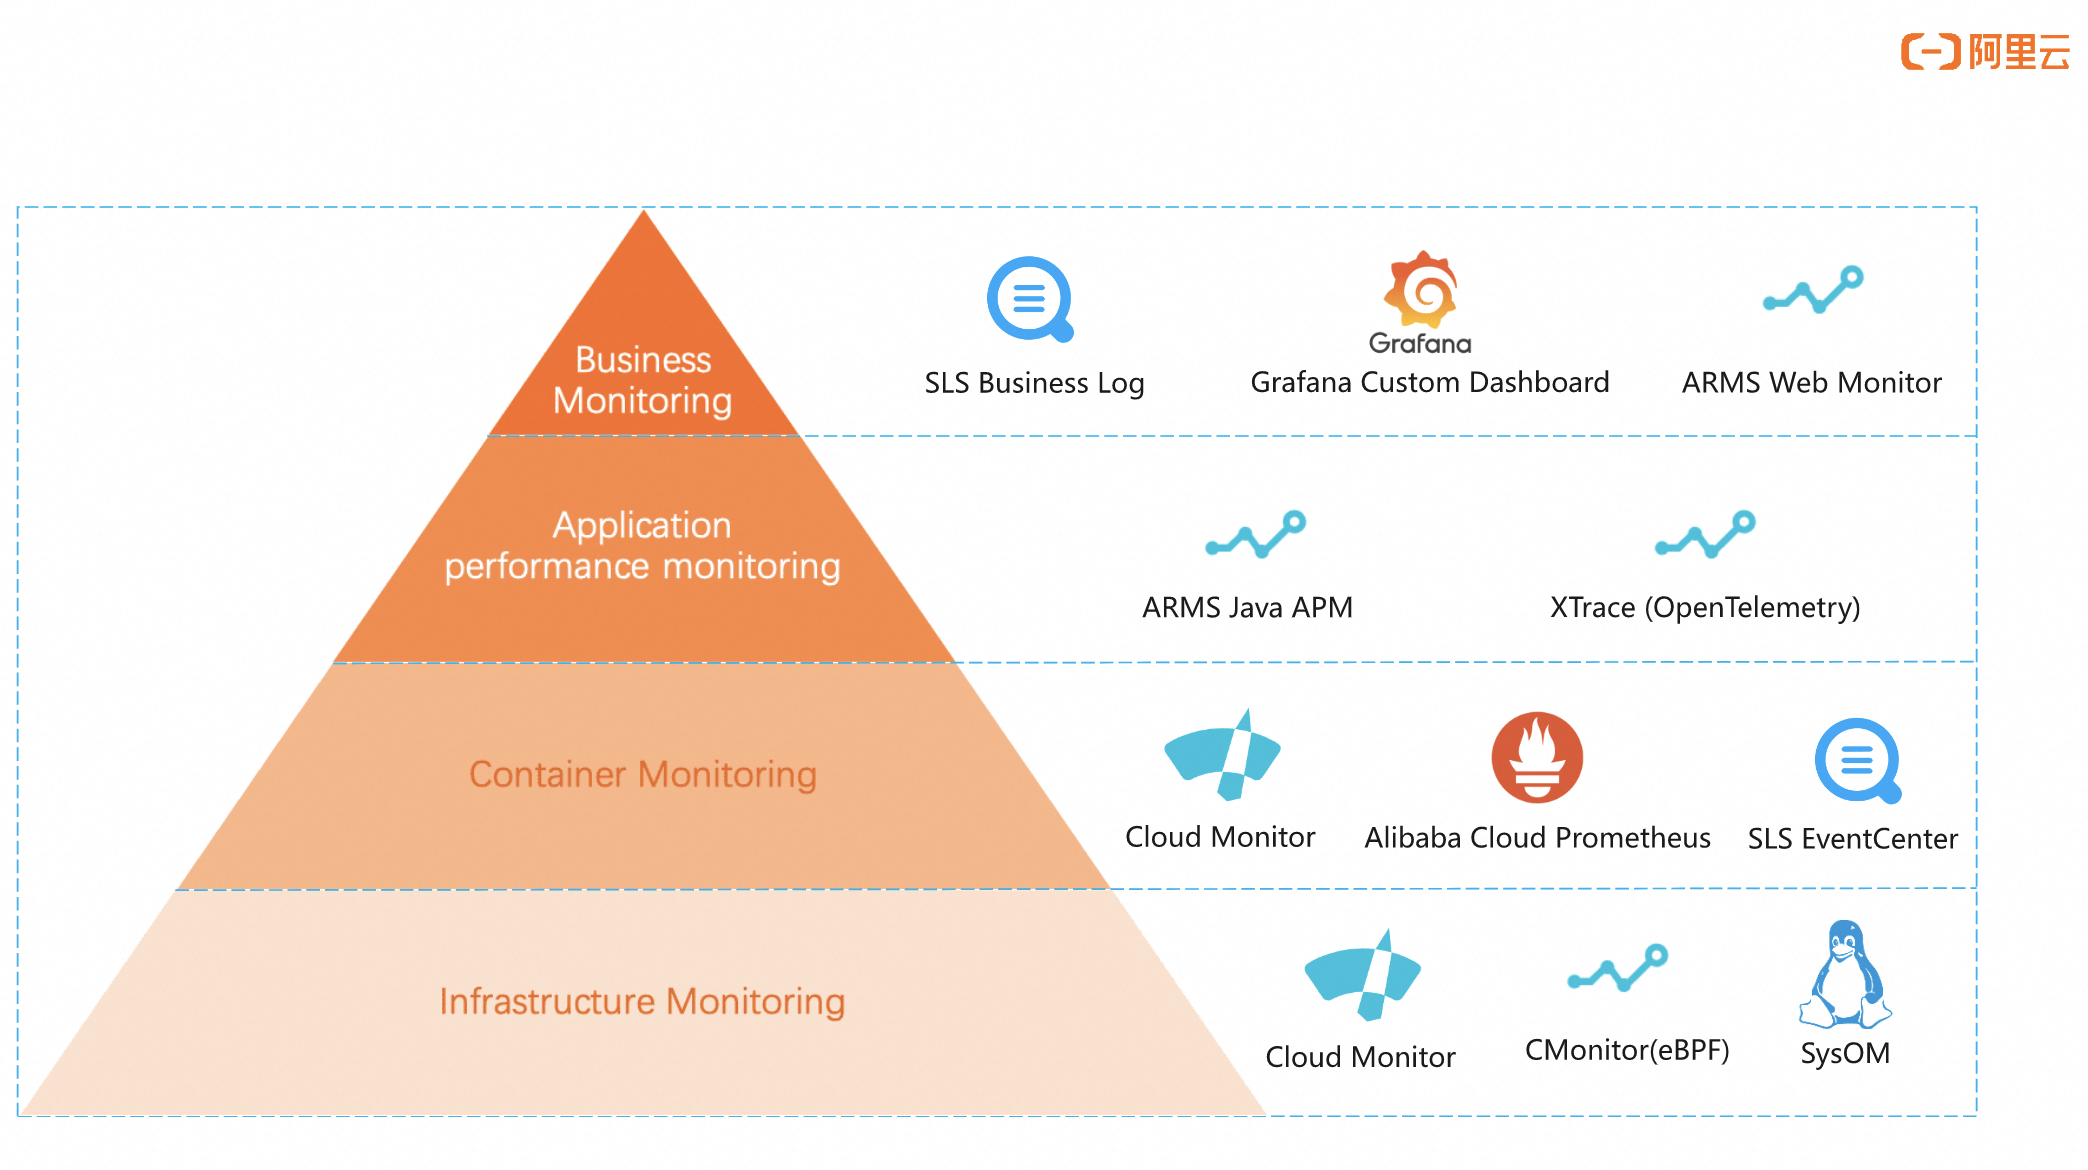
The following sections describe each layer.
Infrastructure observability
Monitors the underlying resources of ACK clusters, including pod and node resource pools, topological relationships, and host and network plugin performance.
Solution | Description | Scenario | References |
Visualized architecture discovery | ACK workloads run in node-based resource pools where pod traces and topological relationships are difficult to track. Kubernetes monitoring in ACK integrates Extended Berkeley Packet Filter (eBPF) and Managed Service for Prometheus for end-to-end metric collection, tracing, log analysis, and event monitoring with intrusion-free network and architecture awareness. | All scenarios.
| |
Kernel-level container monitoring | ACK provides kernel-level container monitoring based on System Observer Monitoring (SysOM) to help deploy, migrate, and monitor containerized applications. | All scenarios. | |
Collection of infrastructure metrics | Monitors CPU, memory, and network resource usage for ACK clusters. | All scenarios. |
Container performance observability
Monitors cluster, container, and component performance metrics, and detects cluster events.
Collect the performance metrics of clusters and containers
Solution | Description | Scenario | References |
Integration of Cloud Monitor with ACK | ACK monitors performance metrics for clusters and containers, with integrated visualization in the ACK console. | Limited scenarios. Custom container performance metrics and observability. | |
Managed Service for Prometheus | A fully managed monitoring service compatible with the open source Prometheus ecosystem. Provides ready-to-use dashboards for a wide range of components without self-managed monitoring infrastructure. Recommended. | All scenarios, such as microservices, component metric collection, and advanced observability customization. | See Connect to and configure Managed Service for Prometheus. |
Open source Prometheus | Available in the ACK console marketplace. | All scenarios, such as microservices (Service Mesh), component metric collection, and advanced observability customization. |
Monitor the events of clusters and containers
Solution | Description | Scenario | References |
Event monitoring | Supplements resource monitoring with real-time event capture for cluster anomaly diagnosis. Simple Log Service (SLS) recommended. | All scenarios. |
Application performance observability
Covers application metrics, tracing, and logging. For example, you can monitor thread counts of Java applications deployed in ACK.
Solution | Description | Scenario | References |
Intrusion-free APM for monitoring Java applications | Application Real-Time Monitoring Service (ARMS) provides intrusion-free APM for Java applications in ACK. Install the ARMS add-on to locate faulty and slow interfaces, tune parameters, detect memory leaks, and identify performance bottlenecks. Recommended. | Java application monitoring. Intrusion-free. | |
Code-instrumented APM | Tracing Analysis diagnoses performance bottlenecks in distributed architectures with trace mapping, request counting, topology visualization, and dependency analytics. Supports OpenTracing, OpenTelemetry, and various open source SDKs. | All scenarios, including microservices (Service Mesh) and multi-language applications. OpenTelemetry-compliant. Requires code instrumentation. | |
Managed Service for OpenTelemetry provides a set of tools for developing distributed applications. It collects trace data from your microservices, aggregates it in real time, and helps you pinpoint performance bottlenecks, map traces, count requests, display trace topologies, and analyze application dependencies across distributed architectures. This improves the efficiency of microservice development and diagnostics. | OpenTracing-compliant. Supports platforms such as Jaeger and Zipkin, and languages including Java, PHP, Go, Python, Node.js, .NET, C++, Ruby, and Swift. | See What is Tracing Analysis OpenTelemetry Edition? and Integration guide. |
Business observability
Tracks business-level statistics such as page views (PVs) and unique visitors (UVs), and supports cost auditing for applications deployed on ACK.
Solution | Description | Scenario | References |
Custom logging and monitoring | Customize application log content and format, collect logs with SLS, and configure dashboards for business monitoring or system auditing. Recommended. | All scenarios, such as traffic monitoring, cost auditing, and order trend analysis. | |
Custom dashboards with Managed Service for Grafana | Managed Service for Grafana is a cloud-native visualization platform with O&M-free runtime environments. Ingests data from Alibaba Cloud services such as databases, Message Queue, Prometheus, and SLS, and provides fine-grained monitoring dashboards. Analyze metrics, logs, and traces without managing servers or updates, with built-in security and high availability. | All scenarios. Configure dashboards for business needs, such as real-time PV and UV monitoring. | |
Business traffic and health monitoring with ARMS Browser Monitoring | Monitors web applications, Weex, and mini-programs by tracking page load speeds, JS error stability, and API call success rates. | Front-end JavaScript applications. |
References
Log monitoring: Log Management, Collect log data from containers by using SLS, and Configure Log4jAppender for Kubernetes and SLS.
Metrics: Java application monitoring, [Deprecated] Cluster topology monitoring, and Event monitoring.
Monitoring services and dashboards: Connect to and configure Managed Service for Prometheus, Ingress Dashboard, Monitor the CoreDNS component, Query Prometheus monitoring data by using PromQL, and SysOM kernel-level container monitoring.