By Xingji, Changjun, Youyi and Liutao
In Kubernetes scenarios, real-time memory usage statistics within containers (Pod Memory) are represented by WorkingSet (WSS).
The concept of WorkingSet is defined by Cadvisor for container scenarios.
WorkingSet is also a metric used by Kubernetes for scheduling decisions regarding memory resources, including node eviction.
Official definition: Kubernetes official website
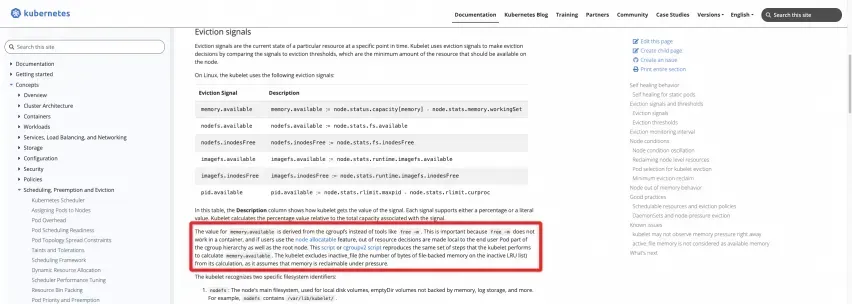
Two scripts can be run on the node to calculate the result directly:
#!/bin/bash
#!/usr/bin/env bash

# This script reproduces what the kubelet does
# to calculate memory.available relative to root cgroup.

# current memory usage
memory_capacity_in_kb=$(cat /proc/meminfo | grep MemTotal | awk '{print $2}')
memory_capacity_in_bytes=$((memory_capacity_in_kb * 1024))
memory_usage_in_bytes=$(cat /sys/fs/cgroup/memory/memory.usage_in_bytes)
memory_total_inactive_file=$(cat /sys/fs/cgroup/memory/memory.stat | grep total_inactive_file | awk '{print $2}')

memory_working_set=${memory_usage_in_bytes}
if [ "$memory_working_set" -lt "$memory_total_inactive_file" ];
then
    memory_working_set=0
else
    memory_working_set=$((memory_usage_in_bytes - memory_total_inactive_file))
fi

memory_available_in_bytes=$((memory_capacity_in_bytes - memory_working_set))
memory_available_in_kb=$((memory_available_in_bytes / 1024))
memory_available_in_mb=$((memory_available_in_kb / 1024))

echo "memory.capacity_in_bytes $memory_capacity_in_bytes"
echo "memory.usage_in_bytes $memory_usage_in_bytes"
echo "memory.total_inactive_file $memory_total_inactive_file"
echo "memory.working_set $memory_working_set"
echo "memory.available_in_bytes $memory_available_in_bytes"
echo "memory.available_in_kb $memory_available_in_kb"
echo "memory.available_in_mb $memory_available_in_mb" #!/bin/bash
# This script reproduces what the kubelet does
# to calculate memory.available relative to kubepods cgroup.
# current memory usage
memory_capacity_in_kb=$(cat /proc/meminfo | grep MemTotal | awk '{print $2}')
memory_capacity_in_bytes=$((memory_capacity_in_kb * 1024))
memory_usage_in_bytes=$(cat /sys/fs/cgroup/kubepods.slice/memory.current)
memory_total_inactive_file=$(cat /sys/fs/cgroup/kubepods.slice/memory.stat | grep inactive_file | awk '{print $2}')
memory_working_set=${memory_usage_in_bytes}
if [ "$memory_working_set" -lt "$memory_total_inactive_file" ];
then
memory_working_set=0
else
memory_working_set=$((memory_usage_in_bytes - memory_total_inactive_file))
fi
memory_available_in_bytes=$((memory_capacity_in_bytes - memory_working_set))
memory_available_in_kb=$((memory_available_in_bytes / 1024))
memory_available_in_mb=$((memory_available_in_kb / 1024))
echo "memory.capacity_in_bytes $memory_capacity_in_bytes"
echo "memory.usage_in_bytes $memory_usage_in_bytes"
echo "memory.total_inactive_file $memory_total_inactive_file"
echo "memory.working_set $memory_working_set"
echo "memory.available_in_bytes $memory_available_in_bytes"
echo "memory.available_in_kb $memory_available_in_kb"
echo "memory.available_in_mb $memory_available_in_mb"As observed, the WorkingSet memory for a node is the memory usage of the root cgroup, minus the cached portion labeled as Inactive(file). Similarly, the WorkingSet memory for a container within a Pod is the cgroup memory usage for that container, minus the cached portion labeled as Inactive(file).
In the kubelet of the real running Kubernetes, the actual code of this part of the metric logic provided by Cadvisor is as follows:
From the Cadvisor Code, you can clearly see the definition of the working memory of the WorkingSet:
The amount of working set memory, this includes recently accessed memory,dirty memory, and kernel memory. Working set is <= "usage".The specific code implementation of Cadvisor for WorkingSet calculation:
inactiveFileKeyName := "total_inactive_file"
if cgroups.IsCgroup2UnifiedMode() {
  inactiveFileKeyName = "inactive_file"
}
workingSet := ret.Memory.Usage
if v, ok := s.MemoryStats.Stats[inactiveFileKeyName]; ok {
  if workingSet < v {
    workingSet = 0
  } else {
    workingSet -= v
  }
}During the process of providing container support services to a vast number of users, the ACK team has found that many customers encounter memory issues within containers when deploying their business applications in a containerized environment. The ACK team and the Alibaba Cloud operating system team have accumulated experience in dealing with a large number of customer issues and summarized the following common user issues regarding container memory:
There is a gap between the host memory usage rate and the container aggregate usage rate by node. The host memory usage rate is about 40%, and the container memory usage rate is about 90%.
The high probability is because the WorkingSet of the pods of the container contains caches such as PageCache.
The memory value of the host does not include the cache, such as PageCache and Dirty Memory, but WorkingSet does.
The most common scenario involves containerizing Java applications. Java application logging with Log4J, and its very popular implementation Logback, will by default have an "extremely simple" Appender that starts using NIO (Non-blocking I/O) and employs mmap (memory-mapped files) to handle Dirty Memory. This increases the number of memory caches and the number of WorkingSet in pods.
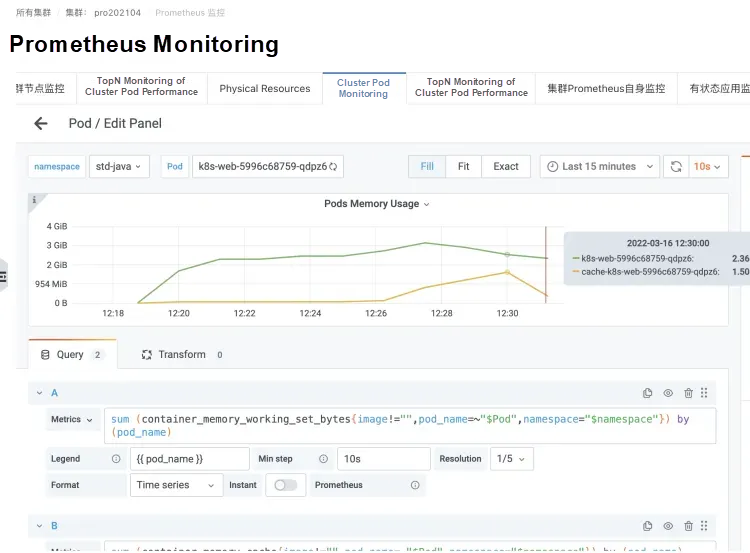
*Scenarios for writing logs by using Logback in pods of a Java application
Instances that cause increased cache memory and WorkingSet memory*
Run the top command in the Pod. The obtained value is smaller than the value of the working memory (WorkingSet) that the kubectl top pod can view.
When executing the top command using exec in a Pod, due to issues such as container runtime isolation, it actually bypasses the container isolation and retrieves the top monitoring values from the host machine.
Therefore, what you see is the memory value of the host, which does not contain Cache, such as PageCache, Dirty Memory, etc., while the working memory contains this part, so it is similar to FAQ 1.
Pod Memory Black Hole Issues
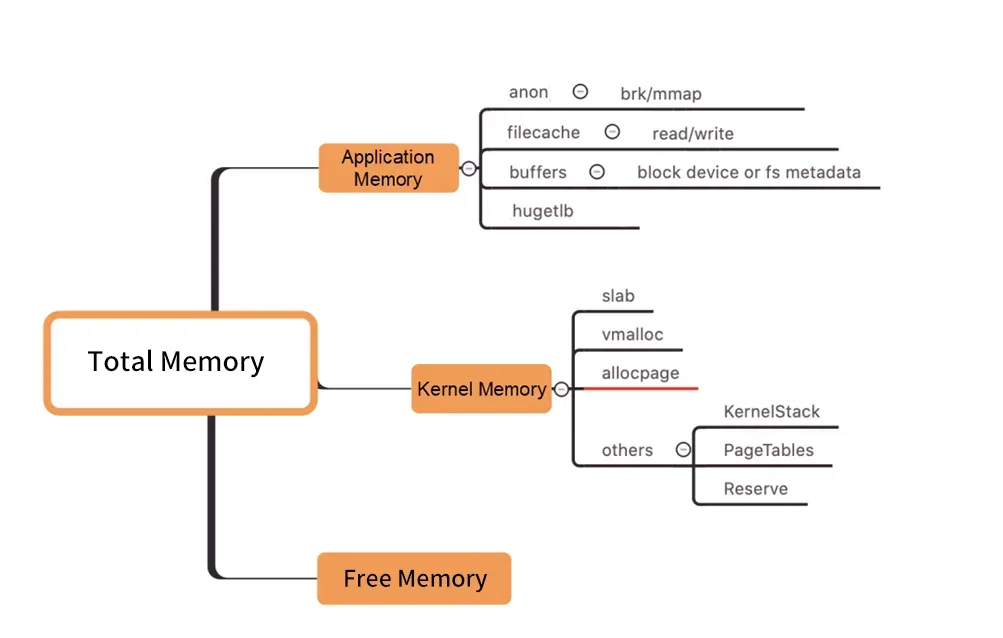
Figure /Kernel Level Memory Distribution
As shown in the preceding figure, a Pod WorkingSet does not include the Inactive (anno) parameter, which means other parts of Pod memory used by users do not meet expectations. This may lead to an increase in the WorkingSet workload and even node eviction.
Finding the real cause of the surge in working memory among numerous memory components is like navigating a black hole, hence the term "memory black hole".
In most cases, memory reclaim latency occurs when the memory usage of a WorkingSet is high. How do we resolve this issue?
Capacity planning (direct scaling) is a general solution to solve the problem of high resources.
However, to diagnose memory issues, it is essential first to clearly identify which specific memory is held by which process or resource (such as a file). Then, targeted convergence optimization can be performed to ultimately resolve the issue.
Firstly, how to analyze kernel-level container memory metrics in the operating system? The ACK team and the operating system team have collaborated to provide the container monitoring feature SysOM (System Observer Monitoring) in the kernel layer of the operating system. This feature is unique to Alibaba Cloud. You can view the Pod Memory Monitor dashboard in the SysOM Container System Monitoring-Pod Dimension section to view the detailed memory usage distribution of pods, as shown in the following figure.
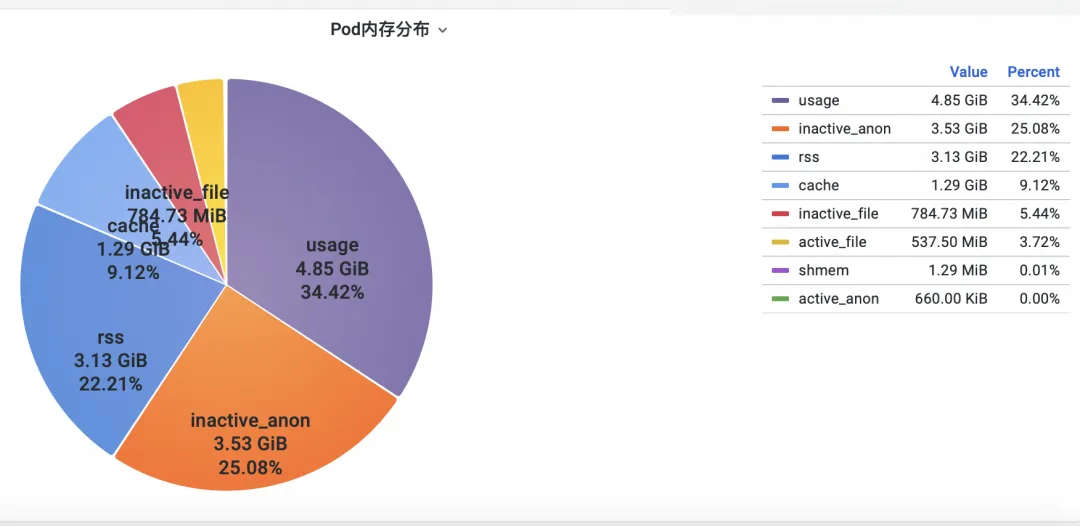
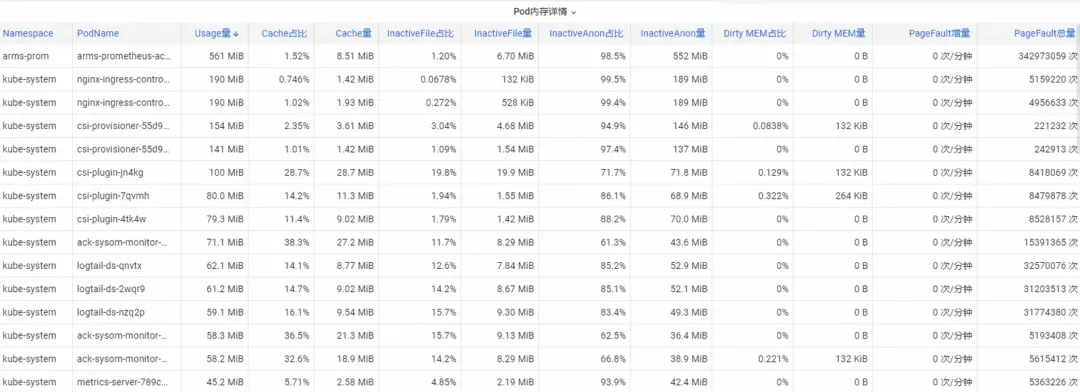
SysOM container system monitoring allows you to view the detailed memory composition of each pod in a fine-grained manner. You can monitor the memory of pods based on different memory components, such as Pod cache, InactiveFile, InactiveAnon, and Dirty Memory. In this way, you can identify common memory black hole problems in pods.
For Pod File Cache, you can monitor both the PageCache usage for currently open and closed files in the Pod (delete the corresponding files can release the associated cache memory).

Many deep-level memory consumptions cannot be easily converged, even when users have a clear understanding of them. For instance, PageCache and other memory types that are uniformly reclaimed by the operating system require users to make intrusive code changes, such as adding flush() to Log4J's Appender to periodically call sync().
https://stackoverflow.com/questions/11829922/logback-file-appender-doesnt-flush-immediately
This is very unrealistic.
To address this issue, the Container Service team has introduced the Koordinator QoS fine-grained scheduling feature, which is implemented on Kubernetes and controls the operating system's memory parameters.
When the hybrid SLO feature is enabled for a cluster, the system prioritizes ensuring the memory QoS of latency-sensitive pods, thus delaying their triggering of overall memory reclamation.
In the figure below, memory.limit_in_bytes represents the memory usage limit, memory.high denotes the memory throttling threshold, memory.wmark_high indicates the memory background reclaim threshold, and memory.min signifies the memory usage lock threshold.
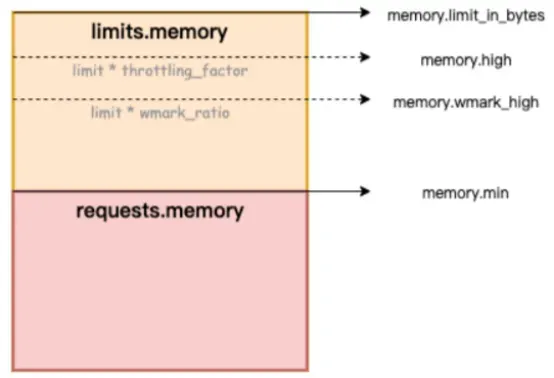
Figure /ACK-Koordinator provides Quality of Service (QoS) assurance for memory services in containers.
How to fix the memory black hole problem? Alibaba Cloud Container Service uses the fine-grained scheduling feature and relies on the open-source Koordinator project, ACK-Koordinator, to provide memory QoS (Quality of Service) capability for containers. This improves the memory performance of applications at runtime on the premise of ensuring the fairness of memory resources. This article describes the memory QoS feature of containers. For more information, please refer to Container Memory QoS.
Containers primarily have the following two constraints when using memory:
1) Memory limit: When a container’s memory (including PageCache) approaches its limit, it triggers memory reclamation at the container level. This process can affect the performance of memory allocation and release for applications within the container. If the memory request is not satisfied, the container OOM is triggered.
2) Node memory limit: When container memory is oversold (Memory Limit > Request), leading to insufficient memory on the node, it triggers global memory reclamation at the node level. This process can significantly impact performance and, in extreme cases, may even cause system-wide issues. If the reclamation is insufficient, the container OOM Kill is selected.
To address the preceding typical container memory issues, ACK-Koordinator provides the following enhanced features:
1) Container memory reclamation usage in the background: When the memory usage of the pod is close to the limit, some memory is asynchronously reclaimed in the background to mitigate the performance impact caused by direct memory reclamation.
2) Container memory lock reclaim and throttling level: A more equitable memory reclamation is implemented among pods. When the memory resources of the entire pod are insufficient, memory is preferentially reclaimed from the pods that have exceeded the memory usage (Memory Usage>Request). This prevents the degradation of the overall memory resources caused by individual pods.
3) Differentiated guarantees for overall memory reclamation: In the BestEffort memory oversold scenario, the memory running quality of Guaranteed and Burstable pods is preferentially guaranteed.
For more information about the kernel capabilities enabled by ACK container memory QoS, see Overview of Alibaba Cloud Linux Kernel Features and Interfaces.
After you detect the memory black hole problem in containers, you can use the fine-grained scheduling feature of ACK to select memory-sensitive pods and enable the memory QoS feature. By doing so, a closed-loop fix can be achieved.
[1] ACK SysOM
[2] Best Practice Document
[3] SysOM Container Monitoring from the Kernel's Perspective
Best Practices for AI Model Inference Configuration in Knative
Alibaba Cloud Service Mesh (ASM): Efficient Traffic Management with Gateway API

229 posts | 34 followers
FollowOpenAnolis - January 24, 2024
OpenAnolis - February 2, 2026
OpenAnolis - February 27, 2023
tianliuliu123456 - June 11, 2021
Alibaba Cloud Native Community - September 8, 2025
Alibaba Cloud Native Community - July 31, 2025

229 posts | 34 followers
Follow Container Service for Kubernetes
Alibaba Cloud Container Service for Kubernetes is a fully managed cloud container management service that supports native Kubernetes and integrates with other Alibaba Cloud products.
Learn More ACK One
Provides a control plane to allow users to manage Kubernetes clusters that run based on different infrastructure resources
Learn More Container Compute Service (ACS)
A cloud computing service that provides container compute resources that comply with the container specifications of Kubernetes
Learn More Cloud-Native Applications Management Solution
Accelerate and secure the development, deployment, and management of containerized applications cost-effectively.
Learn MoreMore Posts by Alibaba Container Service