By Yin Binbin and Zhou Xu

In cloud computing and containerized deployments, cloud-native containers have become the industry standard. While they bring the advantages of efficient deployment and cost control, they also introduce new challenges:
• Complex resource management: The dynamic environment makes conventional troubleshooting methods difficult to apply.
• Lack of transparency: The opaque nature of the container engine layer makes it hard to pinpoint memory issues, such as memory leaks.
• Performance issues: Issues like high memory usage and jitter under heavy loads can affect system stability.
• Limitations of conventional methods: Troubleshooting based on monitoring data is time-consuming and inefficient. Hidden issues are hard to discover, increasing O&M costs.
To improve system O&M efficiency in cloud-native scenarios, Alibaba Cloud, a managing board member of the OpenAnolis community, has launched an all-in-one OS service platform—the Alibaba Cloud OS Console (hereinafter "the Console"). The Console aims to provide users with convenient, efficient, and professional OS lifecycle management capabilities. It is dedicated to delivering superior OS capabilities, enhancing OS usage efficiency, and offering a new OS experience. The Console is deeply integrated with the Anolis OS and already supports Anolis OS 7.9 and Anolis OS 8.8. Using the OS memory panorama feature, users can perform one-click scans to diagnose their systems, quickly locating and resolving issues within the Anolis OS. This boosts O&M efficiency, reduces costs, and significantly increases system stability.
Implicit memory usage refers to system memory consumption caused by business operations that is not directly accounted for or reflected back to the business processes. Because this memory usage is often not detected in a timely manner on the business side, it can be easily overlooked, leading to excessive memory consumption and seriously impacting system performance and stability, especially in high-load environments and complex systems.
File cache improves file access performance and is theoretically reclaimable when memory is low. However, a high file cache in production environments also triggers many issues.
• File cache reclamation directly impacts business response time (RT), leading to significant latency, especially in high-concurrency environments. The result is a sharp decline in user experience. For example, during peak shopping hours on an e-commerce website, latency from file cache reclamation might cause user shopping and payment processes to stall.
• In a Kubernetes environment, the workingset includes active file cache. If this active cache becomes too high, it directly affects Kubernetes scheduling decisions, preventing containers from being efficiently scheduled to suitable nodes, thereby impacting application availability and overall resource utilization. In a Redis caching system, a high file cache can affect cache query speeds, especially during high-concurrency read/write operations, where performance bottlenecks are likely to occur.
SReclaimable memory consists of kernel objects cached by the OS to enable its own functionalities. Although it is not counted as application memory, application behavior influences the level of SReclaimable memory. While SReclaimable memory can be reclaimed when memory is low, the jitter during the reclamation process can decrease business performance. This jitter may lead to system instability, especially under high load. For example, in financial trading systems, memory jitter might cause trade processing delays, affecting transaction speed and accuracy. Furthermore, high SReclaimable memory can also mask actual memory consumption, creating difficulties for O&M monitoring.
Cgroups and namespaces are key components underpinning container technology. The frequent creation and destruction of containers in business operations often leads to cgroup residue, causing inaccurate statistics and system jitter. Cgroup leakage not only distorts resource monitoring data but may also trigger system performance issues, and even lead to resource waste and system unpredictability. This type of issue is particularly prominent in large-scale clusters, seriously threatening stable cluster operation. For example, in an ad delivery system, the frequent creation and destruction of large-scale containers might cause cgroup leakage, triggering system jitter and thereby affecting ad delivery accuracy and click-through rates.
During an out-of-memory event, commonly used commands like top often cannot accurately pinpoint the cause of memory consumption. Typically, this consumption is caused by drivers like GPUs or network interface controllers (NICs), but general observability tools do not cover these memory areas. For example, GPU memory consumption is massive during AI model training, but monitoring tools might not indicate the specific whereabouts of the memory. O&M engineers only see that free memory is low and find it difficult to diagnose the cause. This not only prolongs troubleshooting but may also allow faults to spread, ultimately compromising system stability and reliability.
Of the four implicit memory scenarios, a high file cache footprint is the most common. Let's take this scenario and walk you through how we explored and ultimately solved this real-world challenge.
When file cache is high, what we really want to know is: which processes reading which files are causing the cache?
Tracing a memory page back to a specific file name is a multi-step journey. The most critical steps are mapping the page to an inode and then the inode to the file name. To do this across an entire system, we need two key capabilities:
• The ability to cyclically scan all file cache pages in the system; and
• The ability to cyclically parse the corresponding file name based on the inode.

We also researched and analyzed the pros and cons of multiple approaches.
| Solution | Pros | Cons |
|---|---|---|
| Driver modules (.ko files) | Simple to implement | Highly intrusive, with a risk of crashes, and difficult to adapt to numerous kernel versions |
| eBPF | No crash risk, excellent compatibility | Lacking cyclic scanning capability |
| mincore system call | Based on a standard system call | Incapable of scanning closed files |
| kcore | Full system scanning capabilities | High CPU consumption |
In the end, we chose to build our solution on kcore for its ability to scan all memory. However, we had to overcome several major hurdles:
We tackled kcore's challenges head-on and successfully engineered a way to parse file cache.
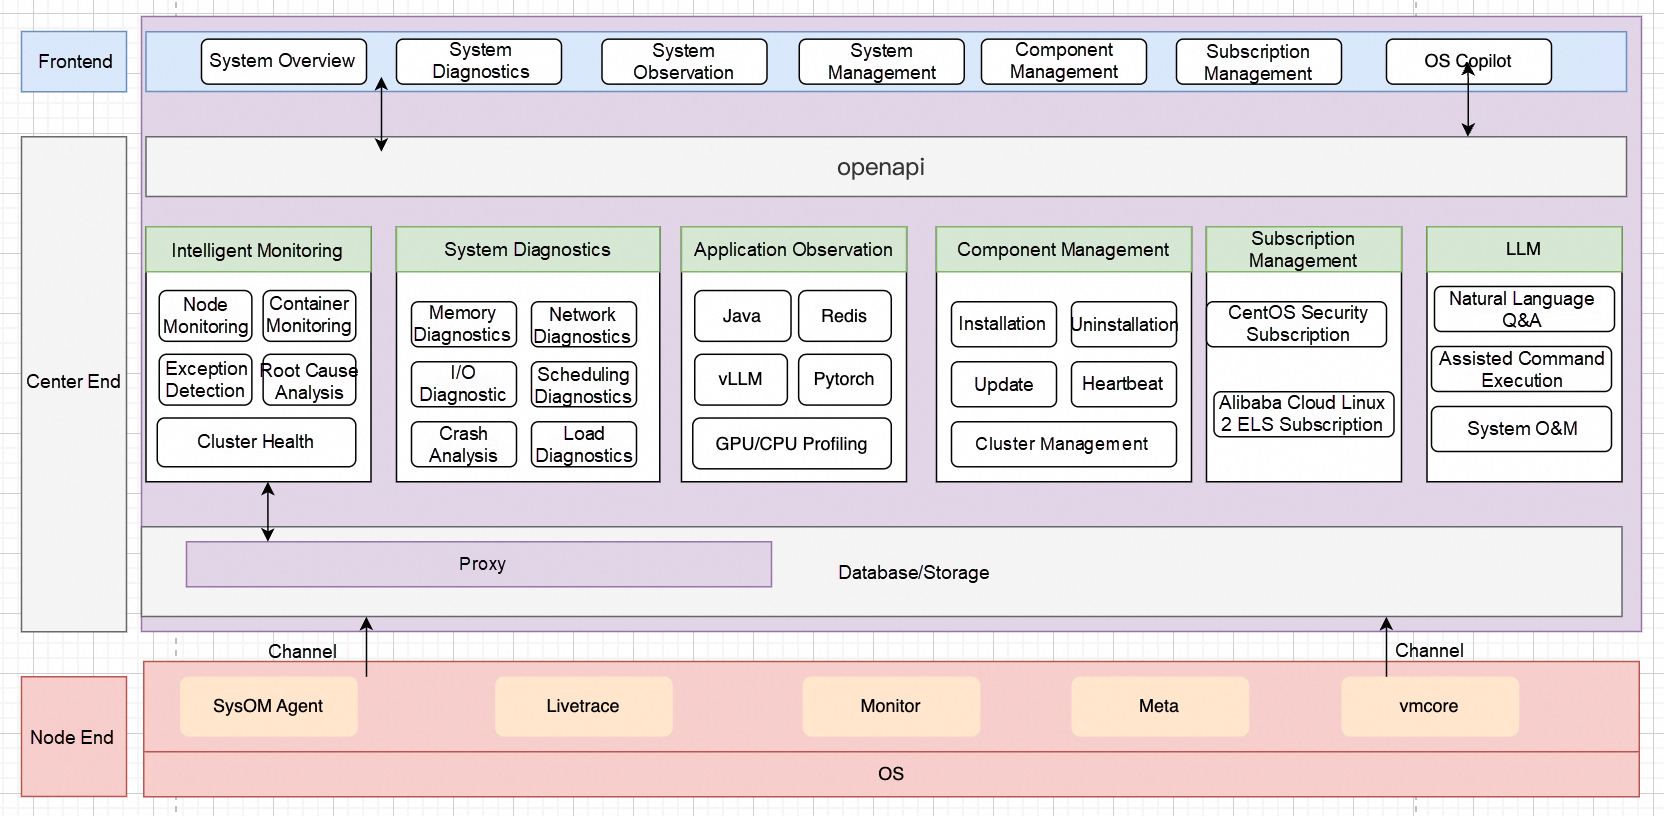
The Console is the latest all-in-one O&M management platform launched by Alibaba Cloud, fully incorporating our rich experience in operating millions of servers. The Console brings together core features like monitoring, system diagnostics, continuous tracking, AI observability, cluster health check, and an OS Copilot. It is specifically engineered to tackle the thorniest cloud and container issues, such as high load, crashes, network latency and jitter, memory leaks, OOM errors, I/O spikes, excessive I/O traffic, and general performance anomalies. The Console provides you with comprehensive system resource monitoring, incident analysis, and troubleshooting capabilities, all with the goal of optimizing system performance and dramatically boosting O&M efficiency and business stability.
Here is its overall architecture.

Kubernetes is an open source container orchestration platform that enables automated deployment, scaling, and management of containerized applications. Its powerful, flexible architecture simplifies O&M at scale. However, while enterprises enjoy the convenience of Kubernetes, they also face new challenges.
Alibaba Cloud OS Console (URL for PCs): https://alinux.console.aliyun.com/
In a Kubernetes cluster, workingset is a key metric used to monitor and manage container memory usage. When a container's memory usage exceeds its set limit or a node experiences substantial memory consumption, Kubernetes decides whether to evict or terminate the container based on the workingset value.
• Workingset is calculated using the following formula:
Workingset = Anonymous Memory + active_file. Anonymous memory is typically allocated by applications using the new operator, malloc function, or mmap system call, while active_file is introduced by processes reading and writing files. This file cache is often opaque to applications and is a frequent source of memory issues.
A customer noticed through container monitoring that the workingset memory for a specific pod in their Kubernetes cluster was continuously rising, but they couldn't pinpoint the exact cause.

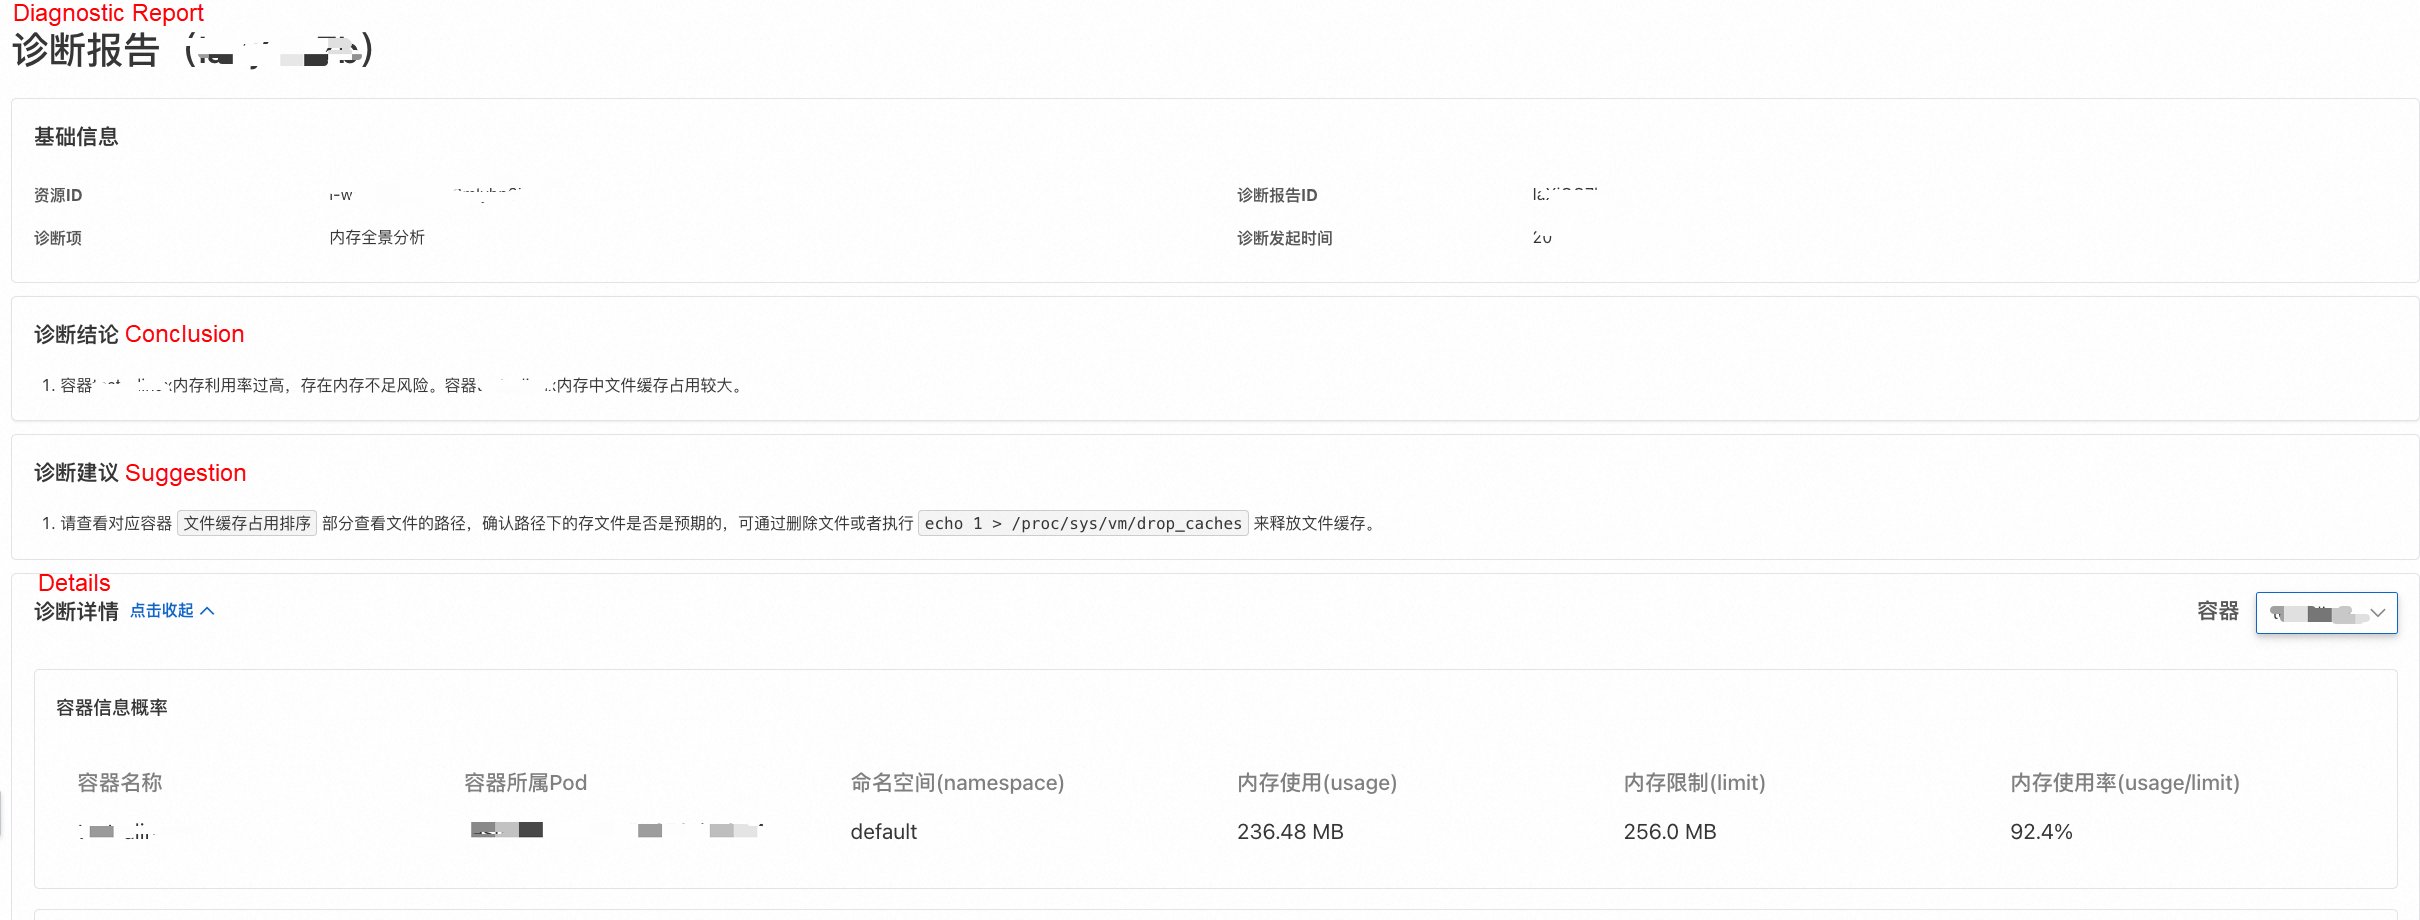
For this scenario, we first identified the Elastic Compute Service (ECS) instance hosting the problematic pod. Then, using the Console's memory panorama feature, we selected the ECS instance, then the specific pod, and initiated a diagnosis. Here is a screenshot of the results.

Specific file paths and their cache sizes were identified:

• First, the diagnostic report stated upfront: "The memory usage of container xxx is too high, posing an out-of-memory risk. File cache occupies a significant portion of the memory of container xxx."
• Second, following the report's guidance, we checked the Container File Cache Ranking table, which showed the top 30 files occupying the most shared memory cache. The top two entries were log files within the container, together occupying nearly 228 MB of file cache. The File Name column displays the container file's path on the host, with the container's internal directory path starting after /var/lib/containerd/io.containerd.snapshotter.v1.overlayfs/snapshots/3604/fs/.
Based on this analysis, it was clear that the customer's application was actively creating, reading, and writing log files in the container's /var/log directory, generating significant file cache. To prevent the pod's workingset from hitting its limit and triggering direct memory reclamation—which blocks processes and causes latency—we recommended several measures tailored to their business needs:
In another case, a customer found that on long-running machines, the free -h command showed very little free memory, with a large amount under buff/cache. They researched the issue and tried manually releasing the cache by executing echo 3 > /proc/sys/vm/drop_caches. They discovered that while this method reclaimed some cache, a large amount stubbornly remained.

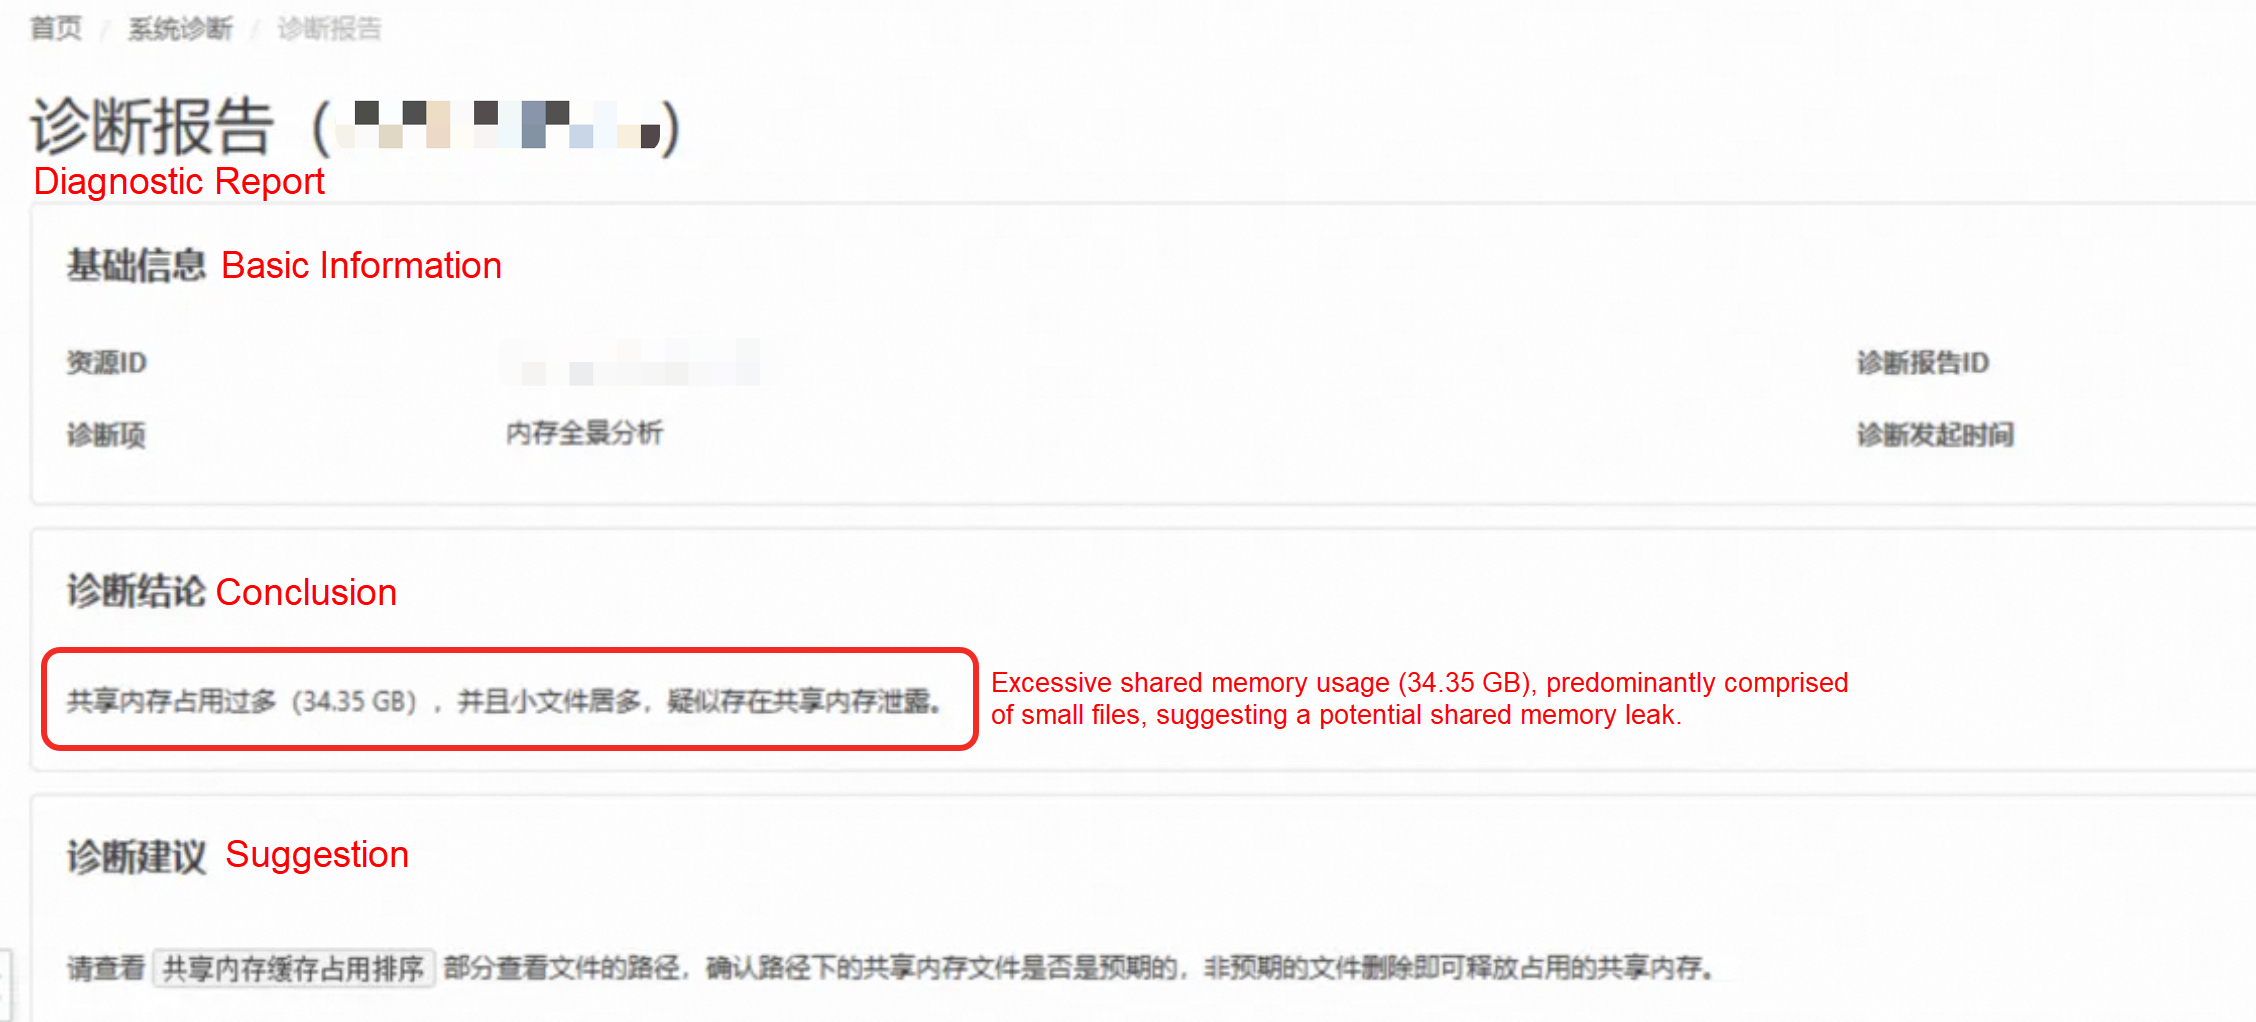
For this scenario, they performed a memory panorama diagnosis on the target ECS instance using the Console. The Console provided a direct diagnosis.


• First, the report gave a clear conclusion: Excessive shared memory usage (34.35 GB), predominantly comprised of small files, suggesting a potential shared memory leak.
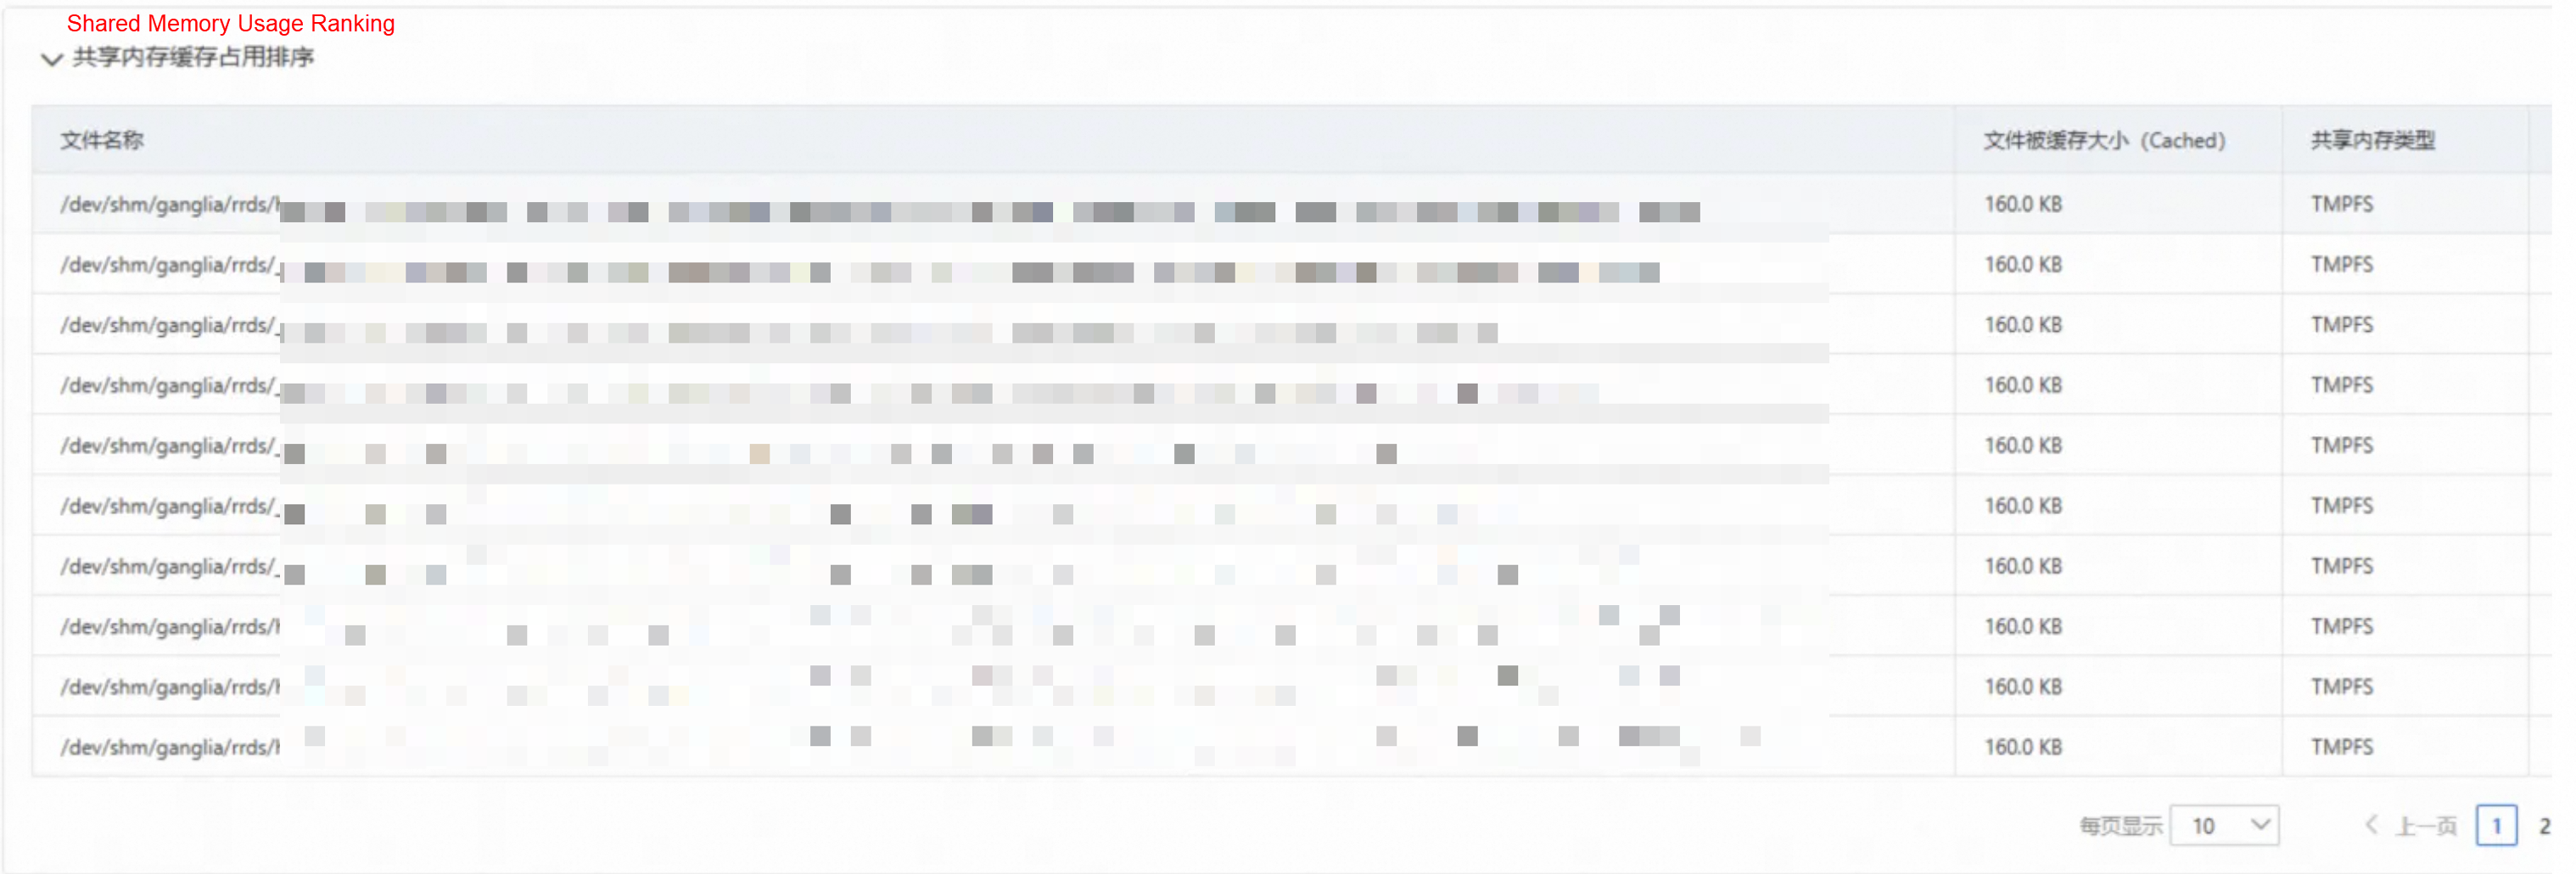
• Second, the Shared Memory Cache Ranking table revealed the top 30 files occupying shared memory. The largest files were only about 160 KB each, confirming the report's conclusion that there were numerous small shared memory file leaks. At the same time, the File Name column showed that these files were all located in the /dev/shm/ganglia/ directory.
This analysis pinpointed the issue: the customer's application was creating shared memory files in the /dev/shm/ganglia/ directory but failing to release them properly. The solution was straightforward: evaluate whether these files were indeed leaks and delete them to immediately free up the cached memory.
By using the Console to tackle high memory usage, customers gain concrete advantages:
In short, the Console opens up new possibilities for cloud and containerized operations. It elevates system performance and O&M efficiency while relieving the headaches caused by system issues.
Next, we will continue to evolve the Console's capabilities:
• Supercharging AI-powered O&M: We will integrate both large and small AI models to enhance the prediction and diagnosis of system anomalies, delivering even smarter O&M recommendations.
• Expanding compatibility: We will optimize the Console's compatibility with more cloud services and extend support to more OS versions, making it applicable across diverse IT environments.
• Enhancing monitoring and alerting: We will provide more comprehensive OS monitoring metrics, support the detection of a wider range of anomalies, and integrate robust alerting mechanisms to help enterprises spot and address potential issues early.
Stay tuned for our next article, where we'll dive into more real-world cases to explore the Console's role in more scenarios and the tangible value it delivers.
Alibaba Dragonwell 21 AI Extension: Unleash Java's Performance Potential in the AI Era
OOM: Kill Processes or Endure Application Stutter? How to Decide?

105 posts | 6 followers
FollowOpenAnolis - May 19, 2022
OpenAnolis - May 8, 2023
OpenAnolis - June 1, 2023
OpenAnolis - December 7, 2022
OpenAnolis - December 8, 2022
OpenAnolis - July 18, 2024

105 posts | 6 followers
Follow Bastionhost
A unified, efficient, and secure platform that provides cloud-based O&M, access control, and operation audit.
Learn More Managed Service for Grafana
Managed Service for Grafana displays a large amount of data in real time to provide an overview of business and O&M monitoring.
Learn More Container Service for Kubernetes
Alibaba Cloud Container Service for Kubernetes is a fully managed cloud container management service that supports native Kubernetes and integrates with other Alibaba Cloud products.
Learn More ACK One
Provides a control plane to allow users to manage Kubernetes clusters that run based on different infrastructure resources
Learn MoreMore Posts by OpenAnolis