By Zeng Fansong, senior technical expert for the Alibaba Cloud Container Platform, and Chen Jun, systems technology expert at Ant Financial.
This article will take a look at some of the problems and challenges that Alibaba and its ecosystem partner Ant Financial had to overcome for Kubernetes to function properly at mass scale, and will cover the solutions proposed to the various problems the Alibaba engineers encountered. Some of these solutions include improvements to the underlying architecture of the Kubernetes deployment, such as enhancements to the performance and stability of etcd, the kube-apiserver, and kube-controller. These were all crucial for Alibaba to ensure the support needed for the 2019 Tmall 618 Shopping Festival to take full advantage of the 10,000-node Kubernetes cluster deployment. They are also important lessons for any enterprise interested in following Alibaba's footsteps.
Starting from the very first AI platform developed by Alibaba in 2013, Alibaba's managing cluster has gone through several stages of evolution before it went completely Kubernetes in 2018. In this article, we're going to specifically take a look at some of the challenges of applying Kubernetes on such a mass scale, and some of the optimizations and fixes necessary to make everything work properly.
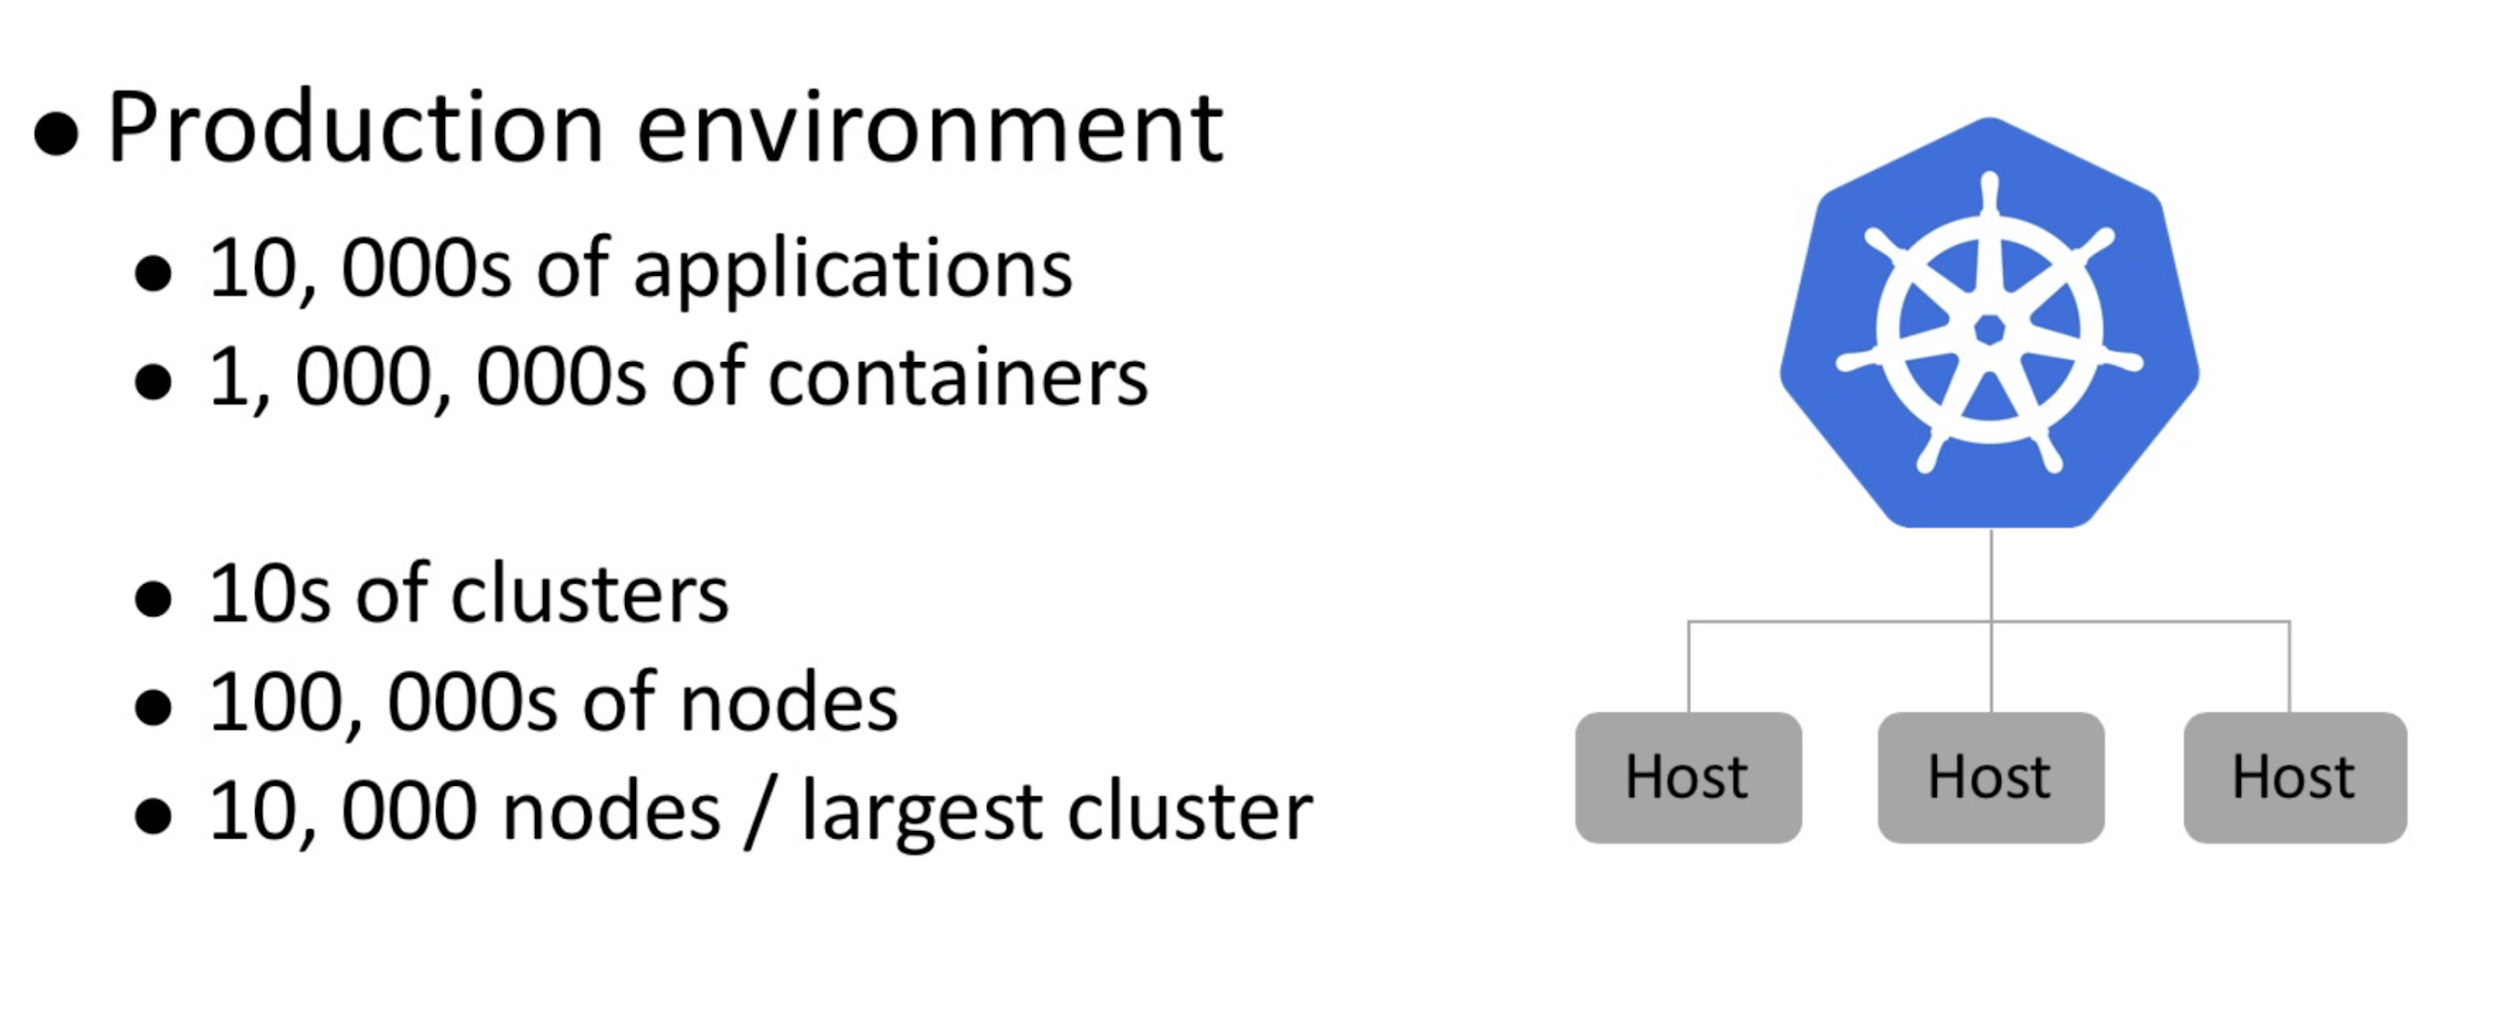
The production environment of Alibaba consists of more than 10,000 containerized applications, with the entire network of Alibaba being a massive system using millions of containers running on more than 100,000 hosts. The core e-commerce business of Alibaba runs on more than a dozen clusters, the largest of which includes tens of thousands of nodes. Many challenges had to be solved when Alibaba decided to go all in on Kubernetes, implementing it throughout the whole of their system. One of the biggest challenges, of course, was how to apply Kubernetes in an ultra-large scale production environment.
As the saying goes, Rome was not built in one day. To understand the performance bottleneck of Kubernetes, the team of engineers at Alibaba Cloud needed to estimate the scale of a cluster with 10,000 nodes based on the production cluster configuration, which was as follows:
For more details, consider this following graphic:
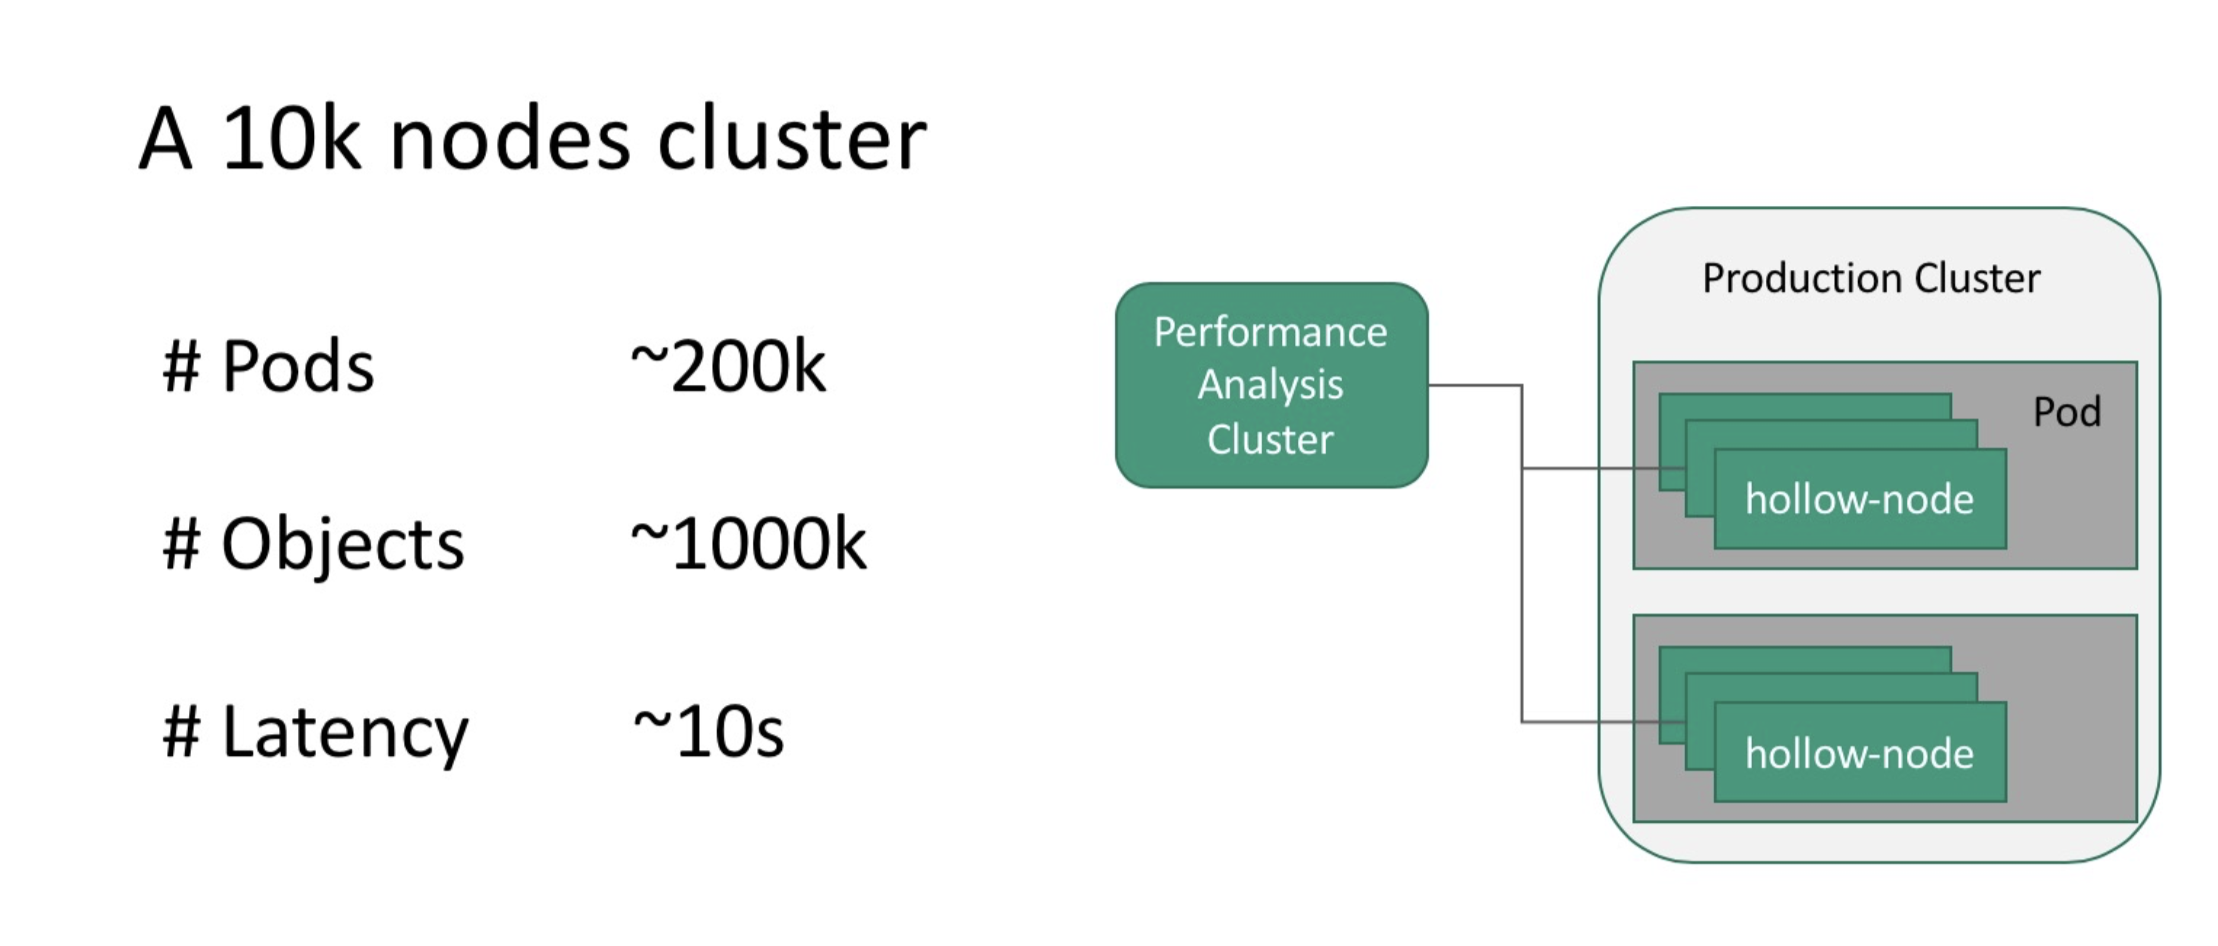
The team built a large cluster simulation platform based on Kubemark to simulate a kubelet with 10,000 nodes based on 200 4-core containers by starting 50 Kubemark processes through one container. When running common loads in the simulated cluster, the team encountered extremely high latency, up to 10s in fact, for some basic operations such as pod scheduling. Moreover, the cluster was also unstable.
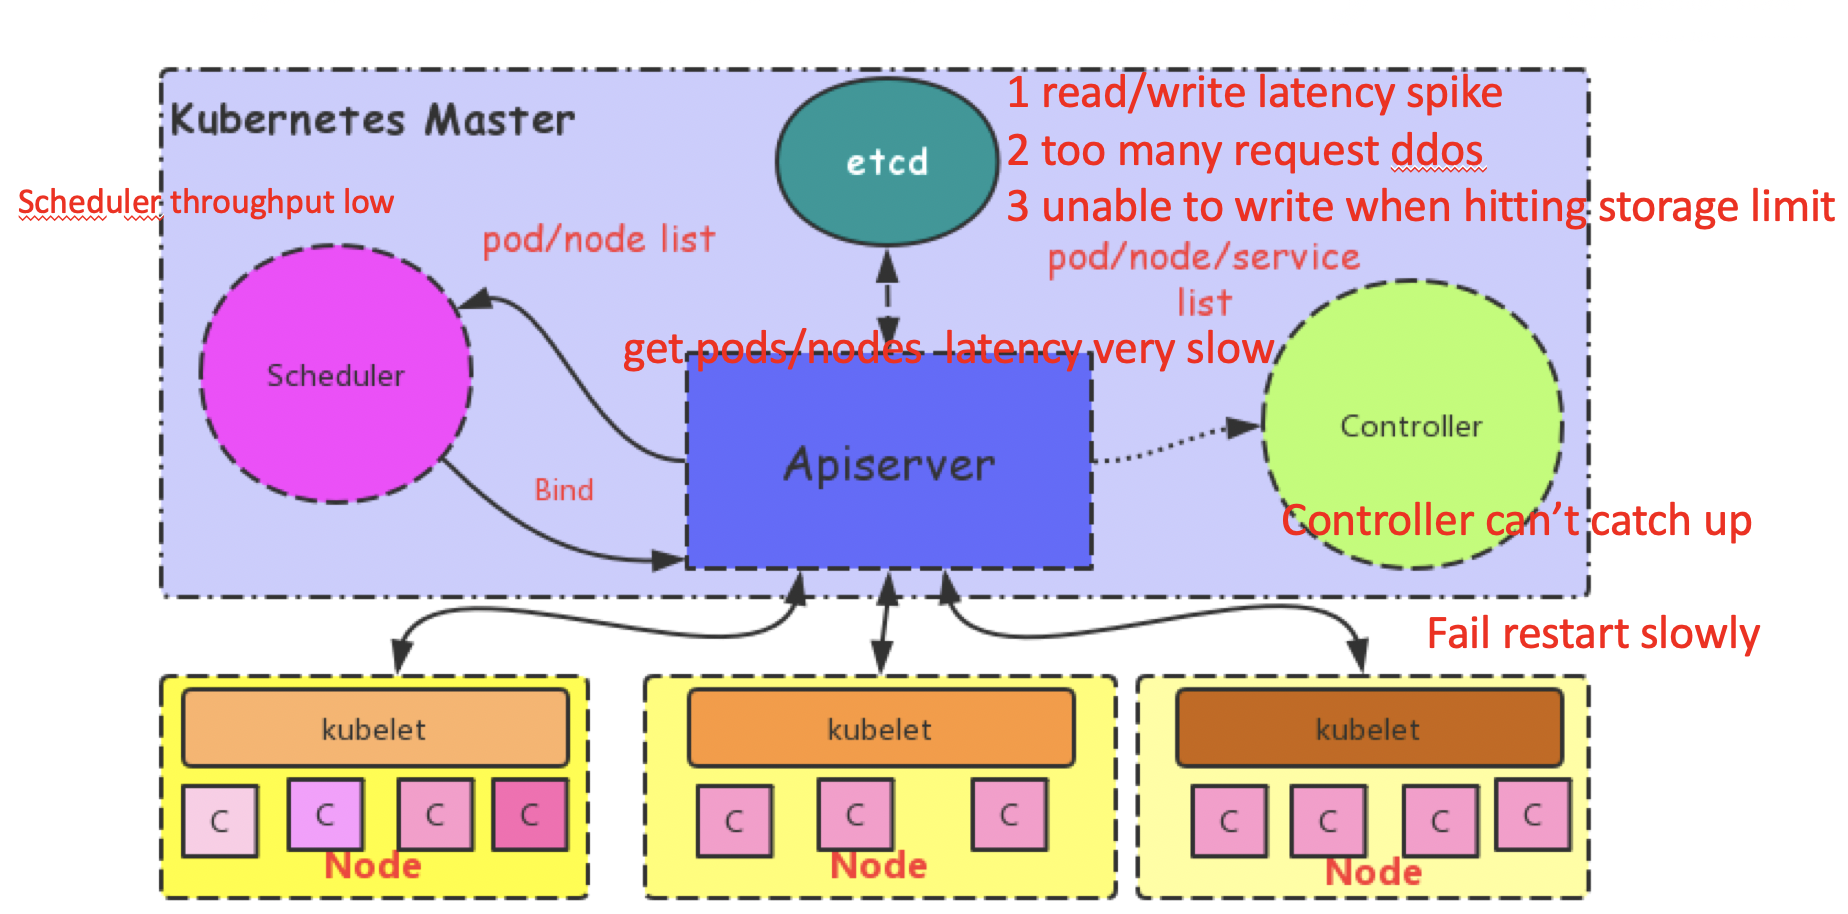
To summarize the information covered in the graphic above, what the team noticed was that, with Kubernetes clusters with 10,000 nodes, several system components experienced the following performance problems:
To solve these problems, the team of engineers at Alibaba Cloud and Ant Finanical made comprehensive improvements to Alibaba Cloud Container Platform so to improve the performance of Kubernetes in these large-scale applications.
The first system component they improved was etcd, which is the database that stores objects for Kubernetes, having an important role in a Kubernetes cluster.
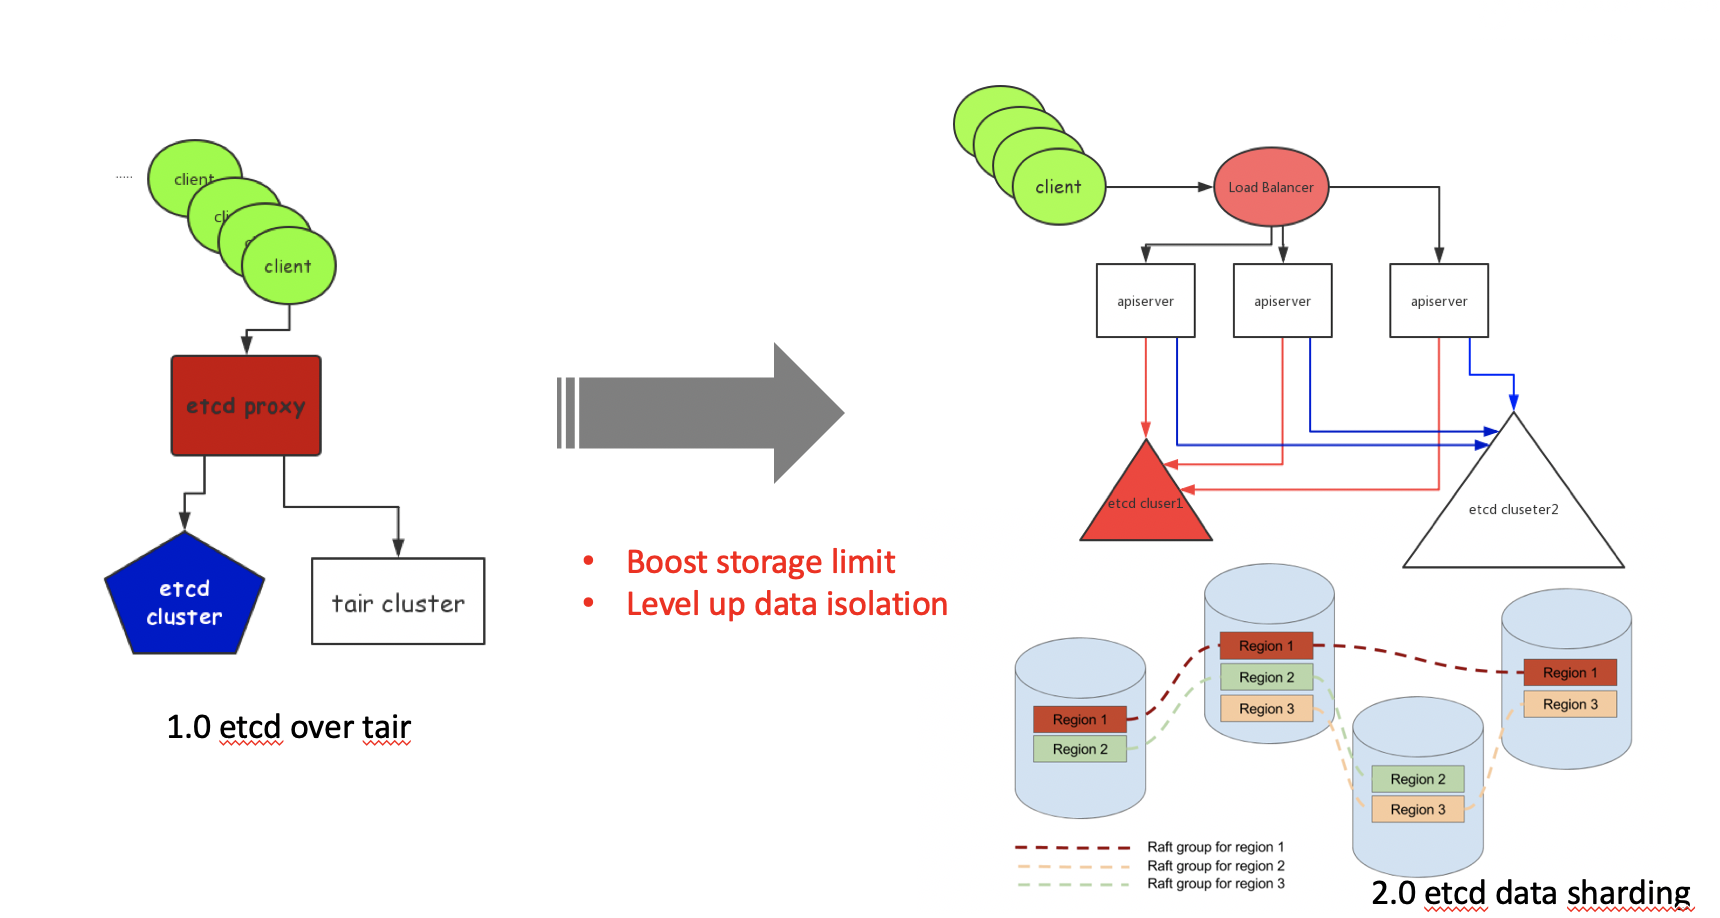
To solve this problem, the team of engineers at Alibaba designed an idle page management algorithm based on segregated hashmap, which uses the continuous page size as its key and the start page ID of continuous pages as its value. Searching for O(1) idle pages could be done by querying segregated hashmap, with improved performance. That is, when a block is released, the new algorithm tries to merge pages with contiguous addresses and to update segregated hashmap. For more information about this algorithm, check out this CNCF blog.
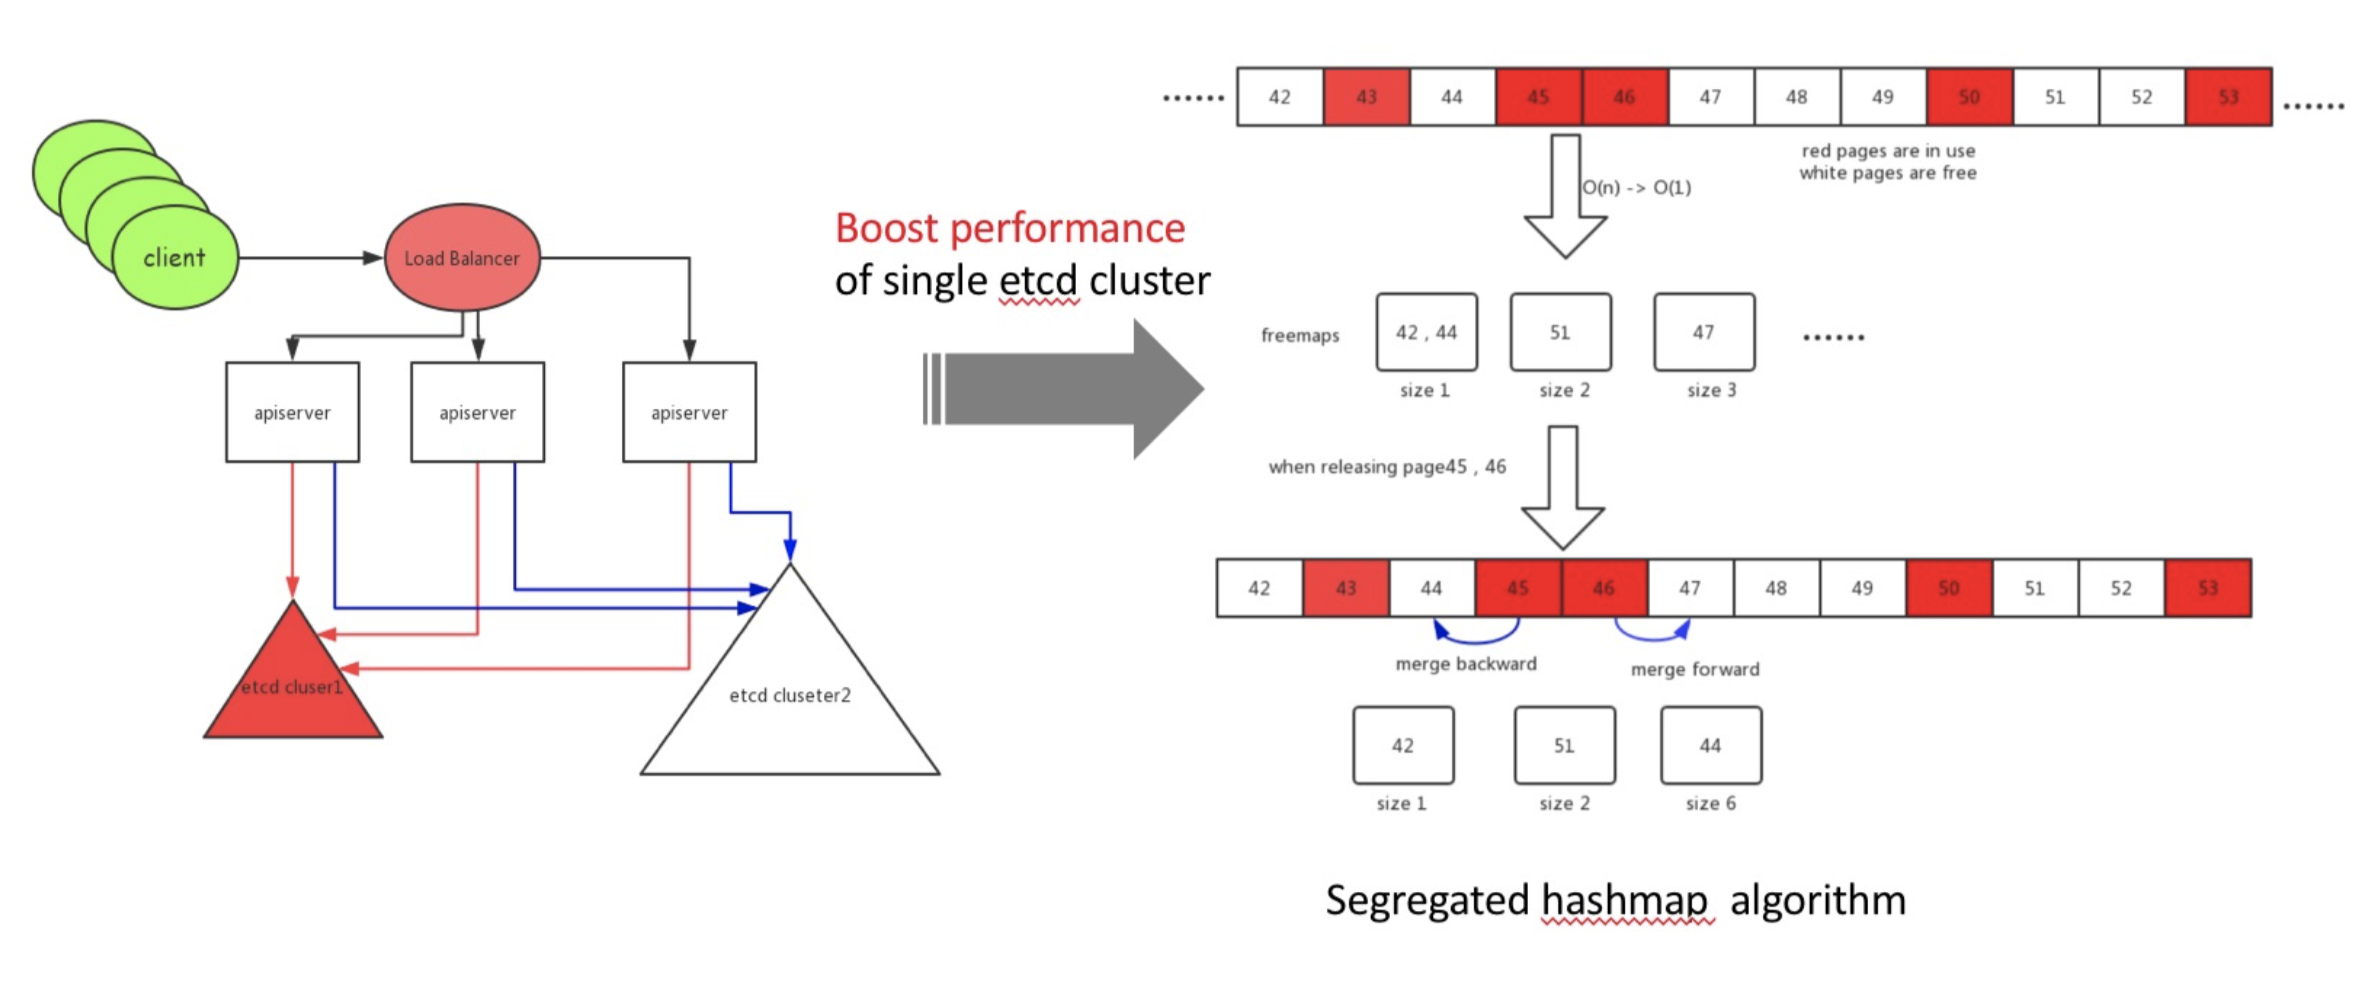
This new algorithm helped increase the etcd storage space from the recommended 2 GB to 100 GB. This in turn greatly improved the data storage capacity of etcd and avoided a significant increase in read and write latency. The Alibaba team of engineers cooperated with Google engineers to develop the etcd Raft learner similar to ZooKeeper Observers), which is equipt with fully concurrent read, along with a load of other features to improve data security and read and write performance. These improvements were contributed to open source projects and will be released in community etcd 3.4.
In this following section, we will look at some of the challenges that the engineering team faced when it came to optimizing the API Server and look at the solutions they proposed. For this section, we will need to go into quite a few technical details, as the engineering team addressed several issues.
The scalability of Kubernetes clusters depends on the effective processing of node heartbeats. In a typical production environment, the kubelet reports a heartbeat every 10s. The content connected with each heartbeat request reaches 15 KB, including dozens of images on the node and a certain amount of volume information. However, there are two problems with all of this:
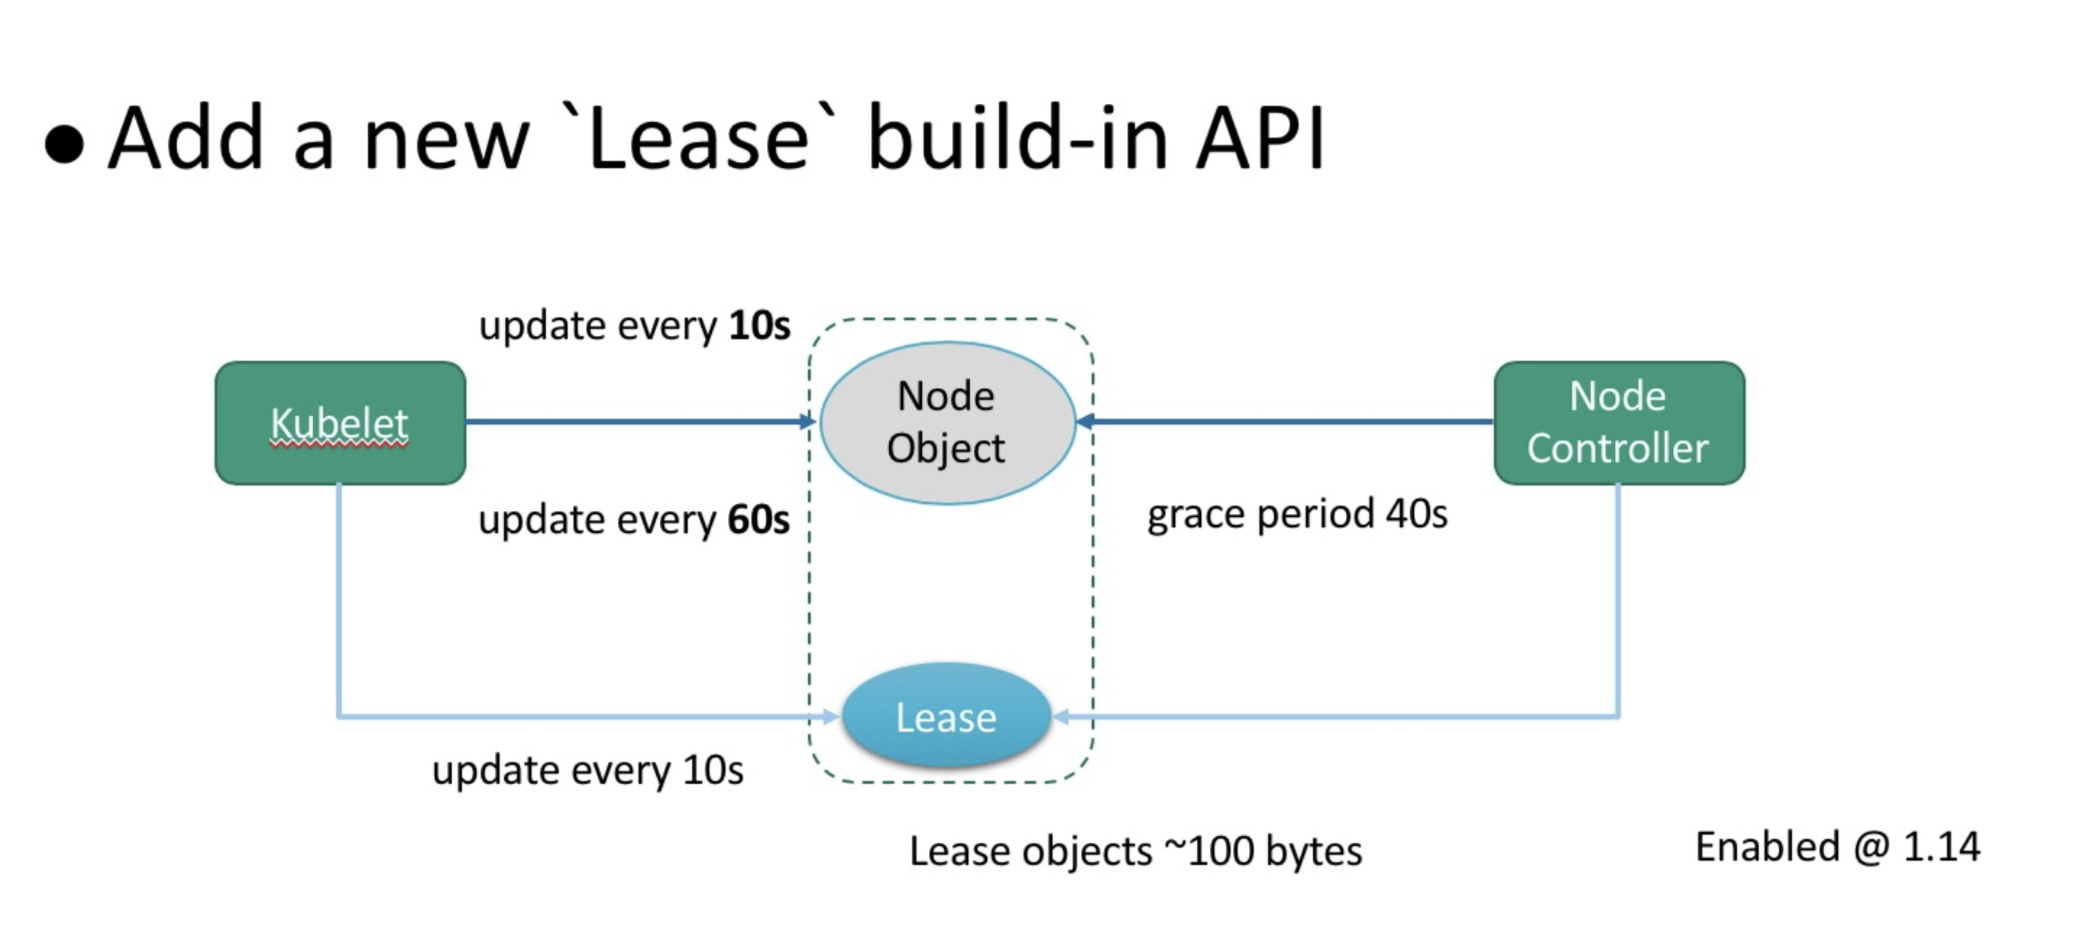
To solve these problems, Kubernetes introduced the built-in Lease API to strip heartbeat-related information from node objects. Consider the above graphic for more details. The kubelet no longer updates node objects every 10s, and it makes the following changes:
The cost of updating Lease objects is much lower than that of updating node objects because Lease objects are extremely small. As a result, the built-in Lease API greatly reduces the CPU overhead of the API server and the transaction logs in etcd, and scales up a Kubernetes cluster from 1,000 nodes to a few thousand nodes. By default, the built-in Lease API is enabled in Kubernetes 1.14, see KEP-0009 for more details.
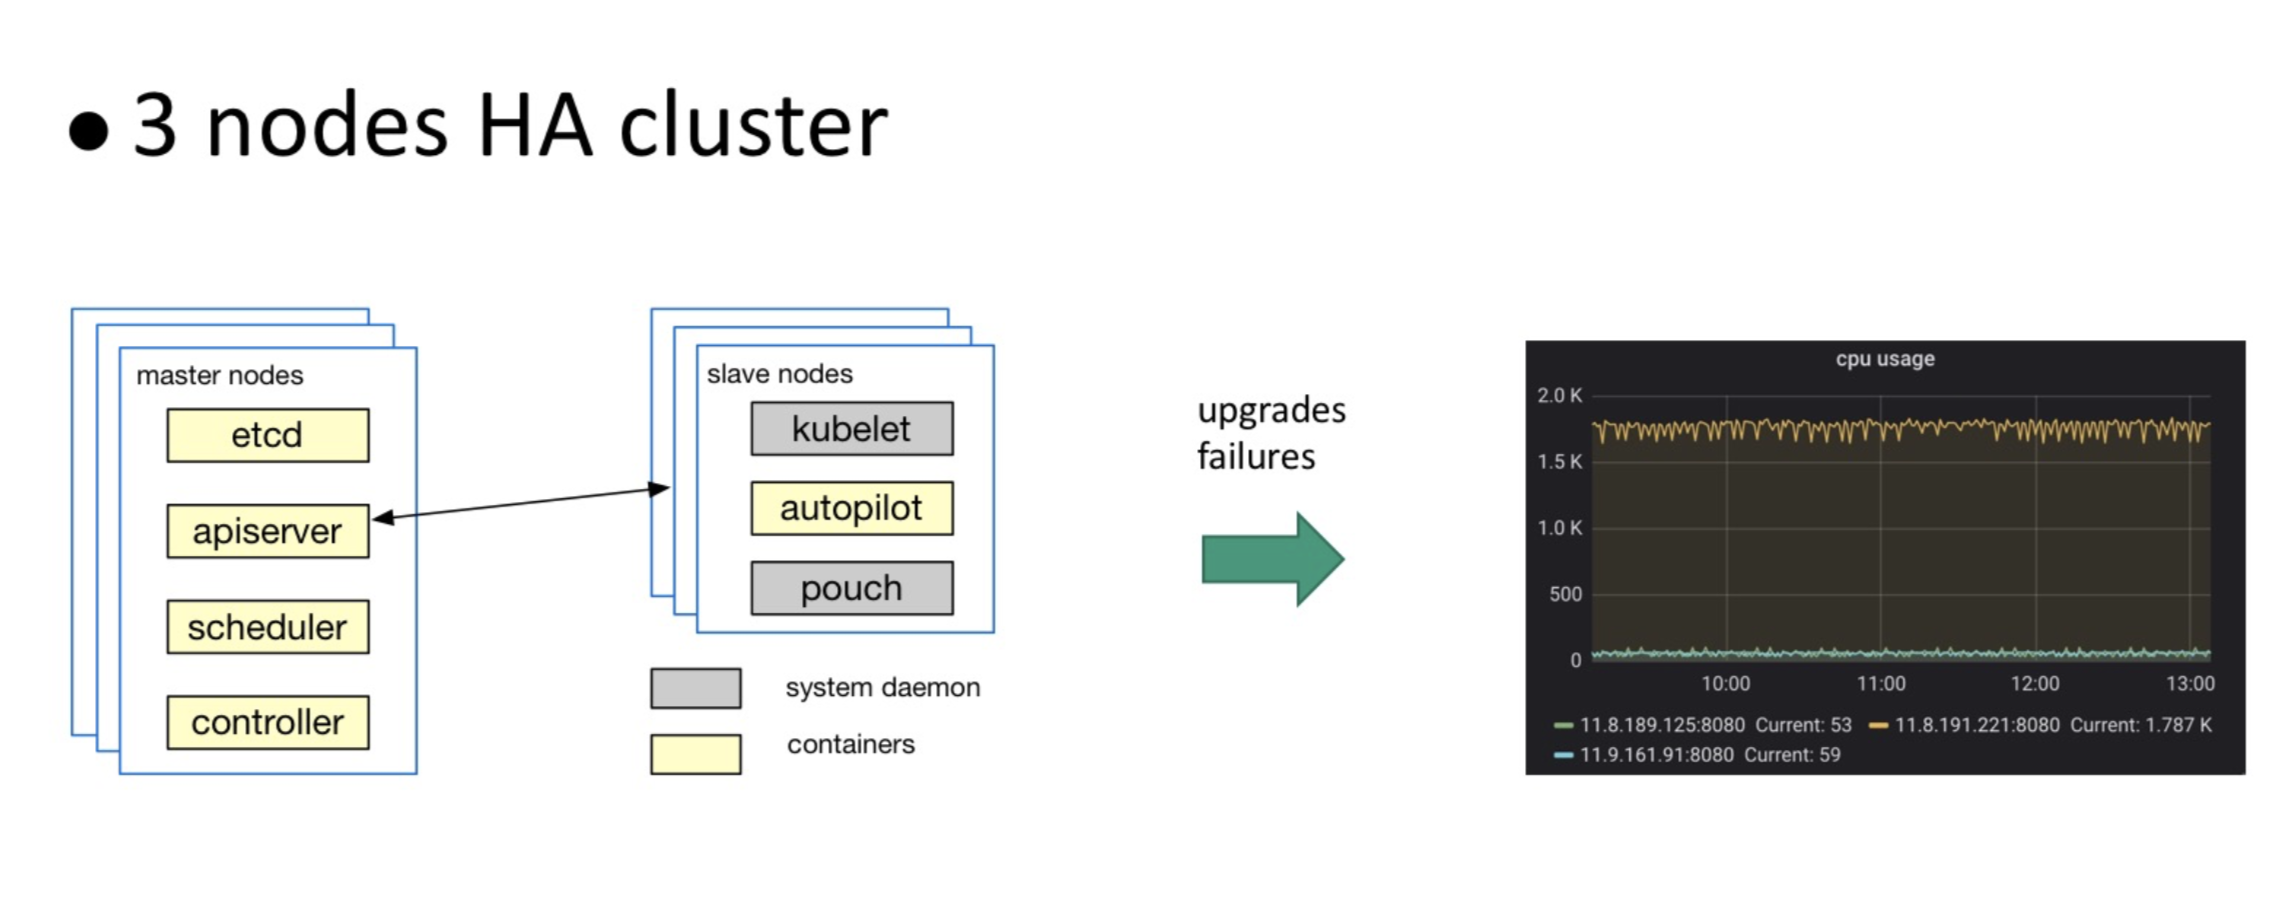
In a production cluster, multiple nodes are typically deployed to form high-availability (HA) Kubernetes clusters for performance and availability considerations. During the runtime of an high-availability cluster, the loads among multiple API servers may be unbalanced, especially in the occasion that the cluster is upgraded or nodes restart due to faults. This imbalance creates a great burden for the cluster's stability. In extreme situations, the burden on the API servers that was originally distributed through high-availability is concentrated again on one node. This slows down the system response and makes the node unresponsive, causing an avalanche.
The following figure shows stress testing on a simulated triple-node cluster. After the API servers are upgraded, the entire burden is concentrated on one API server, whose CPU overhead is far higher than the other two API servers.
A common way to balance loads is to add a load balancer. The main load in a cluster comes from the processing of node heartbeats. Therefore, a load balancer can be added between the API server and kubelet, in two ways:

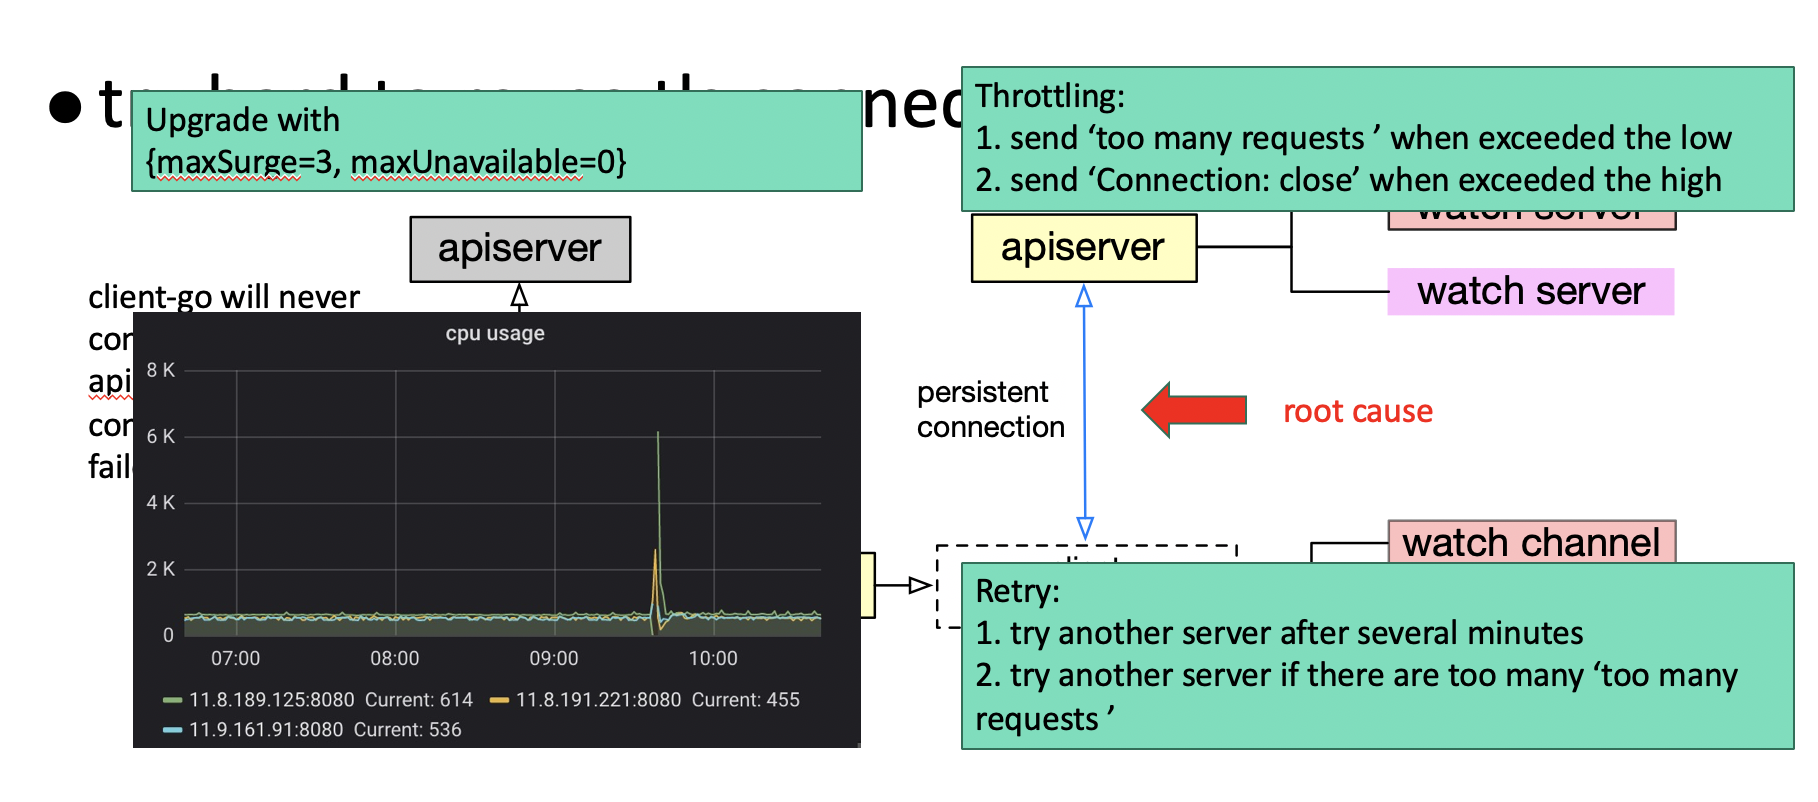
After performing some stress testing, the team of engineers found that adding a load balancer was not an effective method for balancing loads. They realized that they needed to first understand the internal communication mechanism of Kubernetes before they could move any further. After much deep research into Kubernetes, the team found that the Kubernetes clients have made many attempts to reuse the same TLS connection to control the overhead of TLS connection authentication. In most cases, client watchers work over the same TLS connection at the lower layer. Reconnection is triggered only when this TLS connection is abnormal, which leads to API server failover. In normal cases, load switching does not occur after the kubelet is connected to an API server. To implement load balancing, the team made optimizations to the following aspects:
As shown by the monitor screenshot in the lower-left corner of the above figure, the loads among all the API servers are almost perfectly balanced after these optimizations, and the API servers quickly returned to the balanced state when two nodes restart (see the jitter).
List-Watch is essential for server-client communication in Kubernetes. API servers watch the data changes and updates of objects in etcd through a reflector and store the changes and updates in the memory. Controllers and Kubernetes clients subscribe to data changes through a mechanism similar to List-Watch.
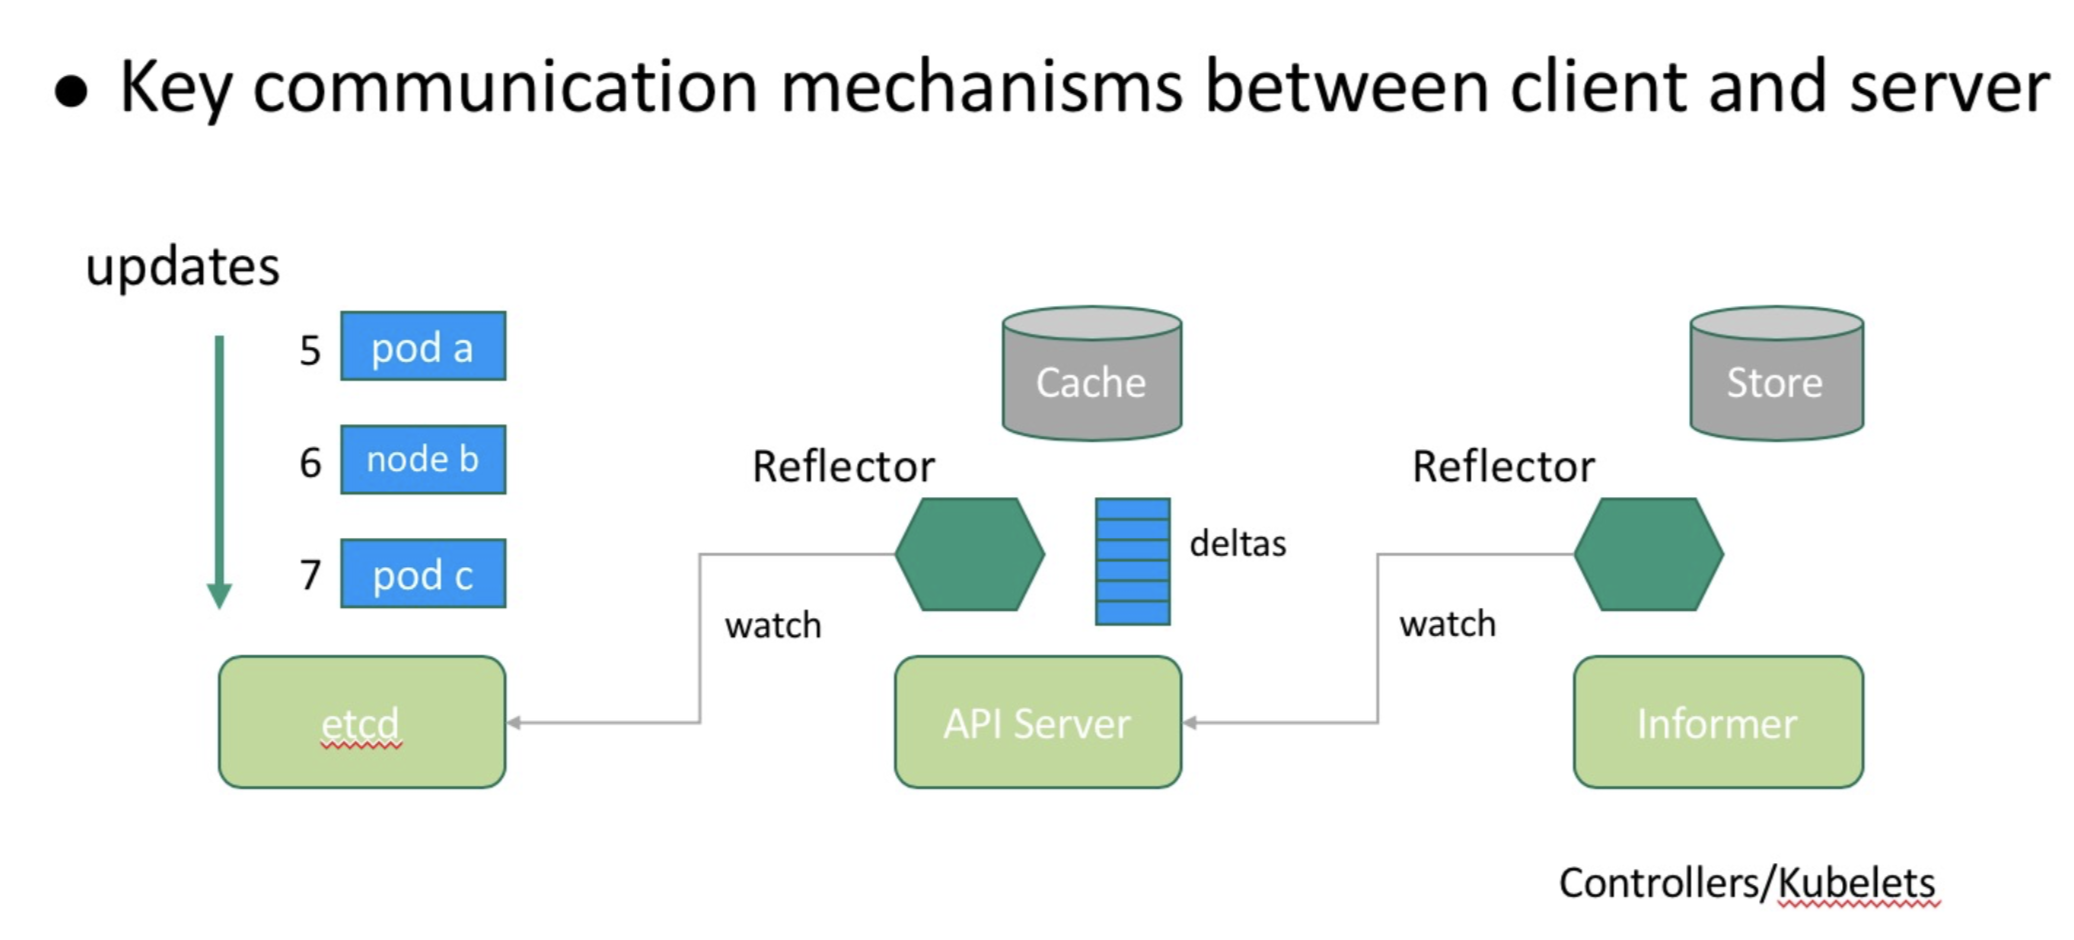
List-Watch adds the globally incremental resourceVersion of Kubernetes to prevent data loss during server-client reconnection in case of communication interruption. As shown in the following figure, the reflector stores the synchronized data version and notifies the API server of the current version (5) during reconnection. The API server calculates the starting position (7) of the client-required data based on the last change record in the memory.
This process looks simple and reliable but is not without problems.
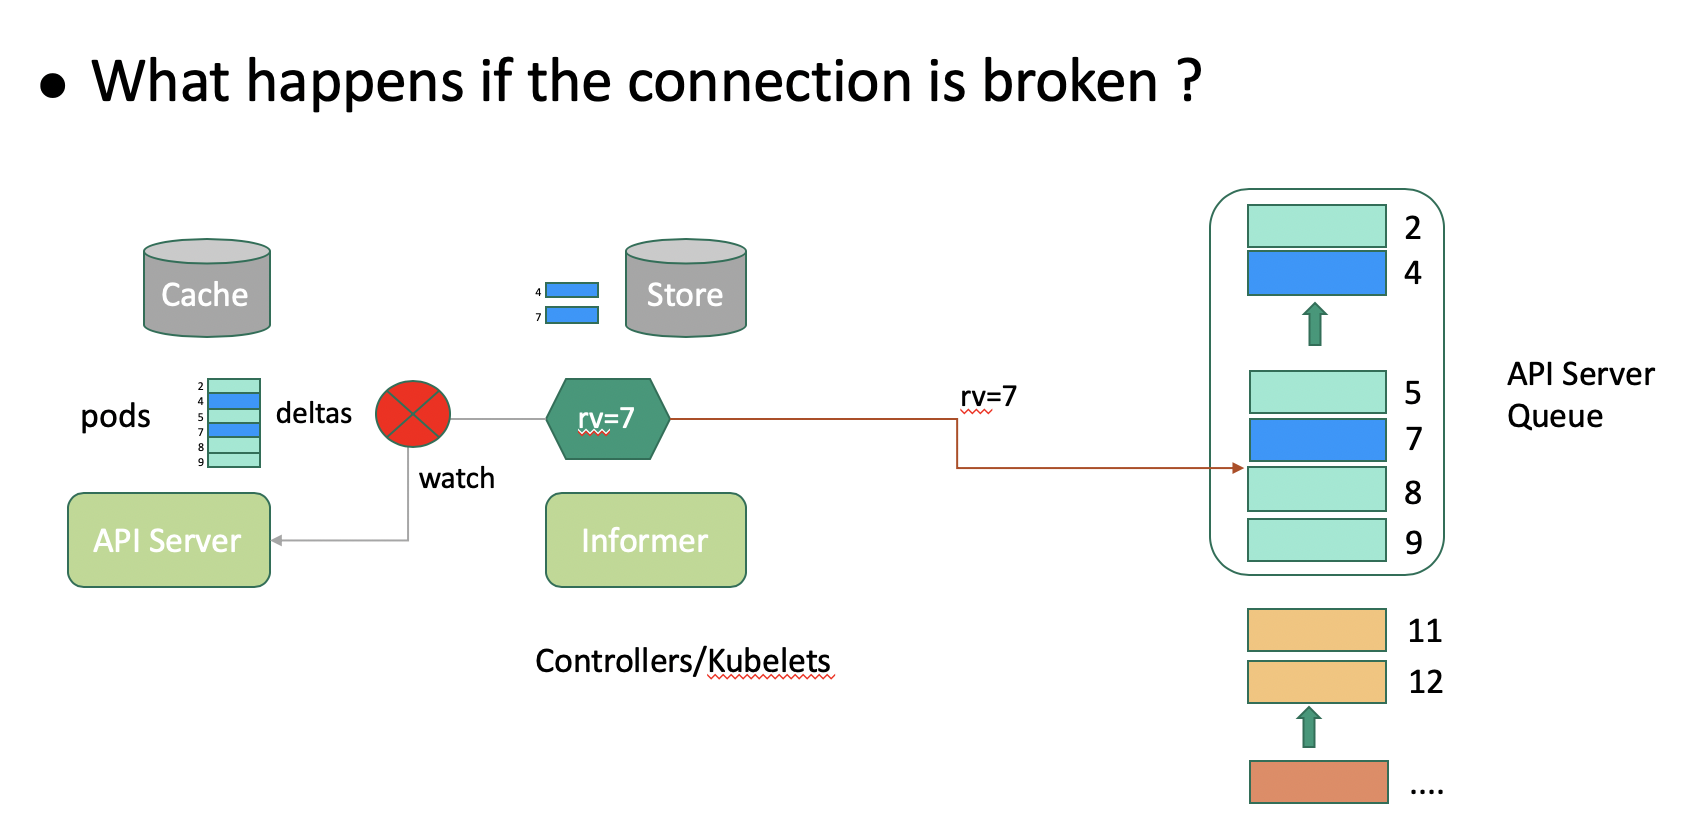
The API server stores each type of object in a storage object. Storage objects are classified as follows:
Each type of storage provides a limited queue that stores the latest object changes to compensate for the lagging of watchers in scenarios such as retries. Generally, all types of storage share a space with an incremental version from 1 to n, as shown in the above figure. The version of pod storage is incremental but not necessarily continuous. A client may pay attention only to some pods when synchronizing data through List-Watch. In a typical scenario, the kubelet pays attention only to the pods that are related to its own node. As shown in the preceding figure, the kubelet pays attention only to Pods 2 and 5, marked in green.
The storage queue is limited due to its first in first out (FIFO) policy. When the queue of pods is updated, earlier updates are eliminated from the queue. As shown in the above figure, when the updates in the queue are unrelated to the client, the client retains the rv value as 5. In the case that the client reconnects to the API server after the rv value 5 is eliminated, the API server cannot determine whether there is a change that the client needs to perceive between the rv value 5 and the minimum value 7 that is held by the queue. Therefore, the API server returns Client too old version error to request the client to list all data. To solve this problem, Kubernetes introduces the Watch bookmark feature.
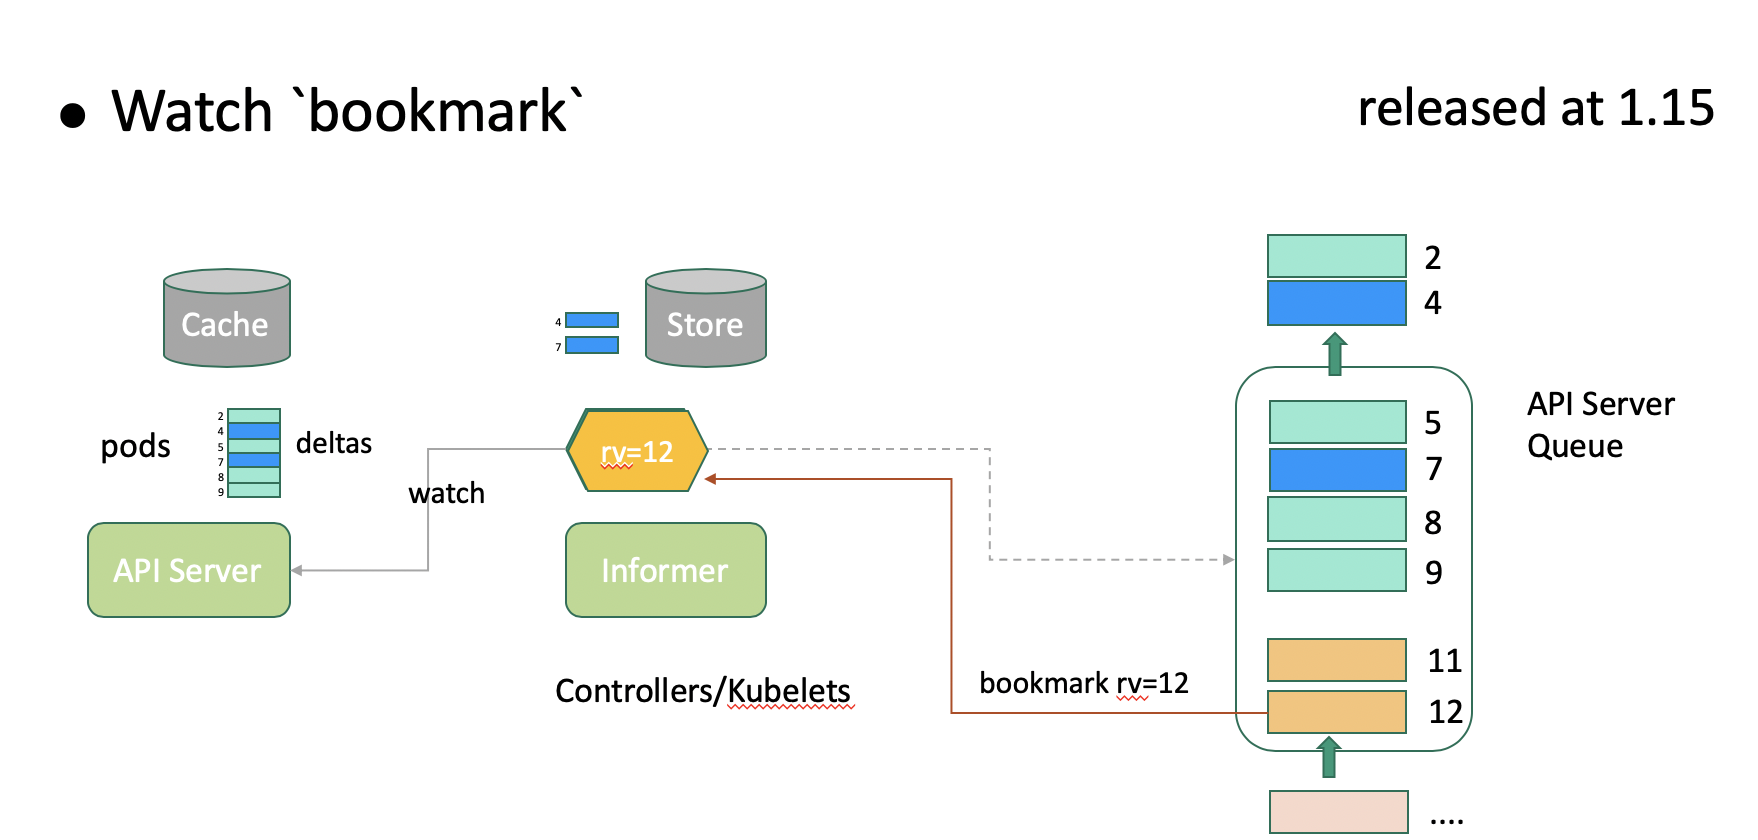
Watch bookmark maintains a heartbeat between the client and API server to enable prompt updates of the internal reflector version even when the queue has no changes for the client to perceive. As shown in the above figure, the API server pushes the latest rv value 12 to the client at the proper time so that the client version can keep up with the version updates on the API server. Watch bookmark reduces the number of events that need to be resynchronized during API server restart to 3% of the original event quantity, with performance improved by dozens of times. Watch bookmark was developed on Alibaba Cloud Container Platform and released in Kubernetes 1.15.
In addition to List-Watch, clients can access API servers through a direct query, as shown in the above figure. API servers take care of the query requests of clients by reading data from etcd to ensure that consistent data is retrieved by the same client from multiple API servers. However, with this system, the following performance problems occur:
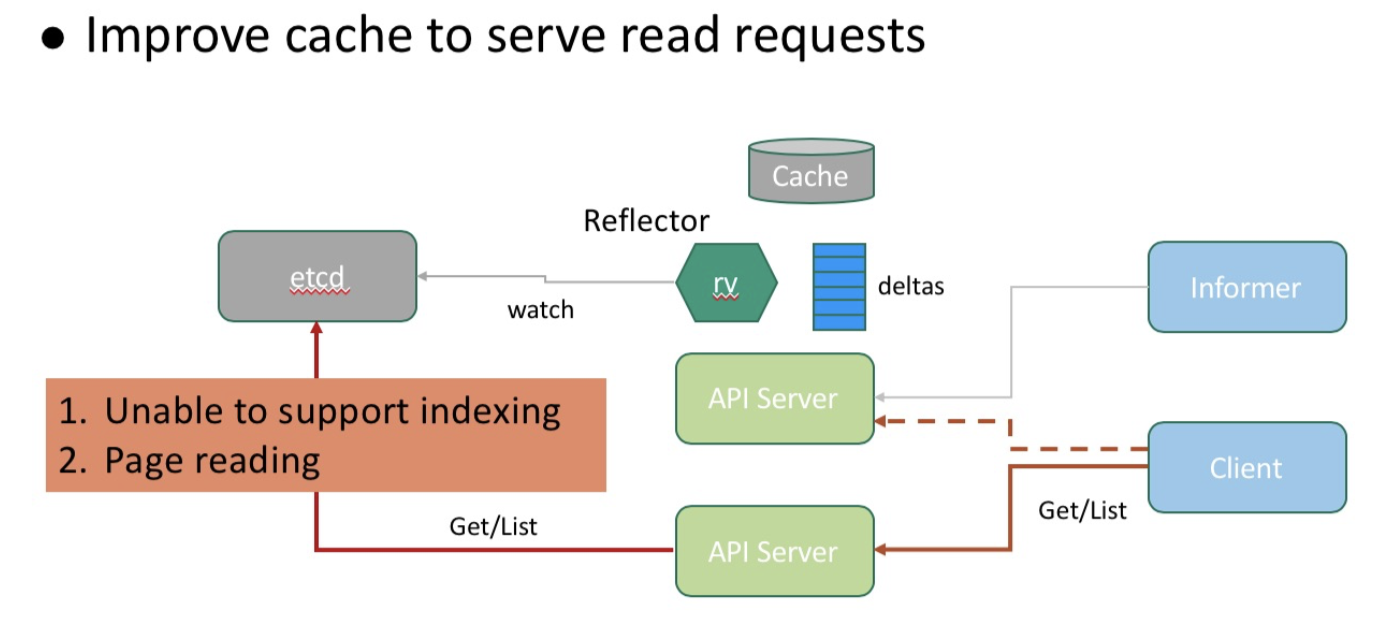
The team of engineers at Alibaba designed a data collaboration mechanism that works inbetween API servers and etcd to ensure that consistent data is retrieved by the same client from multiple API servers through their cache. The below figure shows the workflow of the data collaboration mechanism.
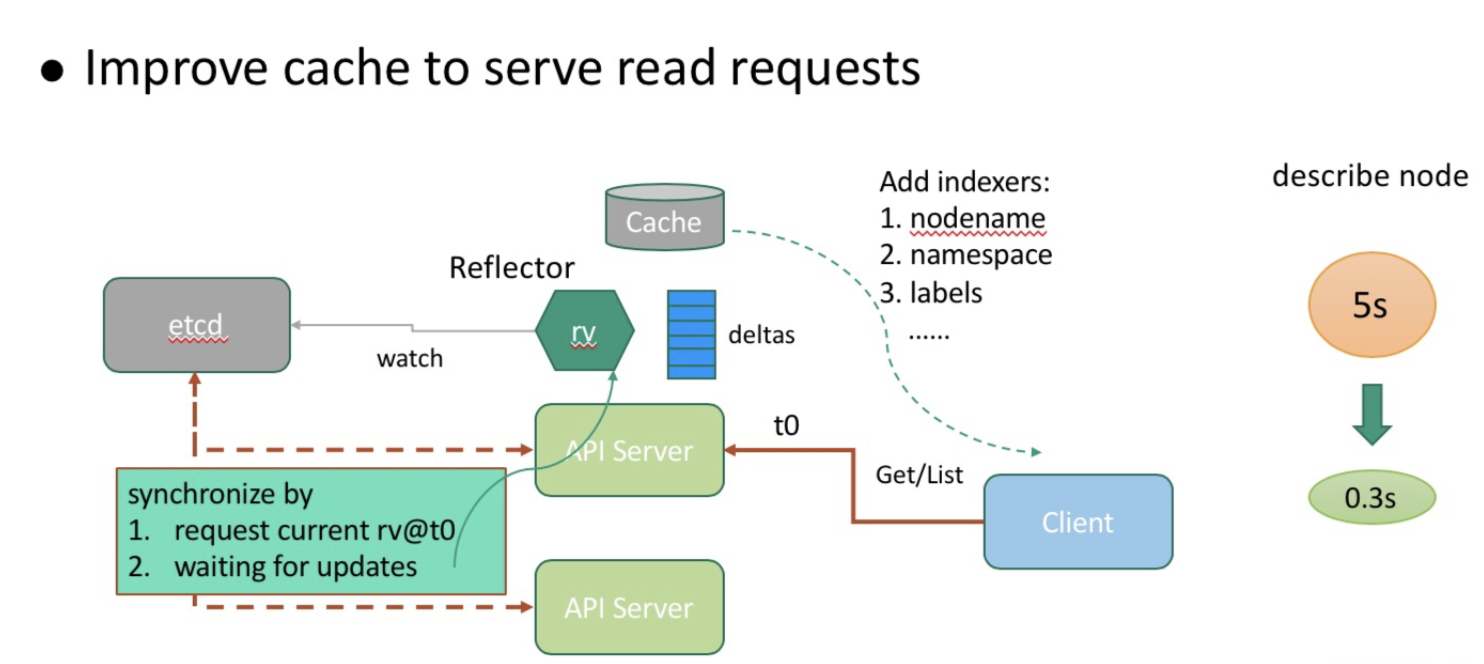
The consistency model of the client is maintained in the data collaboration mechanism—you can try out if you are interested. The cache-based request-response model allows for flexible enhancement of the query capability by means of namespace nodename and labels. This enhancement greatly boosts the read request processing capability of API servers, reduces the describe-node time from 5s to 0.3s (with node name indexing triggered) in a 10,000-node cluster, and makes query operations such as Get Nodes more efficient.
To understand what are content-aware problems, first consider the following situation. The API Server needs to receive and complete requests to have access to external services. This could be, for example, to access to the etcd for persistent data, or the Webhook Server for extended Admission or Auth, or even the API Server itself.
Now the problem with all of this comes down to the way in which the API Server processes requests. For example, in the case that the client has terminated a request, the API Server would still continue to process the request regardless. This, of course, results in a blacklog of Goruntine and resources. Next, it could easily be the case that the client may try to intiate a new request, while the API Server is still likely to continue to request the initial request.This again would cause the API Server to run out of memory and crash.
But why is this "Content-aware"? Well, here "context" refers to the resources in the request by the client. Generally speaking, after the client's request ends, the API Service should also reclaim the resources of the request and stop the request. This last part of this is important piece because, if the request isn't stopped, the throughput of the API server will be dragged down by the backlog of Goruntine and related resources, causing the issues we discussed above.
The Engineers at Alibaba and Ant Financial have participated in the optimization of context-aware issues and features for the entire request process connected to the API Server. Kubernetes version 1.16 has optimized the Admission, Webhook components to improve the overall performance and throughput of the API Server.
The API Server is also vulnerable to receiving too many request. This is because, even though the API Server comes with the max-inflight filter, which limits maximum concurrent read/wwrites, there really aren't any other filters for restricting the number of requests to the Server, making it vulnerable to crashes.
The API Server is an internal deployment, and therefore it doesn't receive external requests, with requests coming from the internal components and modules of Kubernetes. Based on the observations and experience of the team of engineers at Alibaba, such API Server crashes are mainly caused by either one of the following two scenarios:
The API Server is at the core of Kubernetes, so, whenever the API server needs to be restarted or updated, all of Kubernetes's components must be reconnected to it, which means that each and every component will send requests to the API Server. Among processes, reestablishing the List-Watch consumes a lot of resources. Both the API Server and etcd have a cache layer, so in the case the cache layer of the API Server cannot receive an incoming client request, the request can be directed to etcd. However, often it's the case that the resources of etcd list may end up filling all of the network cache of both the API Server and etcd, causing the API Server to run out of memory and crash. Then, it's also likely the client will continue to send even more requests, leading to an avalanche.
To resolve the problem described, the team at Alibaba used the "Active Reject" function. With this enabled, the API Server will reject larger incoming requests that the cache cannot handle. A rejection returns a 429 error code to the client, which will cause the client to wait some time before sending a new request. Generally speaking, this can optimize the IO between the API server and client, reducing the chances of the API server crashing.
One of the most typical bugs is a DaemonSet component bug, which causes the number of request to be multipled by the number of nodes, which then in turn ends up crashing the API Server.
To resolve this problem, you can use a method of emergency traffic control implemented with User-Agent to dynamically limit requests based on their source. With this enabled, you can easily restrict requests of the problem component that you identify as having the bug based on the data collected in the monitoring chart. By stopping its requests, you can thus project the API Server, and with the server protected, you can procede to fix the component with the bug. If the Server crashes, you wouldn't be able to fix the bug. The reason you want to control traffic with User-Agent, instead of Identity, for this is because an Identity request can be consume a lot of resources, which could cause the server to crash.
The engineers at Alibaba and Ant Financial have provided these method to the community as a user stories.
In a 10,000-node production cluster, one controller stores nearly one million objects. It consumes substantial overhead to retrieve these objects from the API server and deserialize them, and it may take several minutes to restart the controller for recovery. This is unacceptable for enterprises as large as Alibaba. To mitigate the impact on system availability during component upgrade, the team of engineers at Alibaba developed a solution to minimize the duration of system interruption due to controller upgrade. The following figure shows how this solution works.
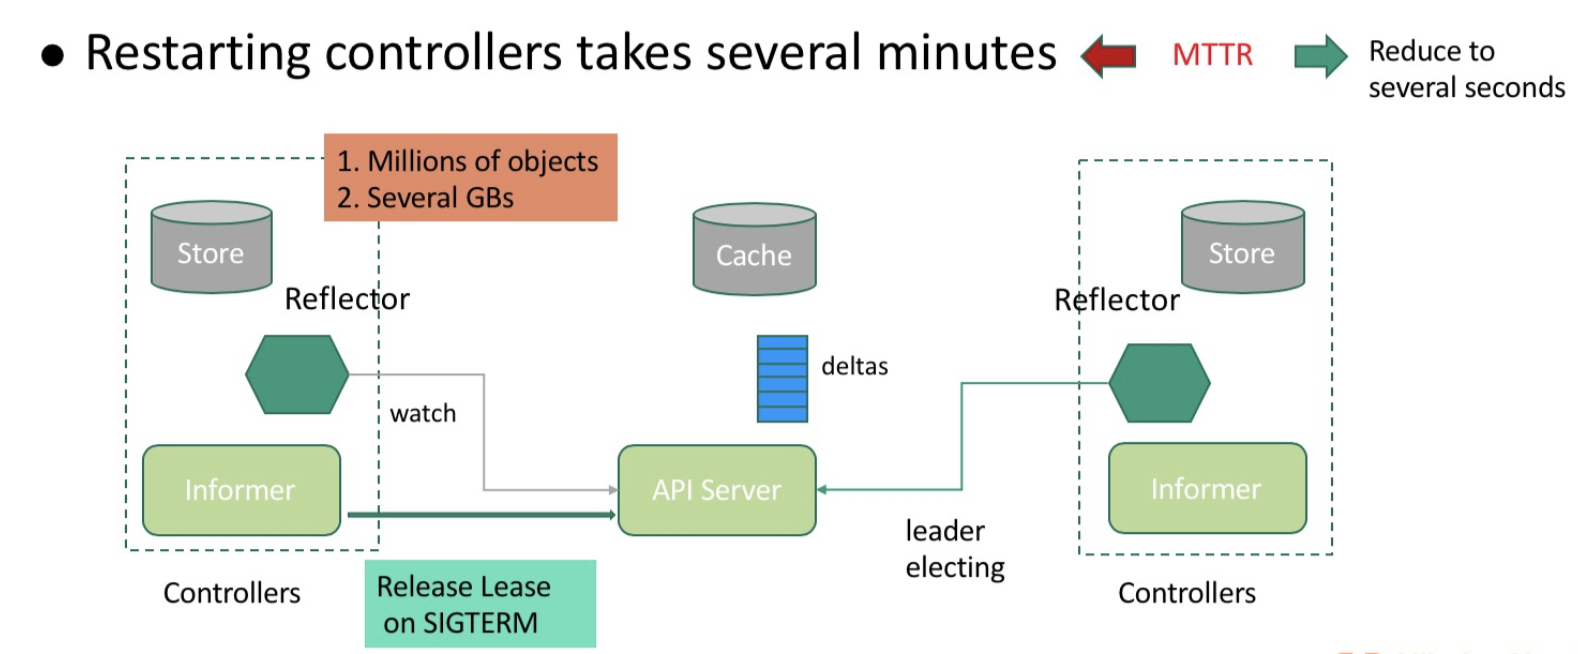
This solution reduces the controller interruption time to several seconds (less than 2s during upgrade). Even in the case of abnormal downtime, the standby controller can resynchronize data after Leader Lease expires, which takes 15s by default rather than a couple of minutes. This solution greatly reduces the mean time to repair (MTTR) of controllers and mitigates the performance impact on API servers during controller recovery. This solution is also applicable to schedulers.
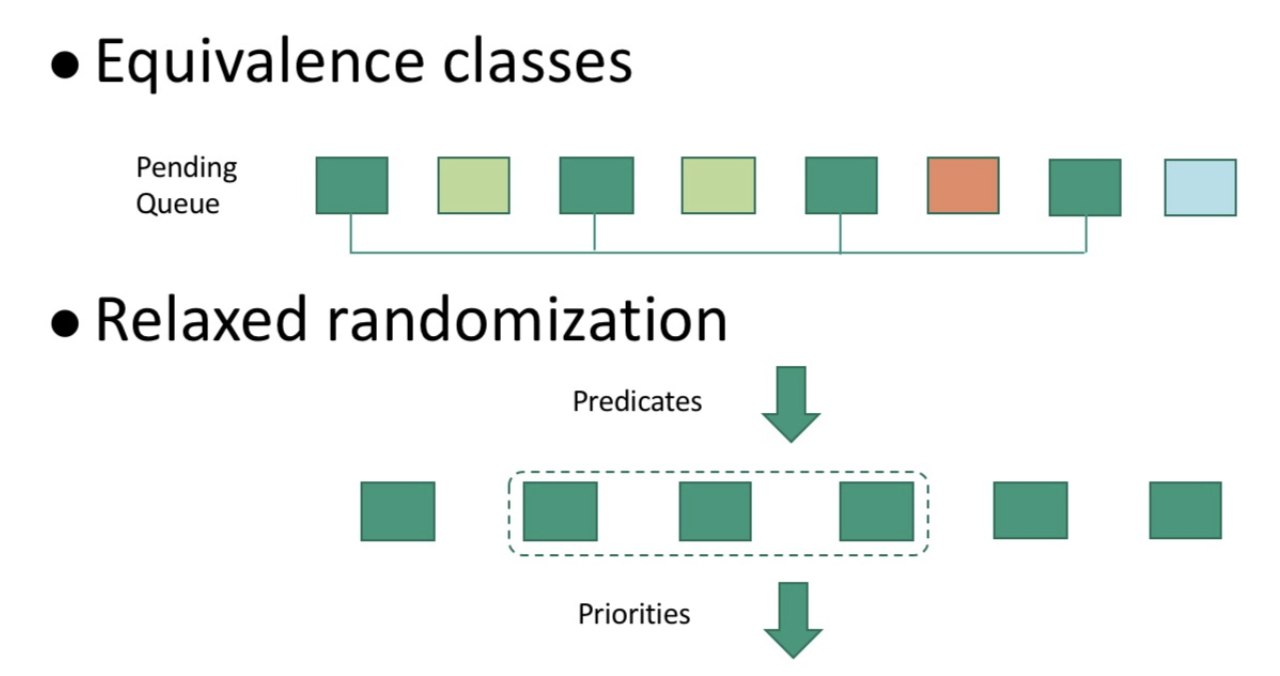
Due to historical reasons, Alibaba schedulers adopt a self-developed architecture. Enhancements made to schedulers are not described in detail here due to length constraints. Rather, only two basic ideas—both nonetheless important ideas—are described here, which are also shown in the figure below.
Through a series of enhancements and optimizations, the engineering teams at Alibaba and Ant Financial were able to successfully apply Kubernetes to the production environments of Alibaba and reach the ultra-large scale of 10,000 nodes in a single cluster. To sum things up, specific improvements that were made include the following:
Based on these enhancements, Alibaba Cloud and Ant Financial now run their core services in 10,000-node Kubernetes clusters, which have withstood the immense test of the 2019 Tmall 618 Shopping Festival.
It's the World's First Application Management Model, and It's Open-Source!

706 posts | 57 followers
FollowAlibaba Clouder - January 8, 2021
Alibaba Clouder - November 7, 2019
Apache Flink Community China - November 6, 2020
Alibaba Developer - June 30, 2020
Alibaba Container Service - December 6, 2019
Alibaba Developer - September 7, 2020

706 posts | 57 followers
Follow Container Service for Kubernetes
Alibaba Cloud Container Service for Kubernetes is a fully managed cloud container management service that supports native Kubernetes and integrates with other Alibaba Cloud products.
Learn More Container Compute Service (ACS)
A cloud computing service that provides container compute resources that comply with the container specifications of Kubernetes
Learn More ACK One
Provides a control plane to allow users to manage Kubernetes clusters that run based on different infrastructure resources
Learn More Cloud-Native Applications Management Solution
Accelerate and secure the development, deployment, and management of containerized applications cost-effectively.
Learn MoreMore Posts by Alibaba Cloud Native Community