By Tang Yun (Chagan), Alibaba Senior Development Engineer, Compiled by Zhang Zhuangzhuang (Flink community volunteer)
This article is compiled based on the live broadcast of the Apache Flink series and shared by Tang Yun (Chagan), Alibaba Senior Development Engineer. Key topics in this article include:
The first part of this article introduces the evolution of container management systems. The second part introduces Flink on Kubernetes, including the deployment mode and scheduling principle of clusters. The third part shares our practical experience on Flink on Kubernetes over the past year, including the problems we encountered and the lessons we learned. The last part demonstrates cluster deployment and task submission.
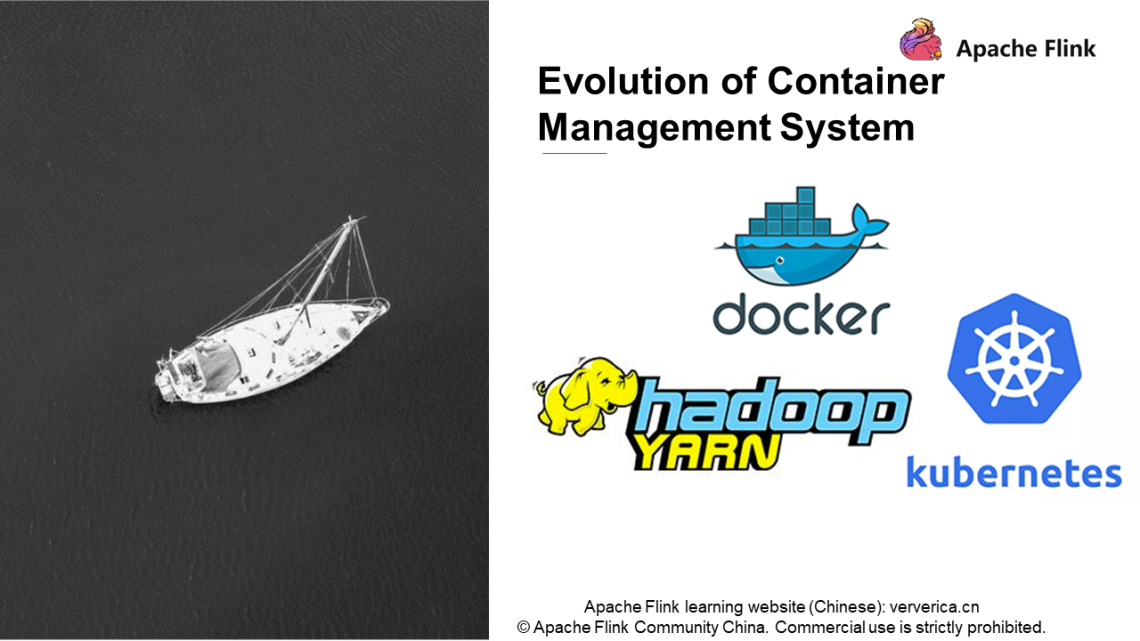
First, let's explore the relationship between Kubernetes and YARN from the perspective of a non-kernel Kubernetes developer. As we all know, Apache Hadoop YARN is probably the most widely used scheduling system in China. The main reason is that Hadoop HDFS is the most widely used storage system in China or in the entire big data industry. Therefore, Apache Hadoop YARN has naturally become a widely used scheduling system, including the early Hadoop MapReduce. With the opening of the Framework after YARN 2.0, Spark on YARN and Flink on YARN can also be scheduled on YARN.
Of course, YARN itself also has certain limitations.
• For example, as YARN is developed based on Java, there are some limitations to the isolation of most of its resources.
• YARN 3.0 supports GPU scheduling and management to some extent. However, YARN of earlier versions does not support GPU very well.
In addition to the Apache Software Foundation, the Cloud Native Computing Foundation (CNCF) has developed Kubernetes based on native-cloud scheduling.
As a developer, I think Kubernetes is more like an operating system with many features. Of course, it also means that Kubernetes is more complex and is hard to learn. You need to understand many definitions and concepts. YARN is mainly used to schedule resources. It is much smaller for the whole operating system. Of course, it is also a pioneer in the big data ecosystem. Next, I will focus on Kubernetes, and discuss our experience and lessons learned during the evolution from YARN containers to Kubernetes containers (or pods).
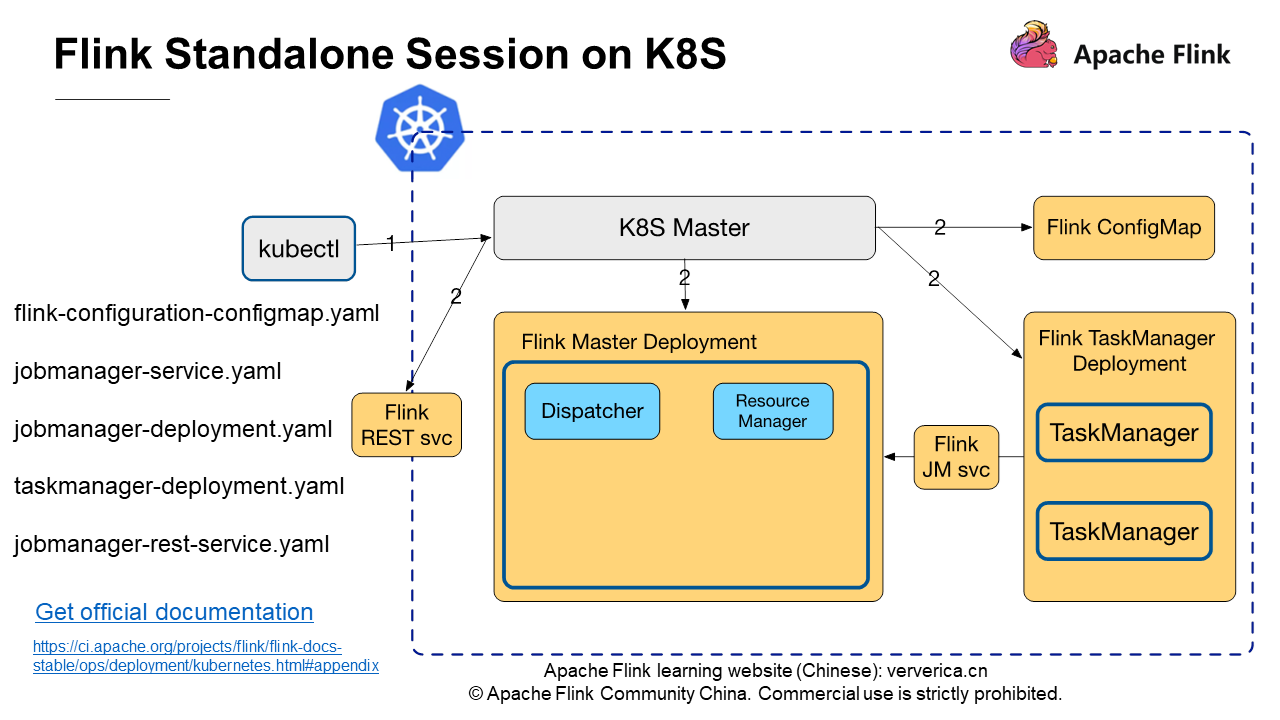
The preceding figure shows the scheduling flow on a Flink standalone session cluster on Kubernetes. In the blue dashed boxes are the components running within the Kubernetes cluster, and in the gray boxes are the commands or components provided by the Kubernetes native, including kubectl and Kubernetes Master. The left side lists the five yaml files that are provided in the official Flink documentation. These files can be used to deploy the simplest Flink standalone session cluster on Kubernetes.
Run the following kubectl commands to start a cluster:
kubectl create -f flink-configuration-configmap.yaml
kubectl create -f jobmanager-service.yaml
kubectl create -f jobmanager-deployment.yaml
kubectl create -f taskmanager-deployment.yaml
• The First command applies to the Kubernetes Master for creating Flink ConfigMap. The ConfigMap provides the configurations required to run the Flink cluster, such as flink-conf.yaml and log4j.properties.
• The second command creates the Flink JobManager service to connect TaskManager to JobManager.
• The third command creates the Flink JobManager Deployment to start JobMaster. The Deployment contains the Dispatcher and the Resource manager.
• The last command creates the Flink TaskManager Deployment to start TaskManager. Since two replicas are specified in the official Flink taskmanager-deployment.yaml instance, the figure shows two TaskManager nodes.
You can also create a JobManager REST service to submit jobs through the REST service.
The preceding figure shows the concepts of the Flink Standalone Session cluster.
The following figure shows the process of submitting a job to the Standalone Session cluster by using a Flink client.
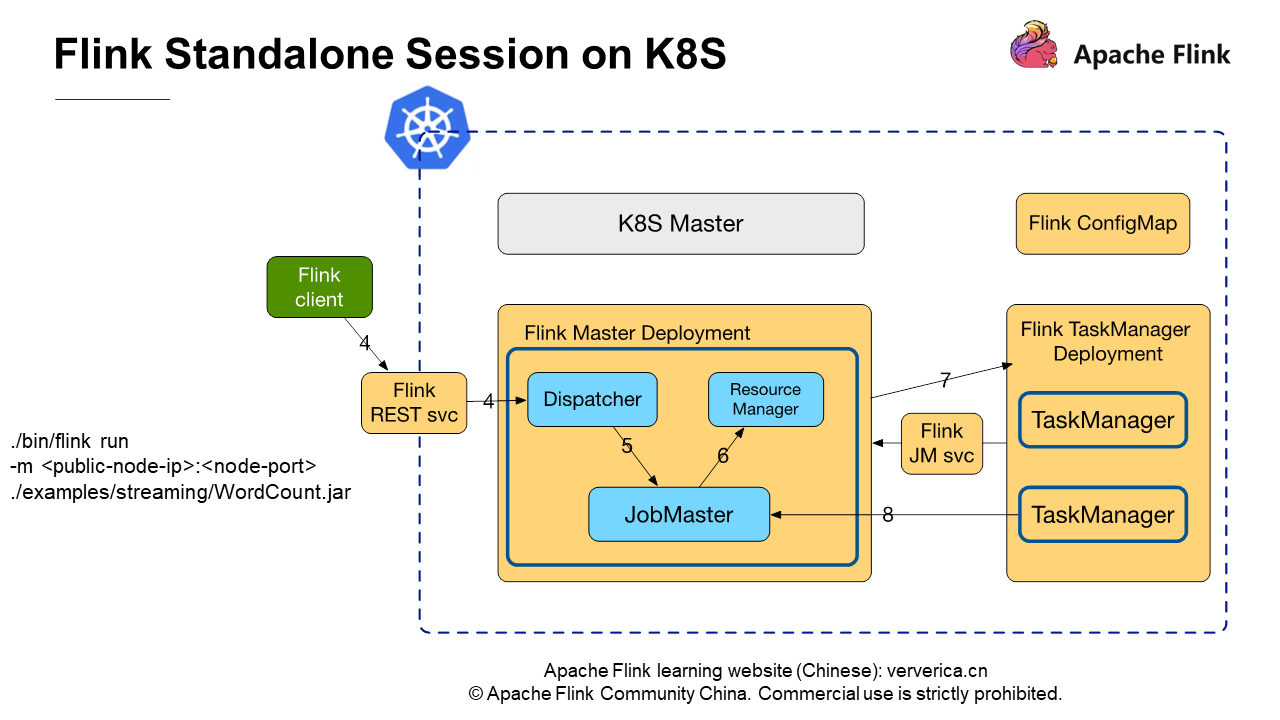
On the Flink client, run the following command to submit a job:
./bin/flink run -m : ./examples/streaming/WordCount.jarThe parameters public-node-IP and node-port required by -m are the IP address and port of the REST service exposed through jobmanager-service.yaml. You can execute this command to submit a Streaming WordCount job to the cluster. This process is independent of the environment in which the Flink Standalone Session cluster runs. The job submission process is the same, regardless of whether the cluster runs on Kubernetes or on physical machines.
The advantages and disadvantages of Standalone Session on Kubernetes are as follows:
• Advantages: You only need to define some yaml files before starting clusters, and do not need to modify the Flink source code. The communication between clusters does not rely on Kubernetes Master.
• Disadvantages: Resources must be requested in advance and cannot be dynamically adjusted. However, Flink on YARN can declare the JM and TM resources required by clusters when a job is submitted.
In the process of Flink 1.10 development, Alibaba engineers responsible for scheduling contributed to Flink on Kubernetes in native computing mode. It is also the native Kubernetes we have summarized from practices over the past year.
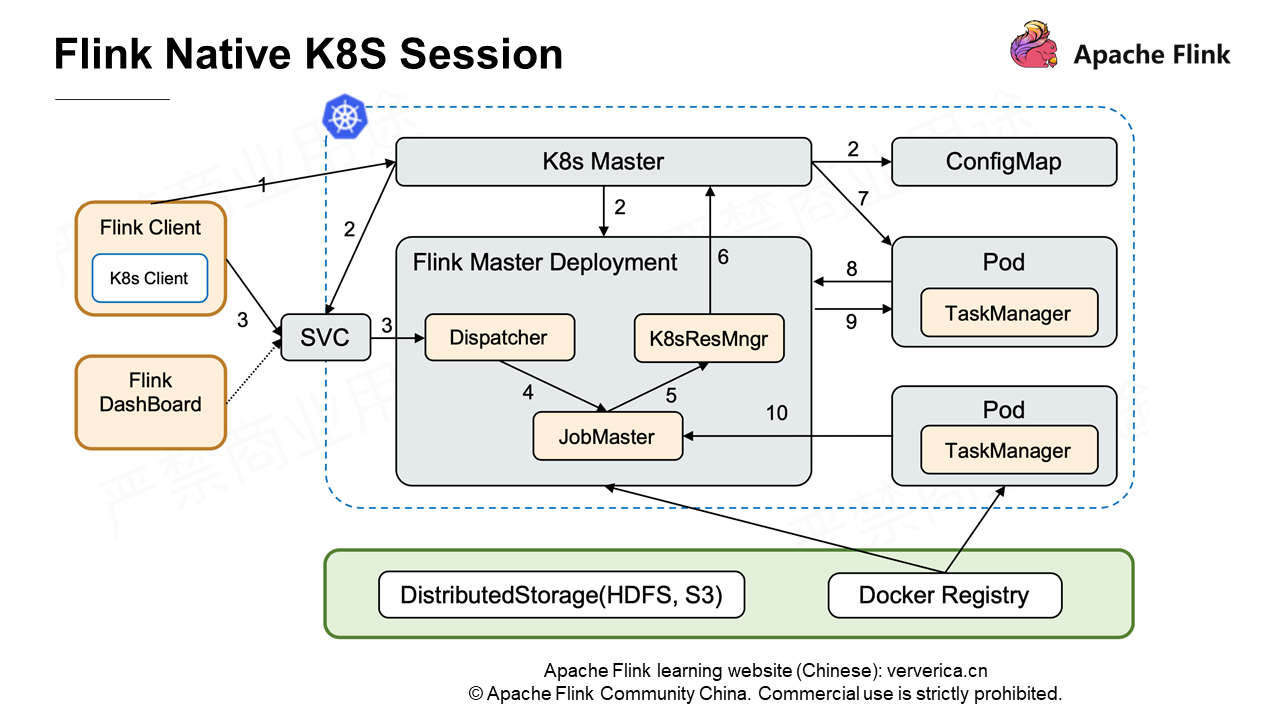
The most outstanding difference is that when you submit a job through a Flink client, the JobMaster of the entire cluster dynamically applies to Kubernetes Master for resources through the Kubernetes ResourceManager to create the pod running the TaskManager. Then, the TaskManager and JobMaster communicate with each other. For details about native Kubernetes, see Running Flink on Kubernetes Natively shared by Wang Yang.
In a word, we can use Kubernetes in the same way as we use YARN, and keep related configuration items as similar to those of YARN as possible. For easy explanation, I will use the Standalone Session cluster to describe it. Some of the features described in the following section are not implemented in Flink 1.10 and are expected to be implemented in Flink 1.11.
When we run a job in Flink on Kubernetes, we cannot avoid a functional issue - logs. If we run this job on YARN, YARN will do this for us. For example, after the Container completes running, YARN collects logs and uploads them to HDFS for later review. However, Kubernetes does not collect or store logs. We have many ways to collect and display logs. Logs are lost when pods exit due to exceptions in the job, making troubleshooting extremely difficult.
If we run this job on YARN, we can use the command yarn logs -applicationId to view the related logs. But if we run this job on Kubernetes?
Currently, a common practice is to use fluentd to collect logs, which has been used in production environments for some users.
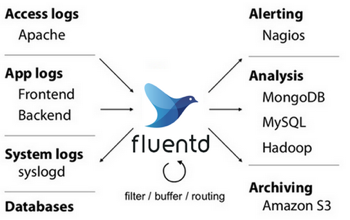
fluentd is also a CNCF project. By configuring some rules, such as regex matching, you can upload .log, .out, and *.gc logs to HDFS or other distributed storage file systems regularly to implement log collection. This means that in addition to TM or JM, we need to start another container (sidecar) that runs the fluentd process in a pod.
There are other ways. For example, you can use logback-elasticsearch-appender to send logs to Elasticsearch without adding a container. The implementation principle is to write logs directly to Elasticsearch by using the scoket stream supported by the Elasticsearch REST API.
Compared with fluentd, you do not need to add another container to collect logs. However, you cannot collect non-log4j logs, such as System.out and System.err logs. Especially when core dump or crash dump occurs in a job, related logs are directly written to System.out and System.err. From this perspective, writing logs to Elasticsearch through logback-elasticsearch-appender is not a perfect solution. In contrast, various policies can be configured in fluentd to collect the required logs.
Logs help us observe the running status of a job, especially when problems occur. They help us backtrack the occurrence scenarios and perform troubleshooting and analysis. Metrics and monitoring are common but important issues. There are many monitoring system solutions in the industry, such as Druid (widely used in Alibaba), open-source InfluxDB, commercial cluster edition InfluxDB, CNCF Prometheus, and Uber's open-source M3.
Then, let's take Prometheus as an example. Prometheus and Kubernetes are both CNCF projects and have inherent advantages in the field of metrics collection. To some extent, Prometheus is a standard monitoring and collection system in Kubernetes. Prometheus can not only monitor alarms but also perform multi-precision management regularly based on the configured rules.
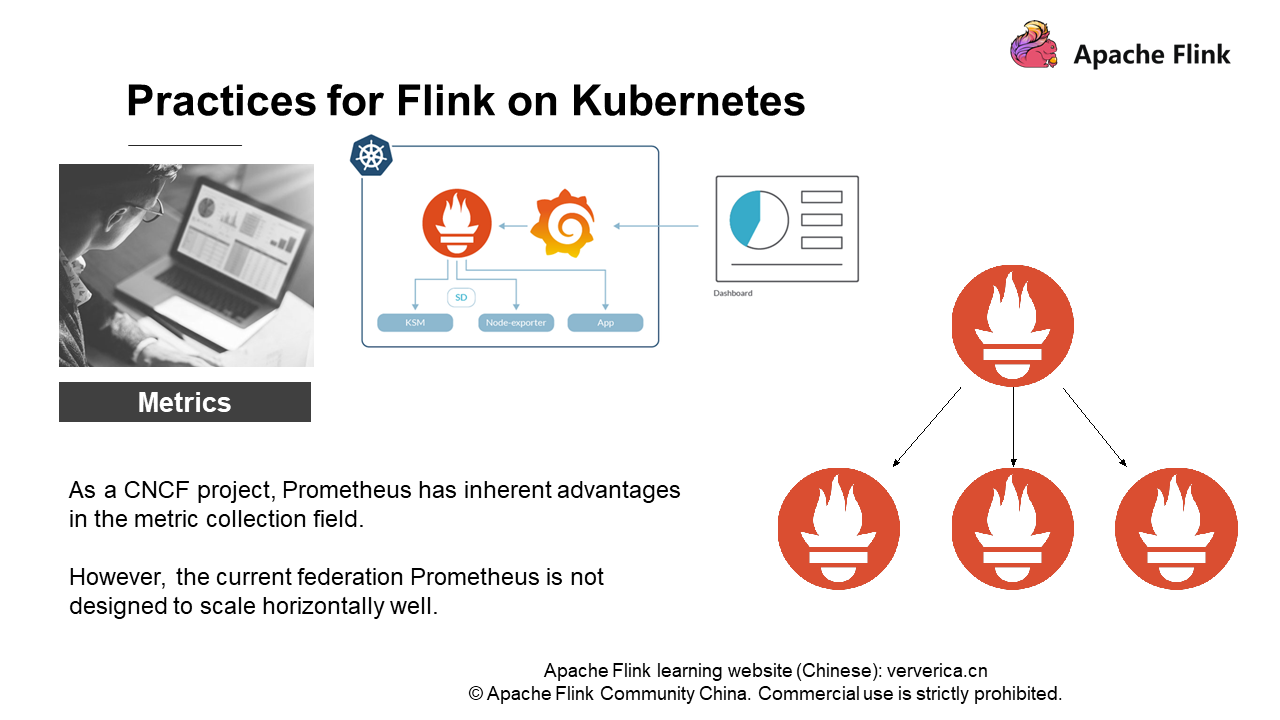
But, in practice, we find that Prometheus is not designed to scale well horizontally. As shown on the right of the preceding figure, the Federated distributed architecture of Prometheus is actually a multi-layer structure. The nodes at the upper layer perform routing and forwarding to query the results at the lower layer. Obviously, no matter how many layers are deployed, the higher the nodes, the more easily they become performance bottlenecks, and the entire cluster is difficult to deploy. If the user scale is not large, a single Prometheus can meet monitoring requirements. However, once the user scale is large, for example, in a Flink cluster with hundreds of nodes, we will find that a single Prometheus poses such a large bottleneck in the performance that it cannot meet the monitoring requirements.
How do we resolve this problem?
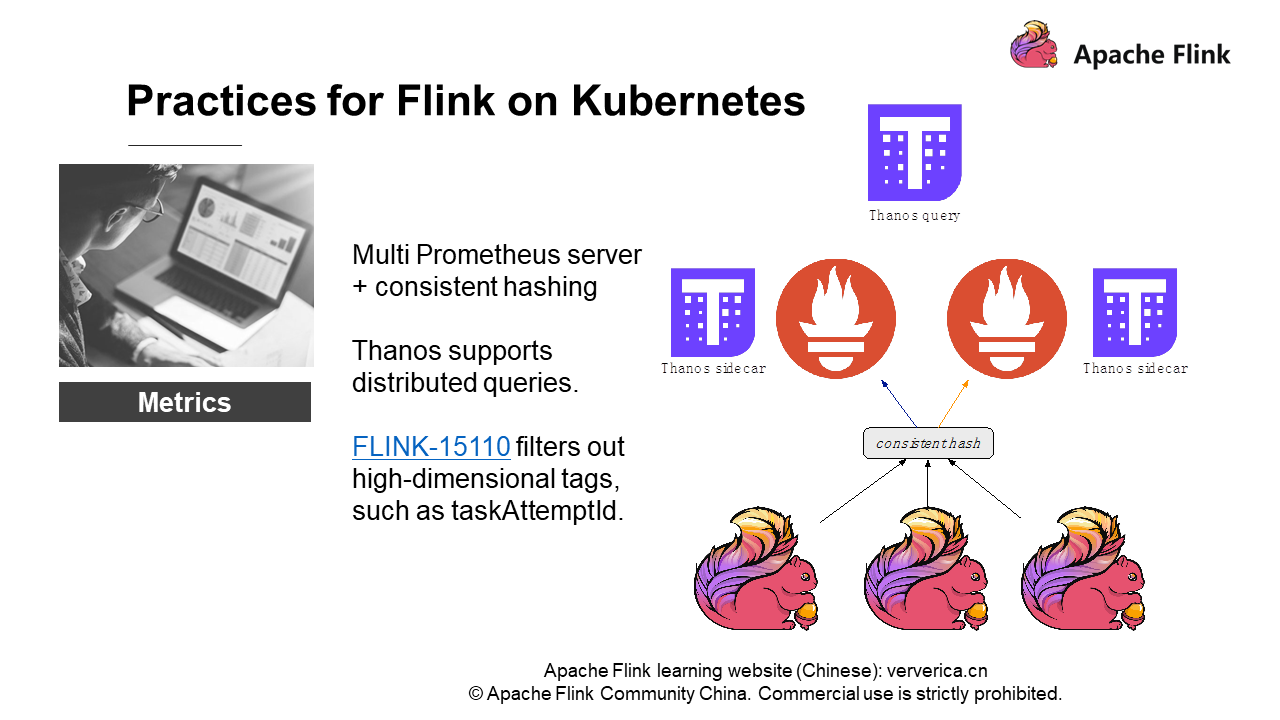
We implement consistent hashing for metrics of different Flink jobs. Of course, we do not send the metrics of a job to a Prometheus instance. Instead, we send the metrics of different scopes of a job to multiple Prometheus instances. Flink metrics strength from large to small are:
• JobManager/TaskManager metrics
• Job metrics (number of checkpoints, size, and number of failures)
• Task metrics
• Operator metrics (number of records to be processed per second, and number of bytes received).
Now, we implement consistent hashing for metrics based on their scopes, then send the hashing results to different Prometheus instances, and finally work with Thanos. Thanos is the name of the villain in "The Avengers 3". In my opinion, Thanos is an enhanced component that supports the distributed query of Prometheus metrics. Therefore, the Prometheus architecture allows the container where a single Prometheus instance is located to carry a Thanos sidecar.
The whole architecture has some limitations that require us to make consistent hashing. When Thanos is deployed with Prometheus, a piece of metrics data exists both in Prometheus A and Prometheus B for some reason. Then, there are certain rules in the Thanos query for abandoning the data, that is, remove one and the other data prevails. As a result, the line of the metrics chart on the UI is intermittent, causing an unfriendly experience. Therefore, we must implement consistent hashing and distributed queries through Thanos.
However, some performance issues may occur in the application of the whole solution. Why does Prometheus not perform well at Flink or at the job level, when it performs well on many service-level metrics? It lies in the rapid change of job metrics. Compared with monitoring HDFS and Hbase, the metrics of these components are limited and have low dimensions. Let's use a query scenario to explain the concept of dimensions. For example, we need to query all taskmanager_job_task_buffers_outPoolUsage of a task for a job in a host, that is, to use tags for query filtering. Then, Flink taskAttempId is an unfriendly tag. It is a uuid and changes whenever a job fails.
If a job keeps failing and persisting new tags to Prometheus and the database connected to Prometheus needs to create indexes for the tags, a large number of indexes need to be created. For example, high pressure on InfluxDB may cause the entire memory and CPU to become unavailable. This is not expected. Therefore, we also need to ask the community to filter out some high-dimensional tags in the report. If you are interested, you can follow FLINK-15110.
Let's first introduce network performance. No matter whether you use the Container Network Interface (CNI) or Kubernetes network plug-ins, network performance loss is inevitable. The common flannel has about 30% performance loss in some test projects. It is not very stable. Jobs often report PartitionNotFoundException Partition xx@host not found, which means that the downstream cannot obtain the upstream Partition.
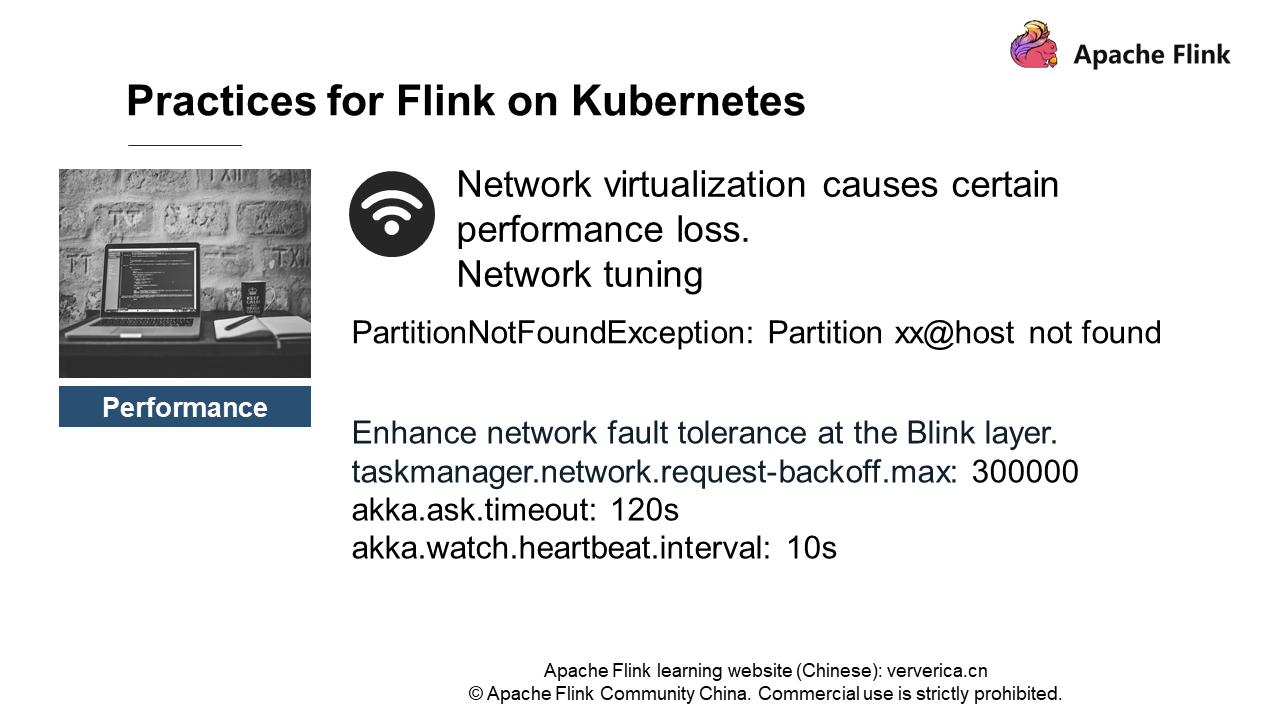
You can improve the network fault tolerance at the Flink layer. For example, set the taskmanager.network.request-backoff.max to 300 seconds, which is 10 seconds by default, and then set the Akka timeout value to a larger value.
Another nerve-wracking problem is that:
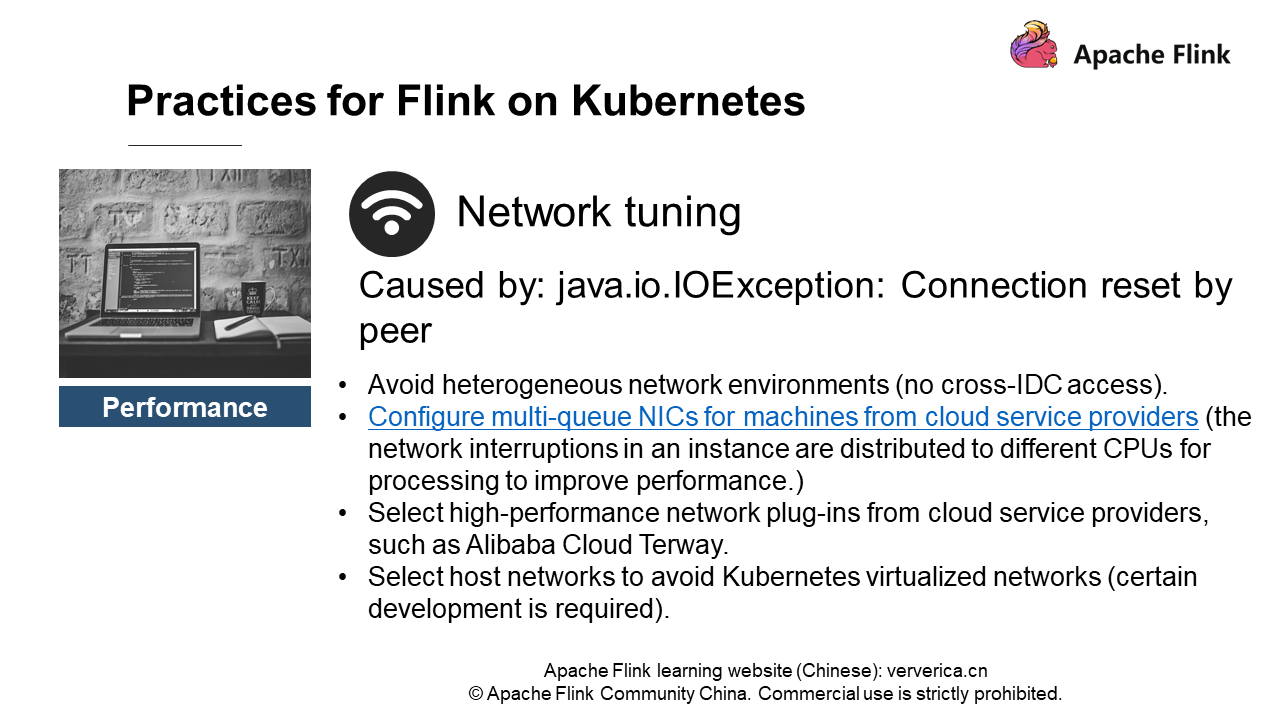
Connection reset by peers is often reported when a job is running. This is because Flink is designed to have high requirements on network stability. To ensure exactly once, when data transmission fails, the whole task fails and is restarted. Then, connection reset by peers is reported frequently. We have several solutions:
• Avoid heterogeneous network environments (no cross-IDC access).
• Configure multi-queue NICs for machines from cloud service providers (the network interruptions in an instance are distributed to different CPUs for processing to improve performance).
• Select high-performance network plug-ins from cloud service providers, such as Alibaba Cloud Terway.
• Select host networks to avoid Kubernetes virtualized networks (certain development is required).
First, we must ensure that the cluster does not run in a heterogeneous network environment. If Kubernetes hosts are located in different DCs, network jitter easily occurs during cross-IDC access. Then, we must configure multi-queue NICs for the machines from the cloud service providers. ECS virtual machines use certain CPU resources for network virtualization. If multi-queue NICs are not configured, the NICs may use only one or two cores, while virtualization uses both the two cores. In this case, packet loss occurs and a connection reset by peer error is reported.
Another solution is to select high-performance network plug-ins from cloud service providers. For example, Terway provided by Alibaba Cloud supports the same performance as host networks. It does not cause performance loss like flannel.
Finally, if Terway is unavailable, we can use host networks to avoid Kubernetes virtualized networks. However, this solution requires some development over Flink. If you are using Kubernetes, it seems strange to use host networks in a certain sense. This does not conform to the Kubernetes style. We also have some machines that cannot use Terway, and we encounter the same problem. We also provide corresponding projects. We use host networks instead of overlay's flannel.
Next, we will talk about disk performance. As mentioned earlier, all virtualized things will cause some performance loss. If RocksDB needs to read and write local disks, overlay's file system will cause about 30% performance loss.
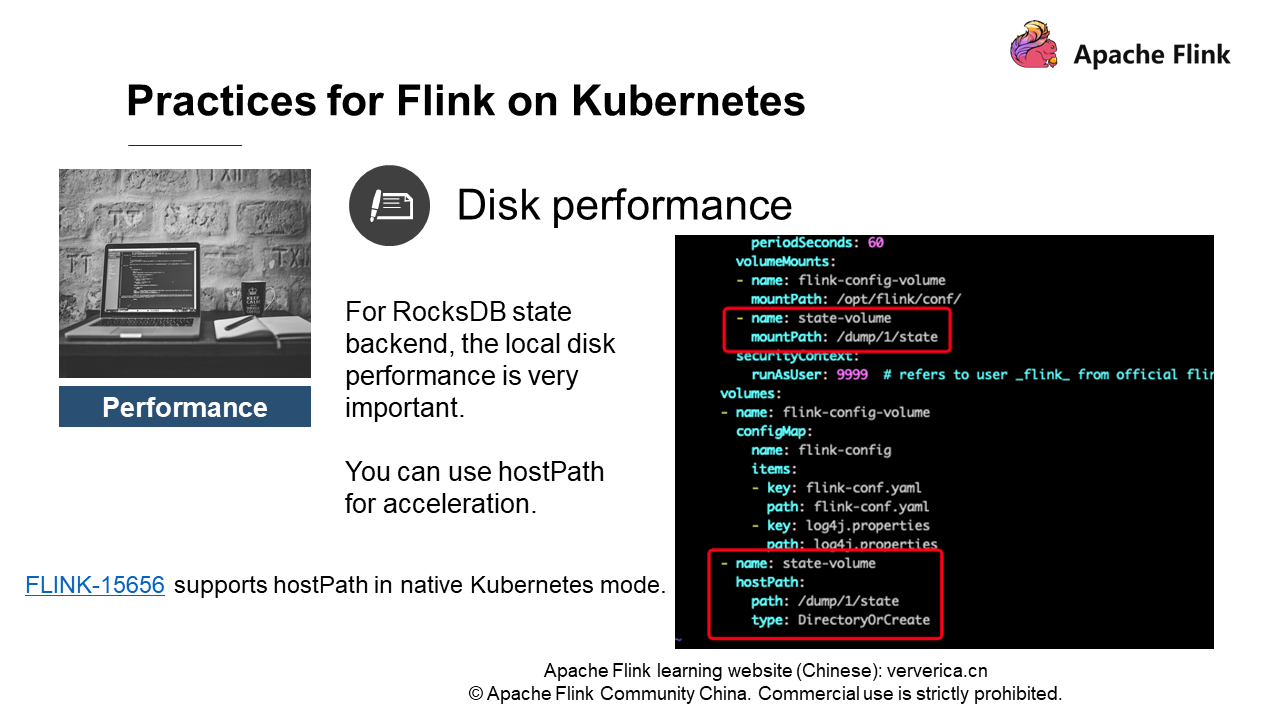
What should we do? We choose to use hostPath. Simply put, pods can access the physical disk of the host. See the definition of hostPath on the right of the preceding figure. Of course, you need to ensure in advance that the user of the Flink image has the permission to access the host directory. Therefore, you'd better change the directory permission to 777 or 775.
If you want to use this feature, you can view Flink-15656, which provides a pod template. You can adjust it yourself. We know that Kubernetes provides a variety of complex features, and it is infeasible to adjust Flink for every feature. You can define hostPath in a template and then the pods you write can access the directory based on the hostPath in the template.
OOM killed is also a nerve-wracking issue. When we deploy a service in a container environment, we must set the memory and CPU resources required by pods in advance. Then Kubernetes will specify configurations to apply for scheduling resources on the relevant nodes (hosts). In addition to specifying the request parameters, you must set the limit parameters to limit the requested memory and CPU resources.
For example, a node has a physical memory of 64 GB and eight pods are requested, with each having 8 GB memory. It seems to be all right. But what if there is no limit to the eight pods? Each pod may use 10 GB memory, and therefore they need to compete for resources. As a result, one pod runs normally while another pod may be killed suddenly. Therefore, we need to set a memory limit. A pod may exit inexplicably due to memory limit. When you check the Kubernetes events, you will find that the pod is killed due to OOM. If you have used Kubernetes, you must have encountered this problem.
How do we troubleshoot it?
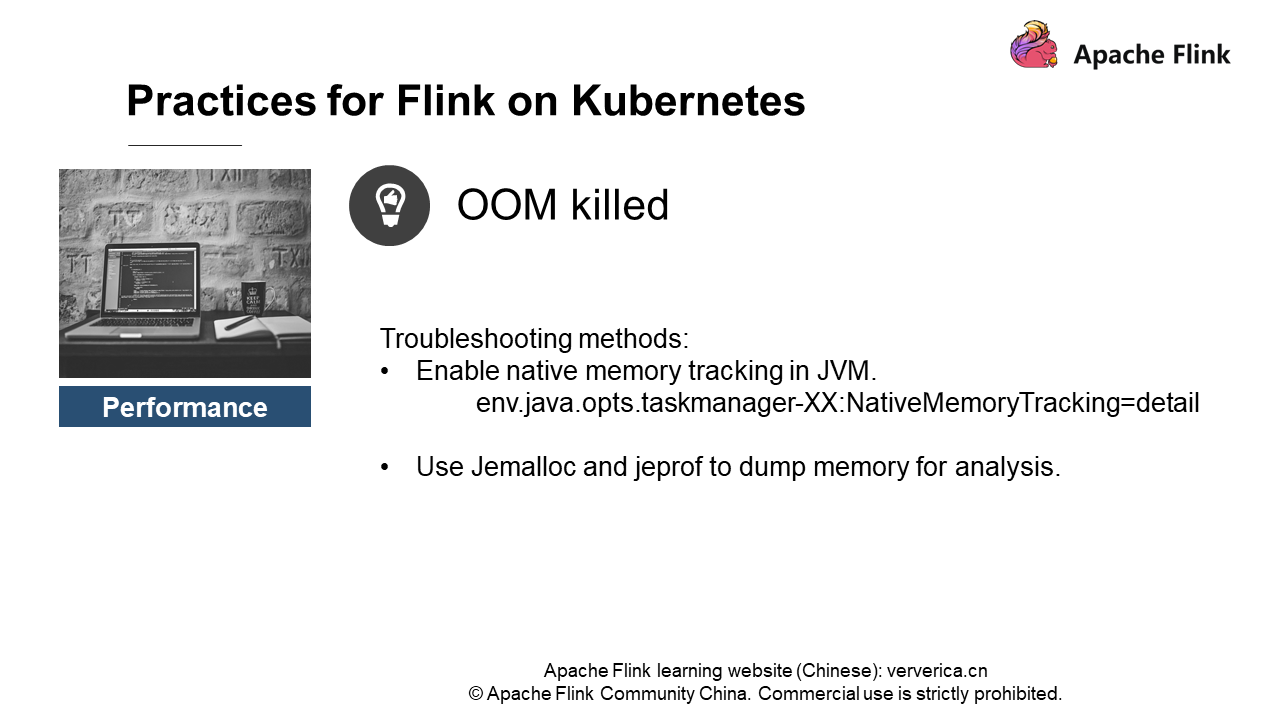
The first solution is that we can enable native memory tracking in JVM to regularly check memory. In this way, we can only check the native memory (including Metaspace) requested by JVM, and cannot check the memory not requested by JVM. Another solution is that we can use Jemalloc and jeprof to dump memory for analysis on a regular basis.
To be honest, we rarely use the second solution. We used to apply this solution to YARN, as we found that some jobs occupy a huge memory. Because JVM will limit the largest memory, there must be something wrong with the native memory. Then, we can analyze the memory through Jemalloc and jeprof to find the exact native memory. For example, some users parse the configuration file on their own. They decompress the file each time before they parse the file, and finally the memory is exhausted.
This is a scenario that causes OOM. It is more likely that RocksDB triggers OOM if you use RocksDB, a state backend that saves native memory. Therefore, we have contributed a feature in Flink 1.10 to the community. The feature manages the RocksDB memory and is controlled by the state.backend.rocksdb.memory.managed parameter. This feature is enabled by default.
What is the following figure about?
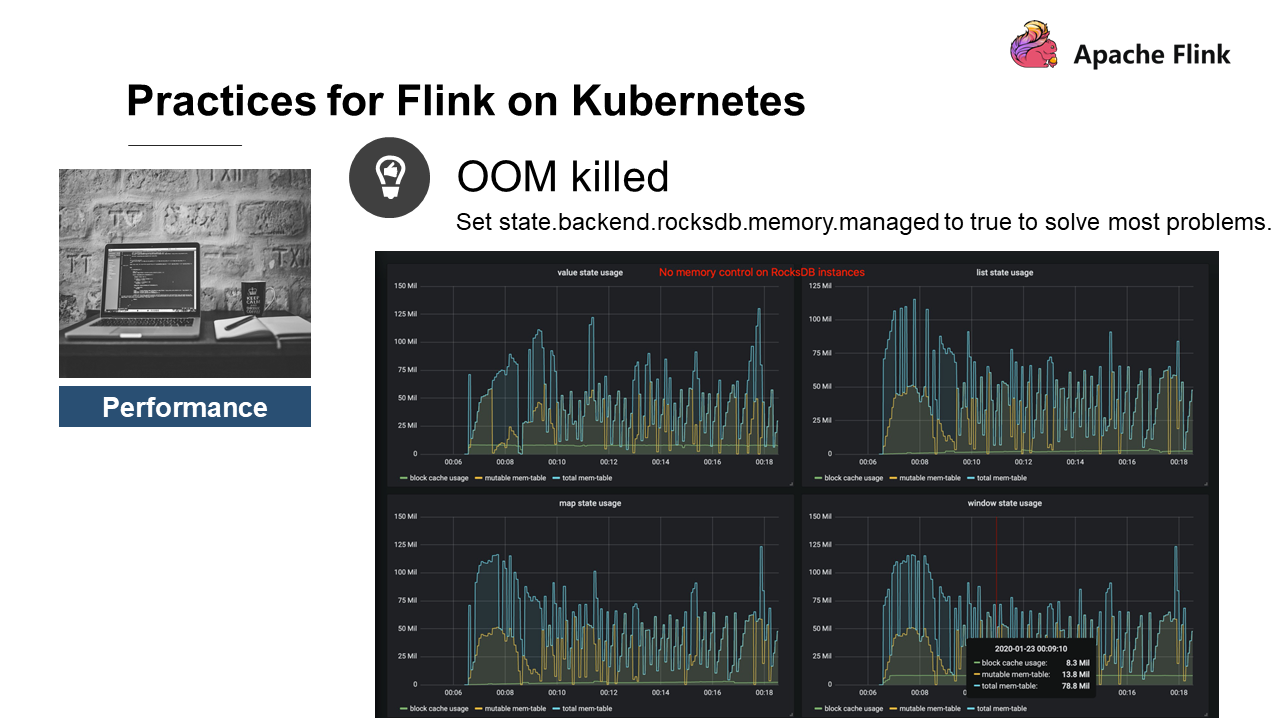
RocksDB has no memory control. There are four states: value, list, map, and window. The top line describes the size of the total memory currently used by RocksDB, which equals the block cache usage plus RocksDB's write buffer. We can see that the total memory usage of the four states is over 400 MB.
The reason is that the Flink RocksDB currently does not limit the number of states. A state is a Column Family, which exclusively occupies the write buffer and block cache. By default, a Column Family can occupy up to two 64 MB write buffers and one 8 MB block cache. A state uses 136 MB, and four states uses 544 MB.
If we enable the state.backend.rocksdb.memory.managed, the four states use the block cache with basically the same trend:
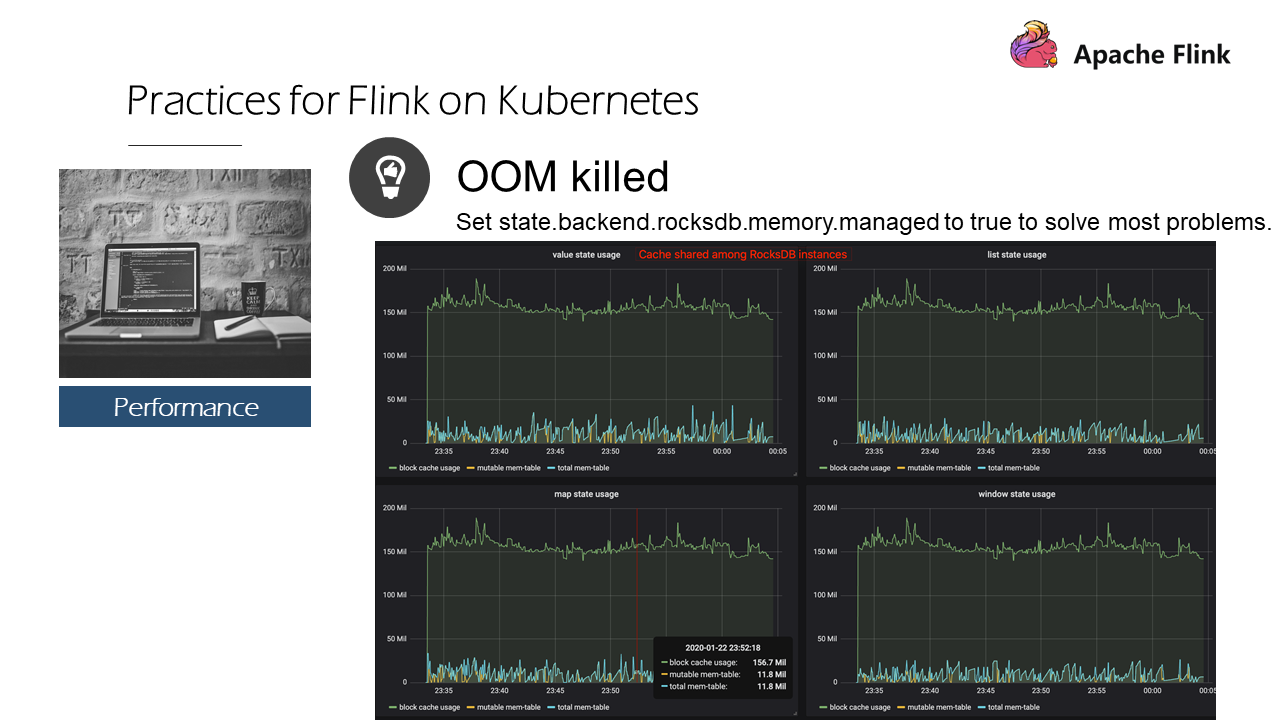
Why? This is because the cache sharing function is used. That is, an LRU cache is created in a state to distribute and schedule the memory no matter what the situation is, and then release the least recently used memory. Therefore, in Flink 1.10 and later versions, we can enable the state.backend.rocksdb.memory.managed to solve most of the problems.
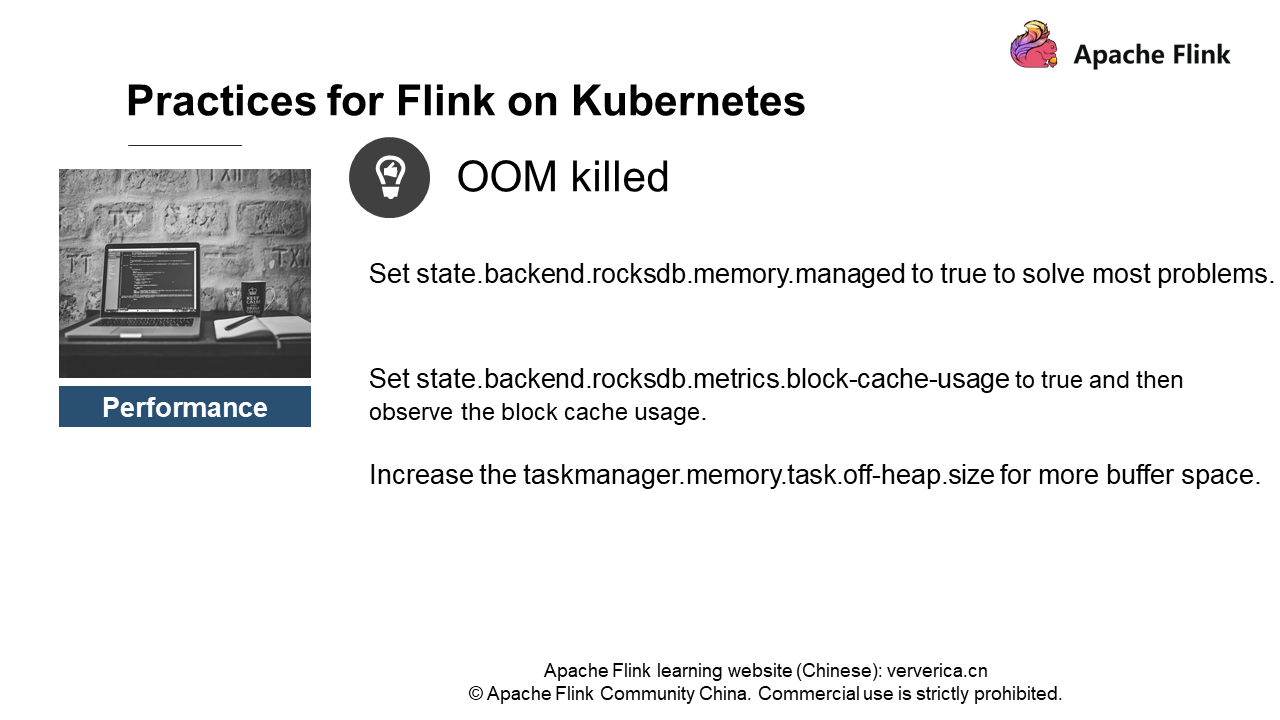
However, during development, we found that RocksDB cache sharing is not designed so well. This involves some implementation details, such as the inability to implement strict cache. If you enable RocksDB cache sharing, you may encounter strange NPE problems. So RocksDB cache sharing does not perform well in specific scenarios. If this is the case, you may need to increase the taskmanager.memory.task.off-heap.size for more buffer space.
Of course, we first need to know the memory it uses. In the memory monitoring chart we just showed, you need to set the parameter state.backend.rocksdb.metrics.block-cache-usage to true. Then, we can acquire relevant metrics in the metrics monitoring figure and observe the size of memory overuse. For example, the default manager for a 1 GB state TM uses 294 MB.
The manager may occasionally occupy 300 MB or 310 MB. In this case, you can adjust the parameter taskmanager.memory.task.off-heap.size (the default value is 0) to increase some memory, such as 64 MB memory. It means that an extra space is created in the off-heap requested by Flink to add a buffer for RocksDB, so that it will not be killed due to OOM. This is a solution that we can use currently. But we need to work with the RocksDB community for a fundamental solution.
If you have encountered similar problems, just communicate with us. We are very happy to observe and track related problems with you.
The last part demonstrates how to use the hostPath. Most of the yaml files are the same as the community instances. You need to modify the yaml file of a task manager as follows:
apiVersion: apps/v1
kind: Deployment
metadata:
  name: flink-taskmanager
spec:
  replicas: 2
  selector:
    matchLabels:
      app: flink
      component: taskmanager
  template:
    metadata:
      labels:
        app: flink
        component: taskmanager
    spec:
      containers:
      - name: taskmanager
        image: reg.docker.alibaba-inc.com/chagan/flink:latest
        workingDir: /opt/flink
        command: ["/bin/bash", "-c", "$FLINK_HOME/bin/taskmanager.sh start; \
          while :;
          do
            if [[ -f $(find log -name '*taskmanager*.log' -print -quit) ]];
              then tail -f -n +1 log/*taskmanager*.log;
            fi;
          done"]
        ports:
        - containerPort: 6122
          name: rpc
        livenessProbe:
          tcpSocket:
            port: 6122
          initialDelaySeconds: 30
          periodSeconds: 60
        volumeMounts:
        - name: flink-config-volume
          mountPath: /opt/flink/conf/
        - name: state-volume
          mountPath: /dump/1/state
        securityContext:
          runAsUser: 9999  # refers to user _flink_ from official flink image, change if necessary
      volumes:
      - name: flink-config-volume
        configMap:
          name: flink-config
          items:
          - key: flink-conf.yaml
            path: flink-conf.yaml
          - key: log4j.properties
            path: log4j.properties
      - name: state-volume
        hostPath:
          path: /dump/1/state
type: DirectoryOrCreate1. How does Flink use Kubernetes pods to interact with HDFS?
The interaction between Flink and HDFS is simple. Just copy the relevant dependencies to the image. You can put the flink-shaded-hadoop-2-uber-{hadoopVersion}-{flinkVersion}.jar into the flink-home/lib directory, and then put some Hadoop configurations such as hdfs-site.xml and core-site.xml into an accessible directory. Then, Flink can access HDFS. The process is the same as that of accessing HDFS from a node in a non-HDFS cluster.
2. How does Flink on Kubernetes ensure HA?
The HA of a Flink cluster has nothing to do with whether Flink runs on Kubernetes. The HA of a community Flink cluster requires support of ZooKeeper. HA requires ZooKeeper to implement checkpoint Id counter, checkpoint stop, and streaming graph stop. Therefore, the core of HA is to provide ZooKeeper services on Flink on Kubernetes clusters. A ZooKeeper cluster can be deployed on Kubernetes or on physical hosts. Meanwhile, the community has also tried to use etcd in Kubernetes to provide an HA solution. Currently, only ZooKeeper can provide industrial-grade HA.
3. Which one is better, Flink on Kubernetes or Flink on YARN? How can we make a choice?
Flink on YARN is a relatively mature system at present, but it is not cloud-native. Under the trend of migrating services to the cloud, Flink on Kubernetes has a bright future. Flink on YARN was a mature system, but it may not be able to meet new needs or challenges. For example, Kubernetes performs better in GPU scheduling and pipeline creation than YARN.
If you just run a job, it can run stably on Flink on YARN, which is relatively mature. By contrast, Flink on Kubernetes is new, popular, and easy to iterate. However, Flink on Kubernetes features a steep learning curve, and requires the support of a sound Kubernetes O&M team. In addition, Kubernetes virtualization inevitably causes certain performance loss to the disks and networks. This is a slight disadvantage. Of course, virtualization (containerization) brings more obvious advantages.
4. How do we configure the /etc/hosts file? To interact with HDFS, the HDFS node IP address and host need to be mapped to the /etc/hosts file.
You can mount the ConfigMap content through Volume and map the ConfigMap content to /etc/hosts, or just rely on CoDNS without modifying /etc/hosts.
5. How do you troubleshoot Flink on Kubernetes well?
First, we need to figure out the difference between Flink on Kubernetes and Flink on YARN in terms of troubleshooting? There may be something wrong with Kubernetes itself, which is a little bit of trouble. Kubernetes can be regarded as an operating system with a large number of complex components. YARN is a Java-based resource scheduler. Most cluster exceptions are caused by host failures. In my opinion, it is more difficult to troubleshoot Kubernetes than YARN. Kubernetes has many components. If the DNS parsing goes wrong, check the CoDNS logs. For network or disk errors, you need to check the kube events. If pods exit abnormally, you need to figure out why event pods exit. To be honest, it does need some support, especially the O&M support.
As for Flink troubleshooting, the troubleshooting methods are the same for Kubernetes and YARN:
• Check logs for exceptions.
• For performance problems, use jstack to check the CPU and call stacks for any exceptions.
• If OOM risks always exist or full GC is easy to trigger, use jmap to check the block that occupies memory or analyze for any memory leakage.
These troubleshooting methods are independent of the platform and apply to all scenarios. Note that pod images may lack some debugging tools. We recommend that you create private images and install the corresponding debugging tools when you build a Flink on Kubernetes cluster.

206 posts | 58 followers
FollowApache Flink Community China - September 16, 2020
Apache Flink Community China - April 23, 2020
Apache Flink Community China - September 27, 2020
Apache Flink Community China - April 23, 2020
Apache Flink Community China - July 28, 2020
Apache Flink Community China - July 28, 2020

206 posts | 58 followers
Follow Cloud-Native Applications Management Solution
Accelerate and secure the development, deployment, and management of containerized applications cost-effectively.
Learn More Container Service for Kubernetes
Alibaba Cloud Container Service for Kubernetes is a fully managed cloud container management service that supports native Kubernetes and integrates with other Alibaba Cloud products.
Learn More ACK One
Provides a control plane to allow users to manage Kubernetes clusters that run based on different infrastructure resources
Learn More Managed Service for Prometheus
Multi-source metrics are aggregated to monitor the status of your business and services in real time.
Learn MoreMore Posts by Apache Flink Community