
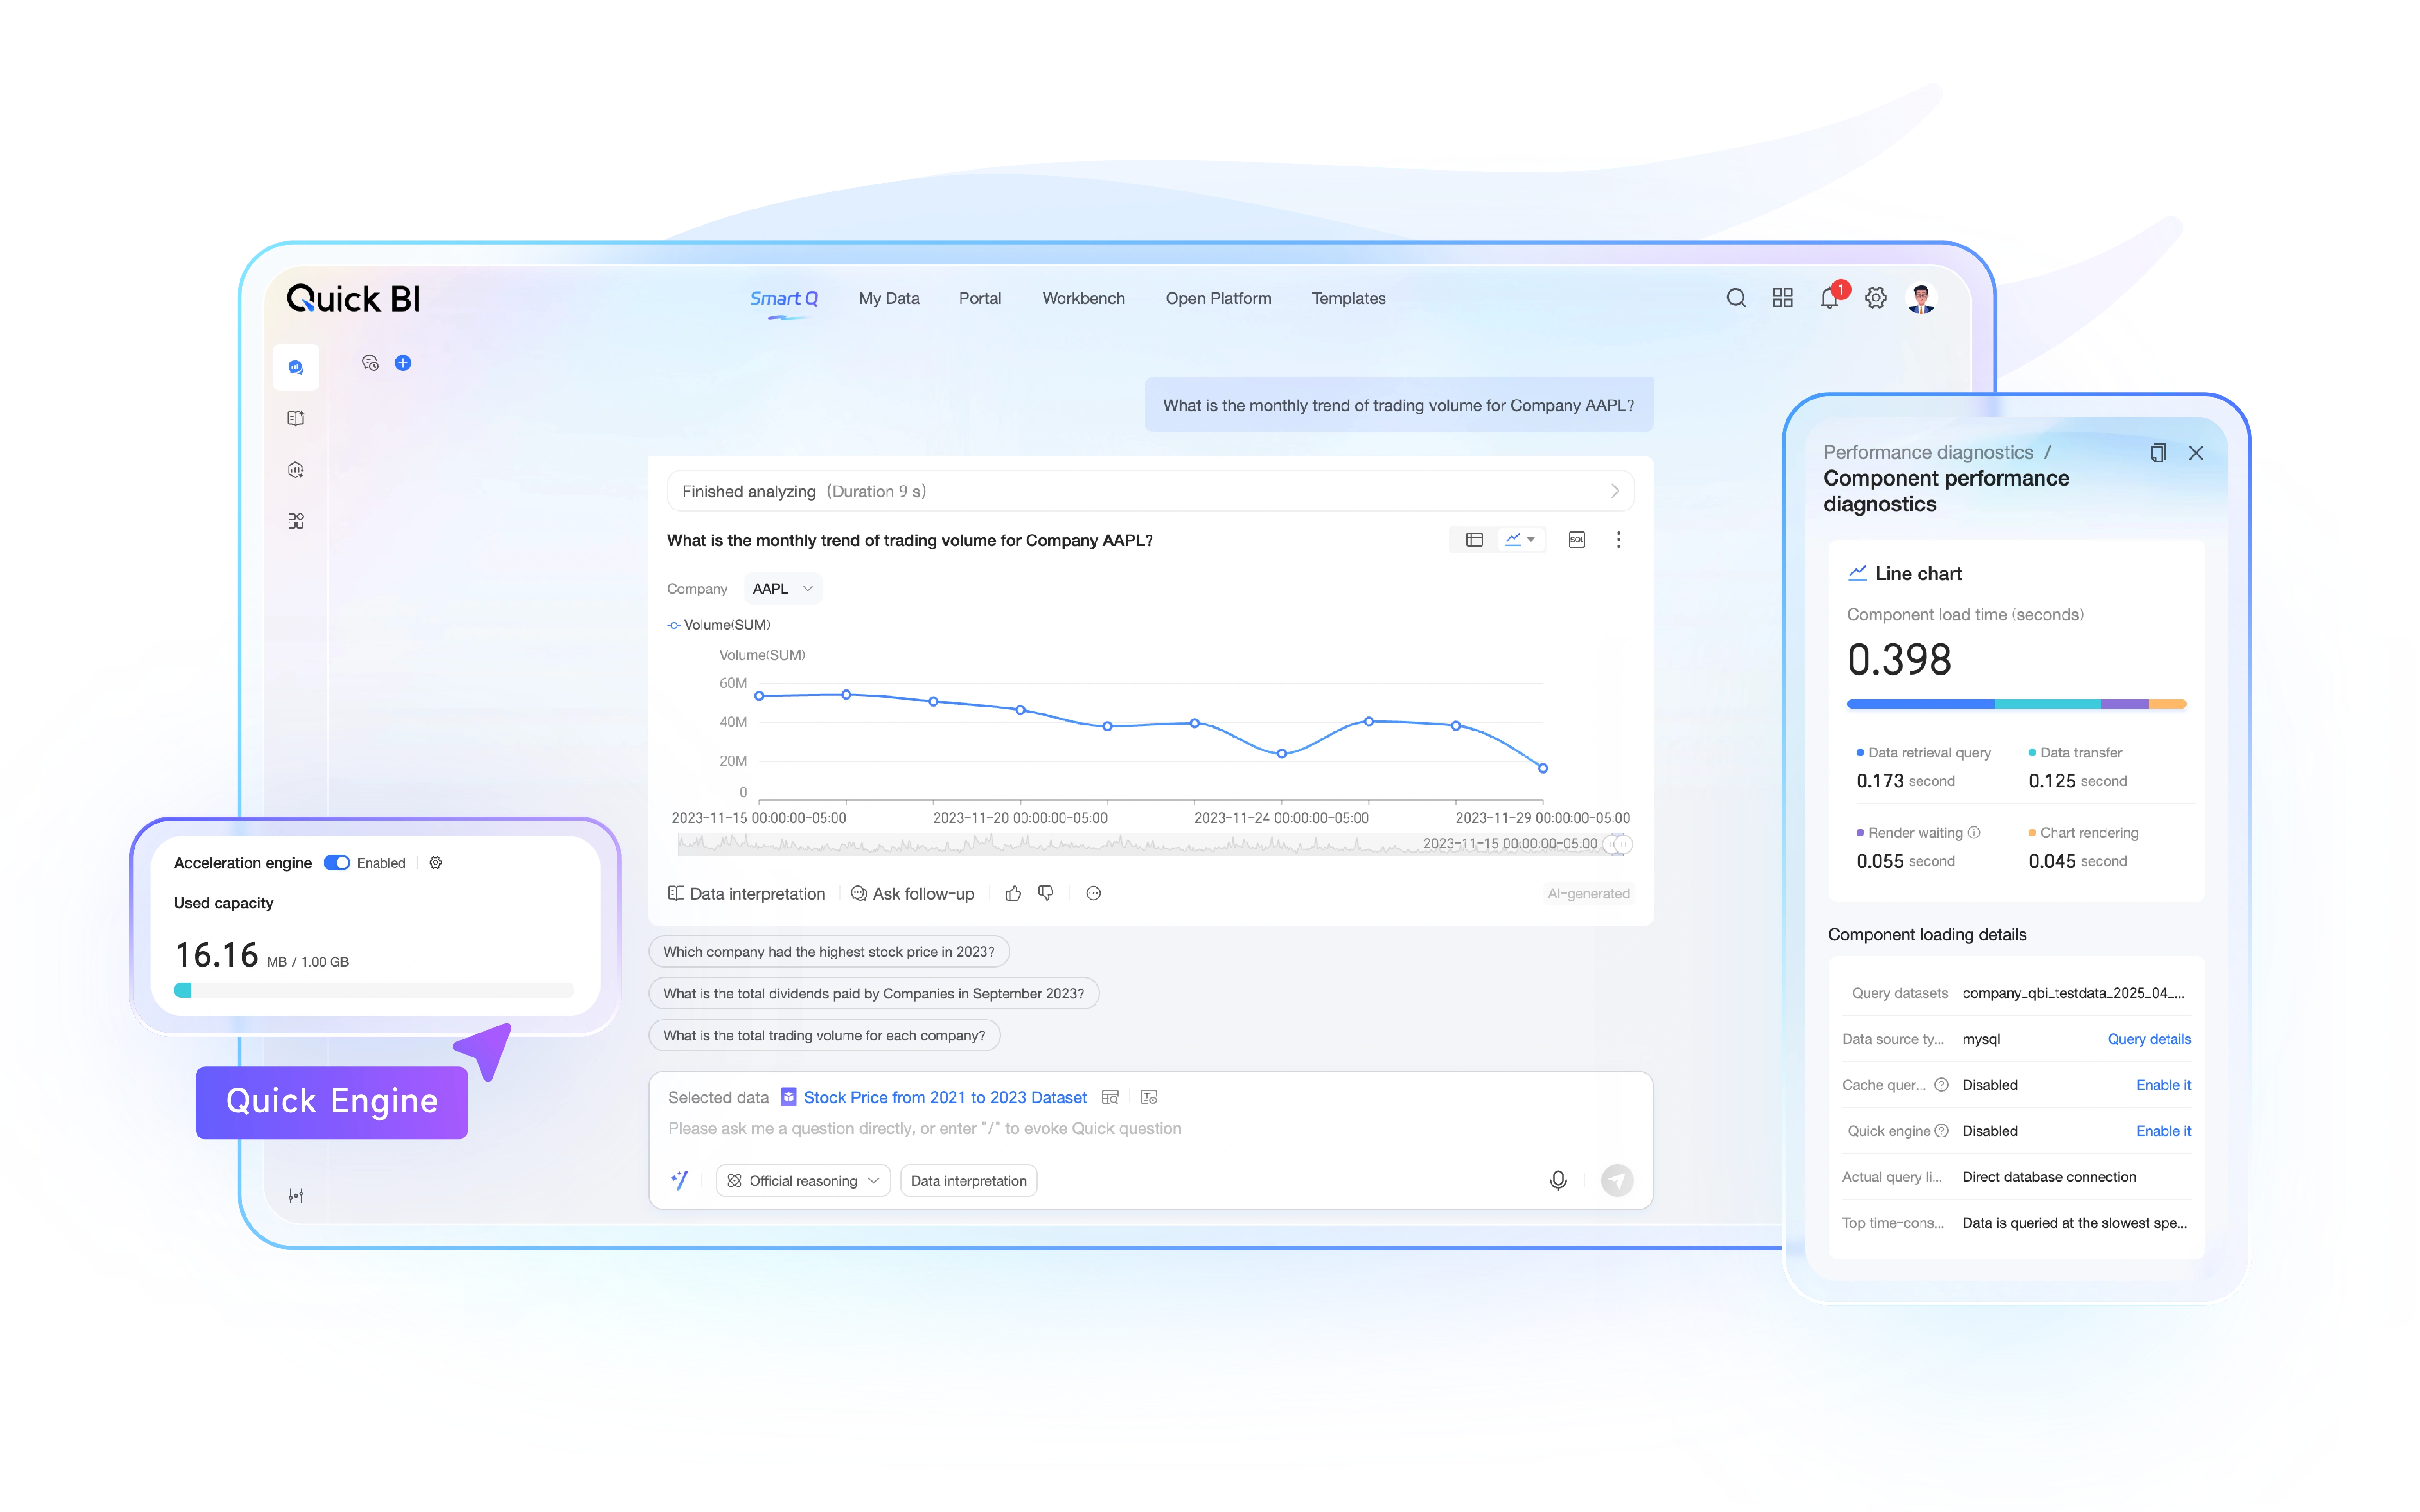
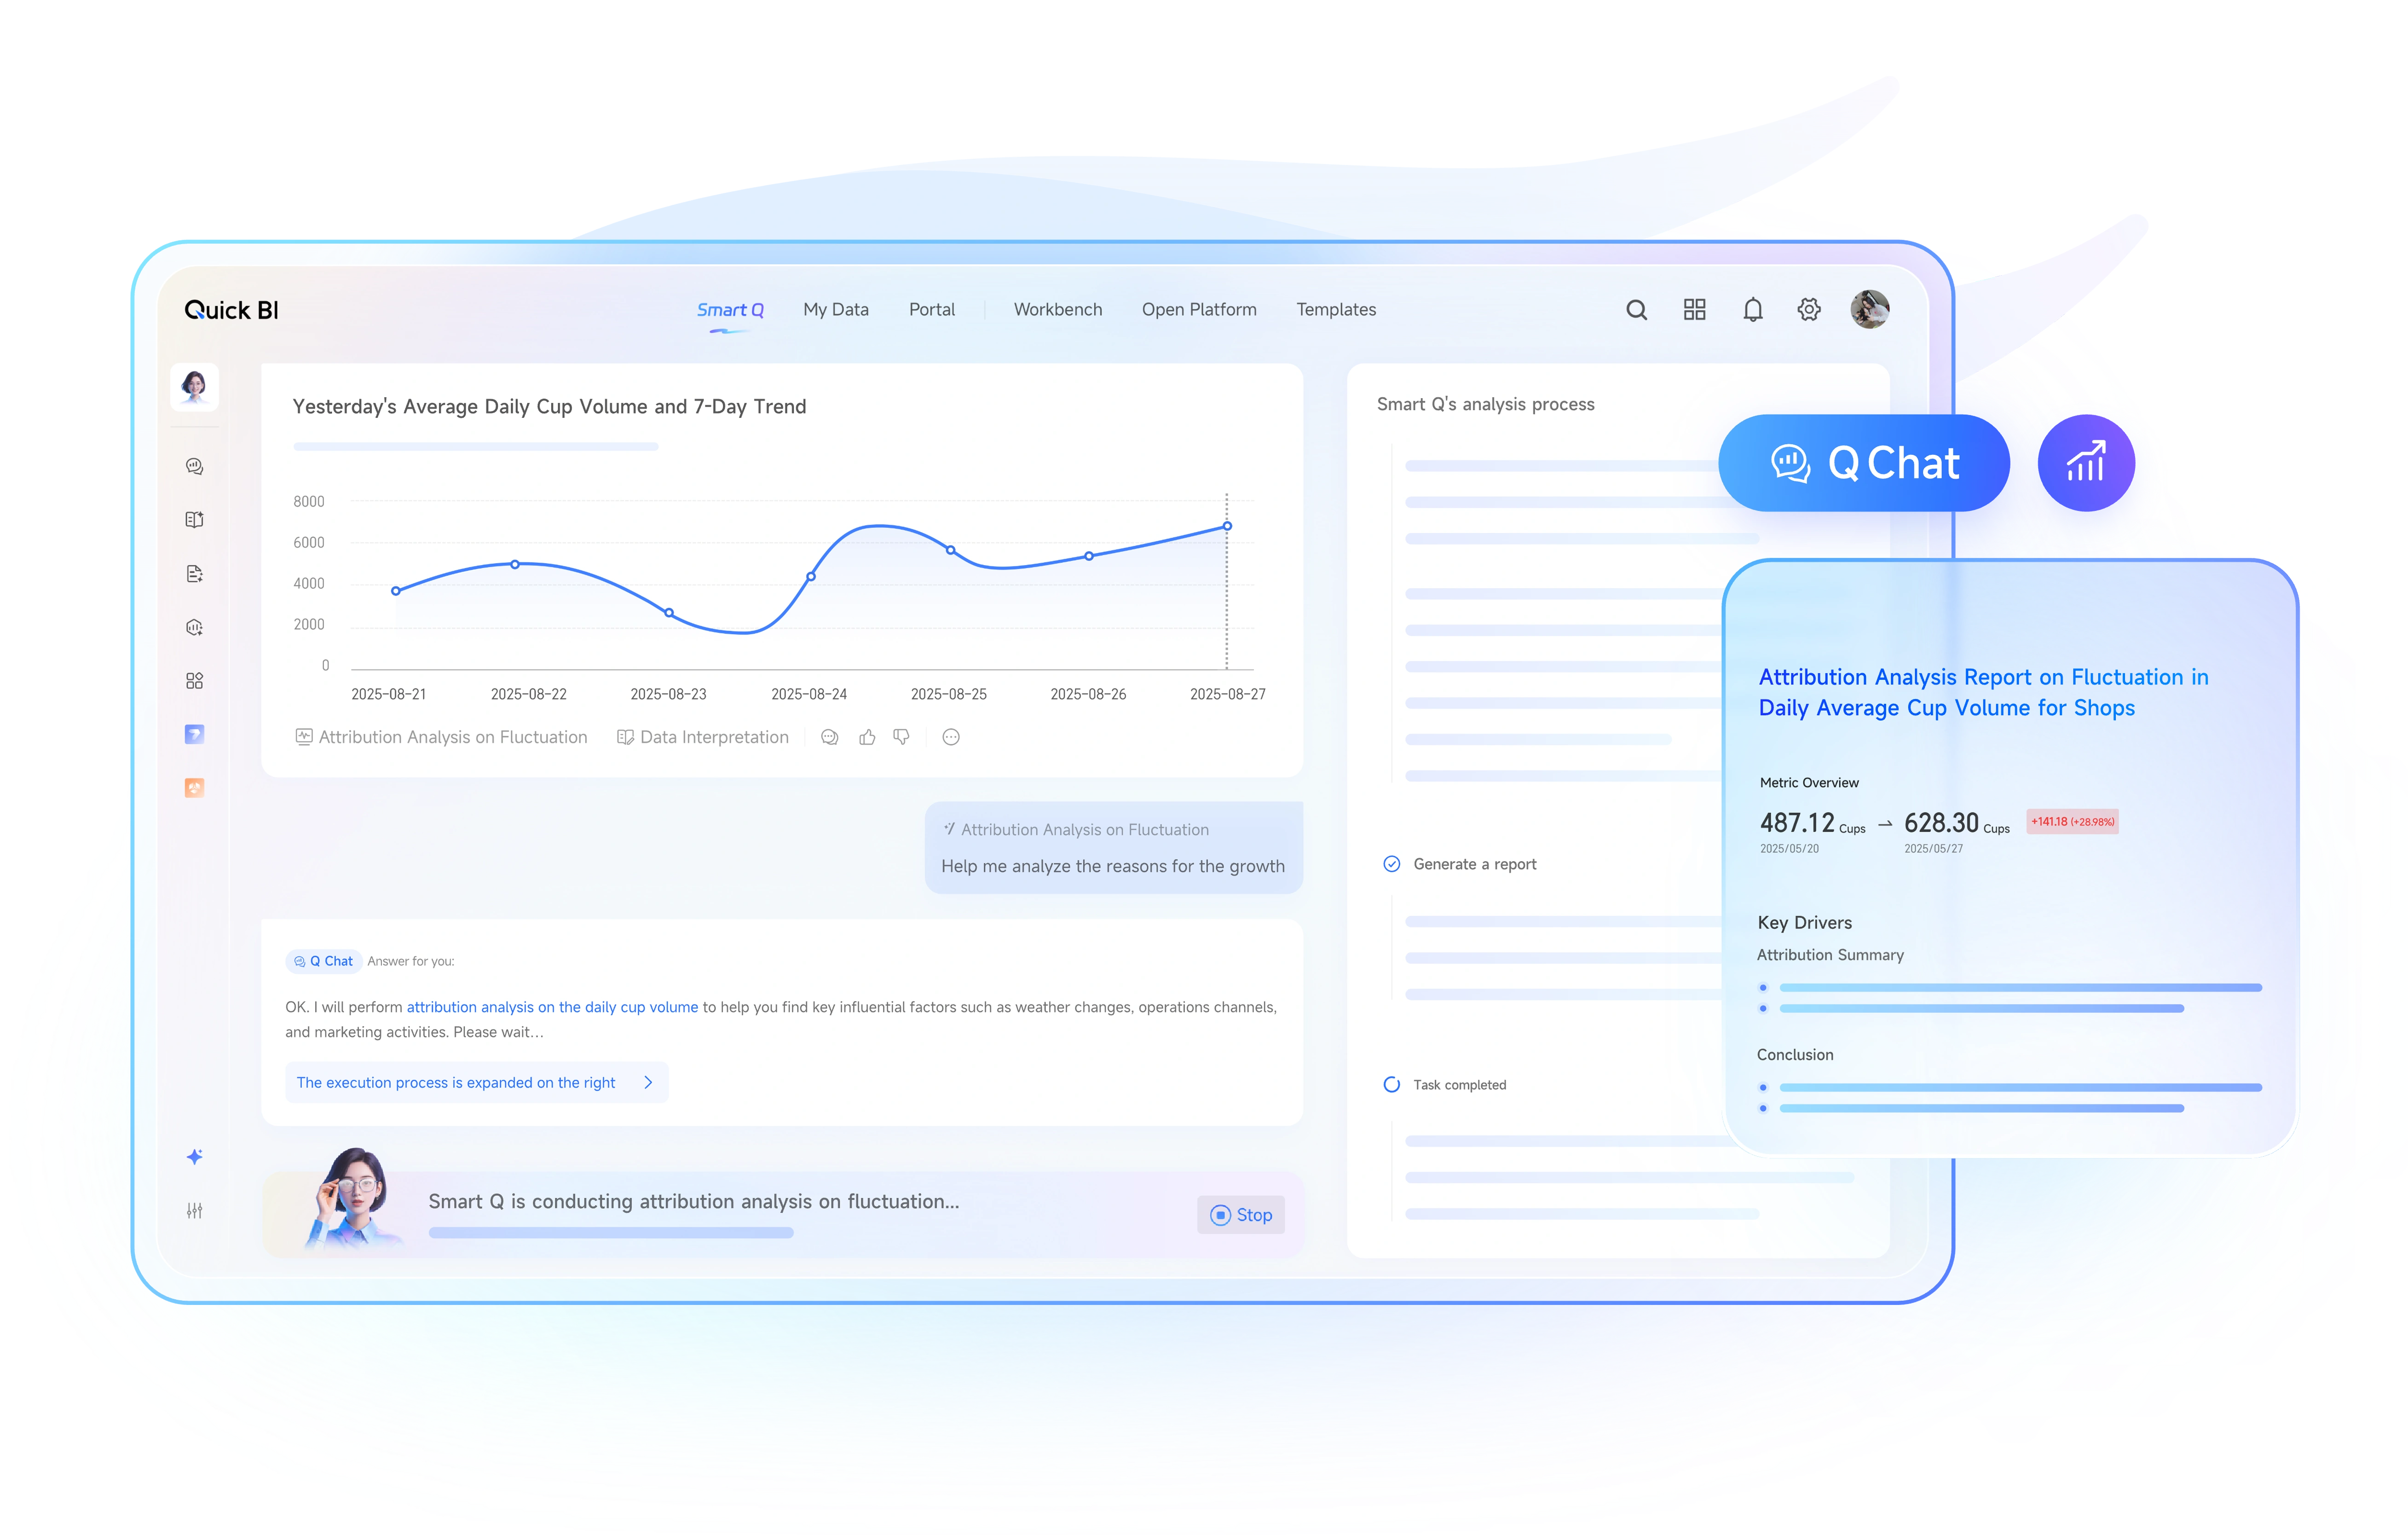
Q Chat interacts with your data in natural language — delivering instant, accurate insights, making data Q&A effortless, and empowering everyone to analyze with ease.
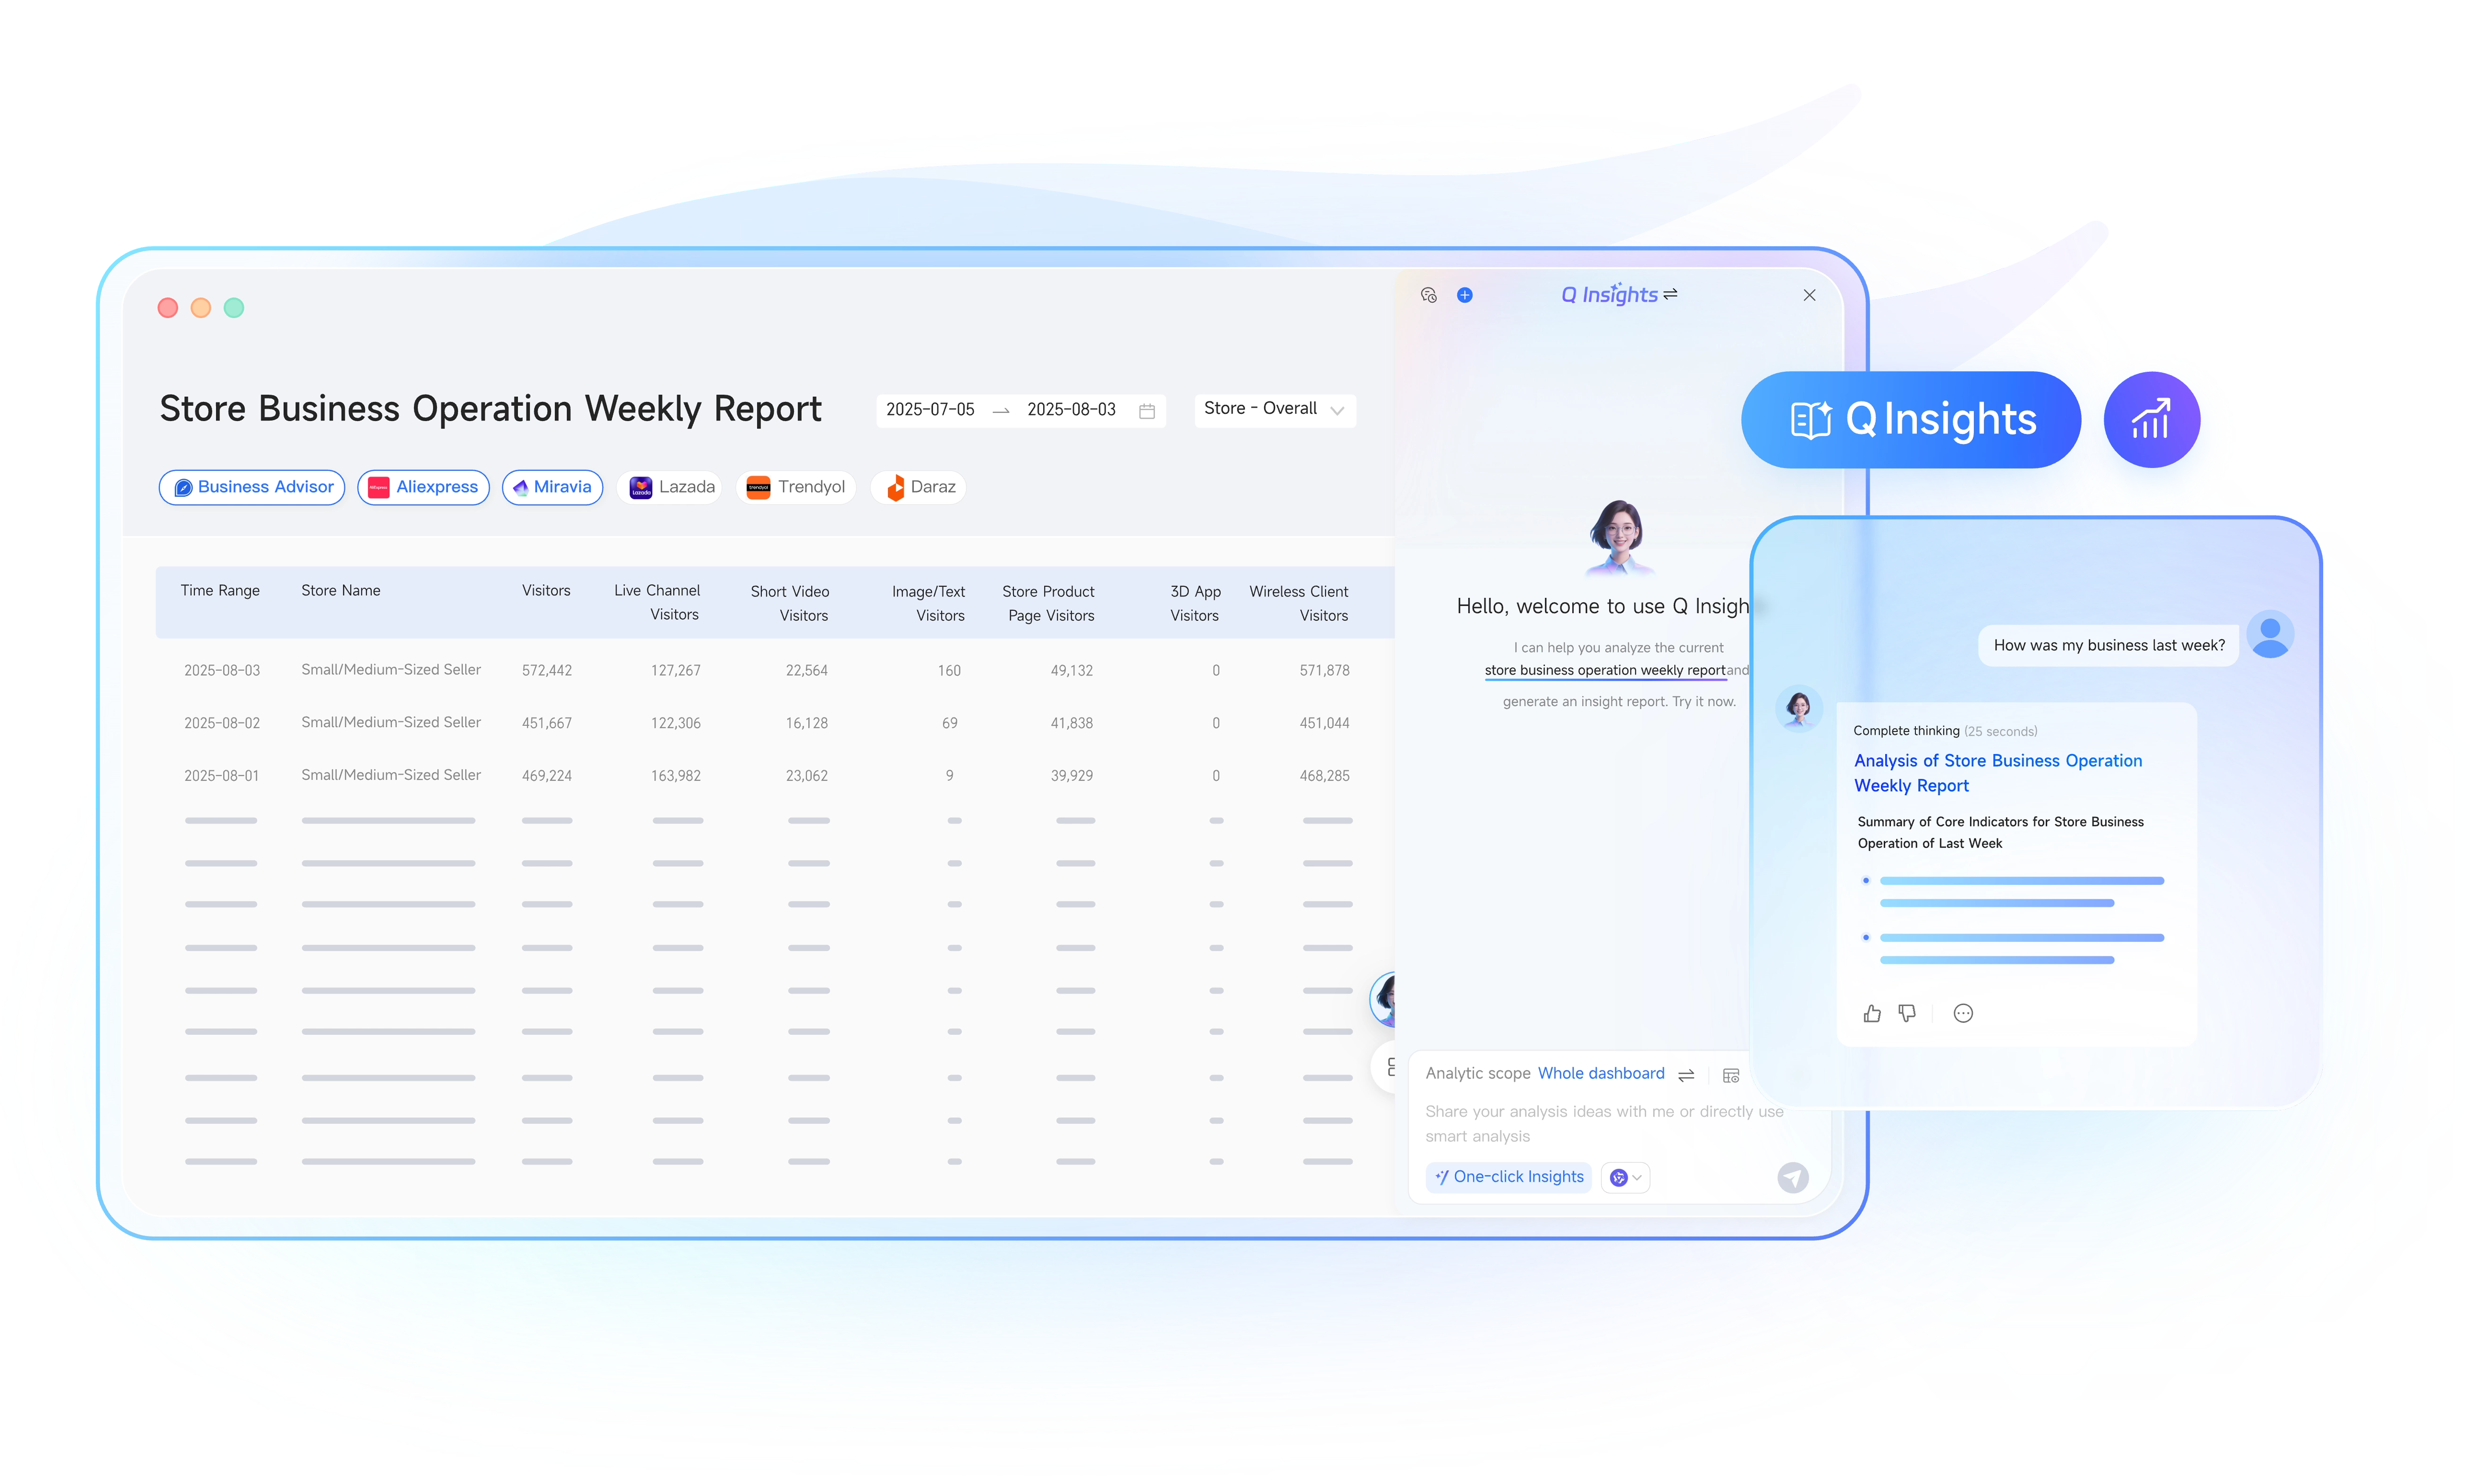
Q Insights leverages leading large language models to deeply analyze dashboard data, uncover key patterns and business drivers, and deliver comprehensive, actionable insights for smarter analytics.
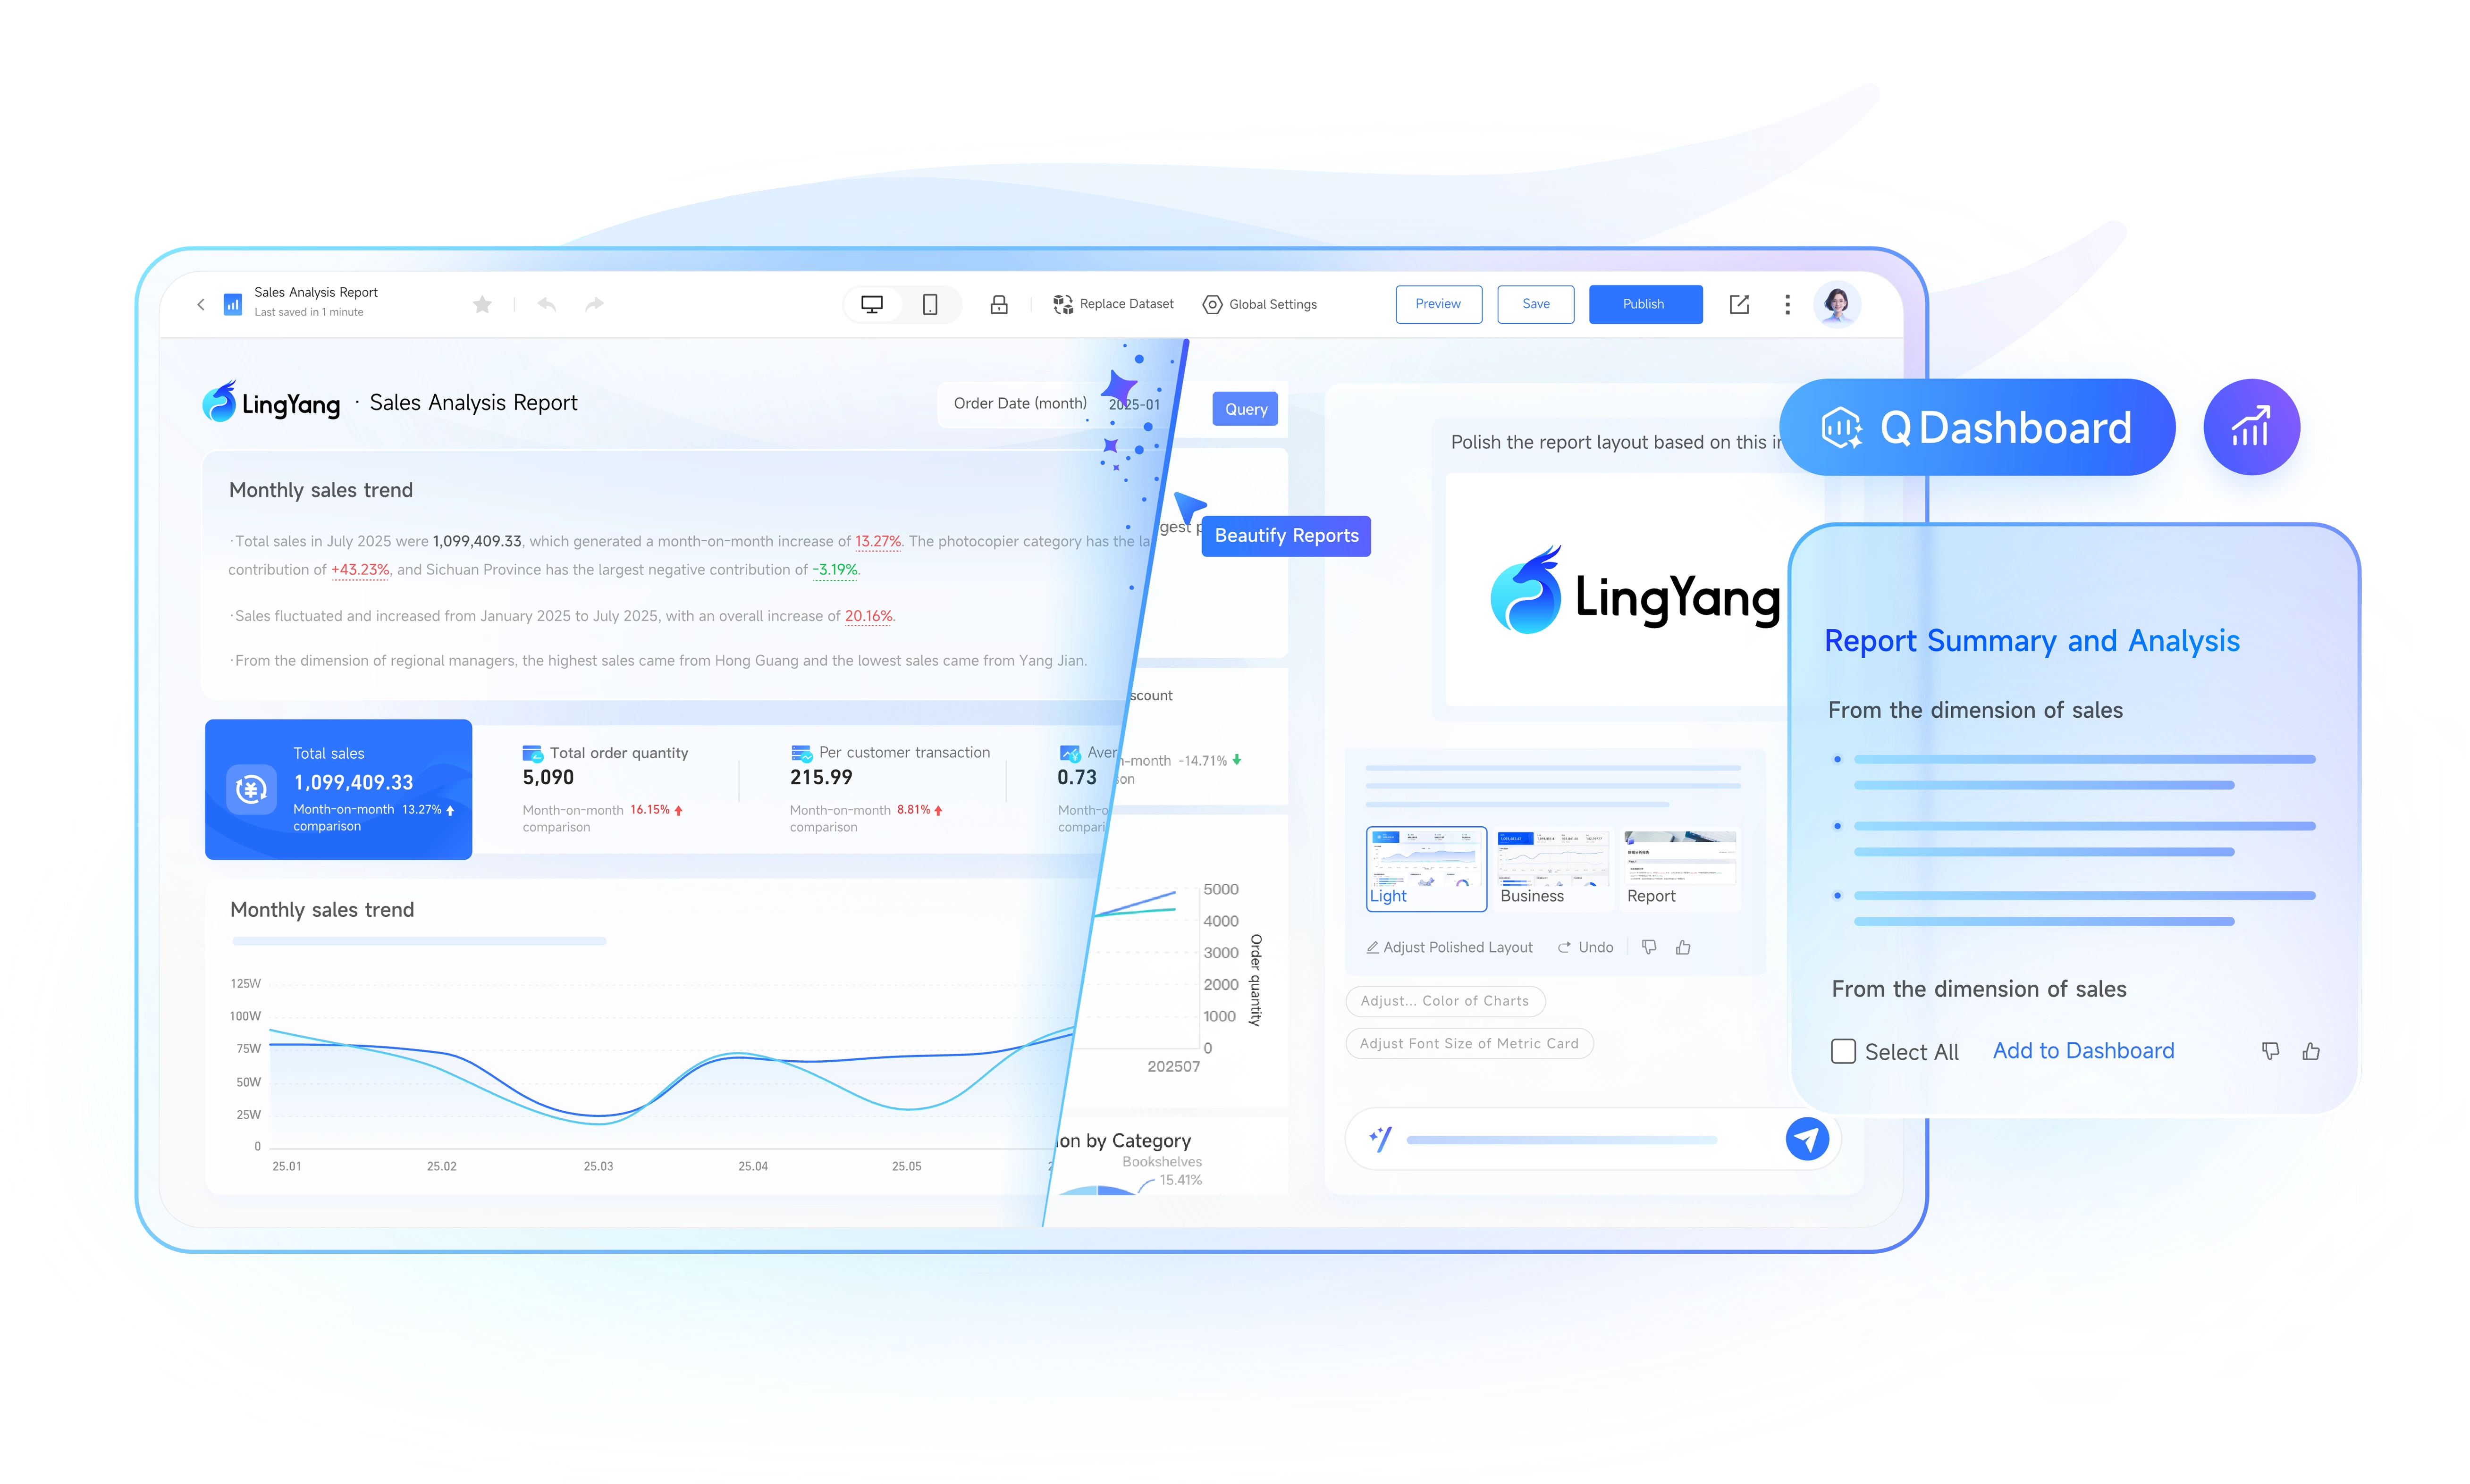
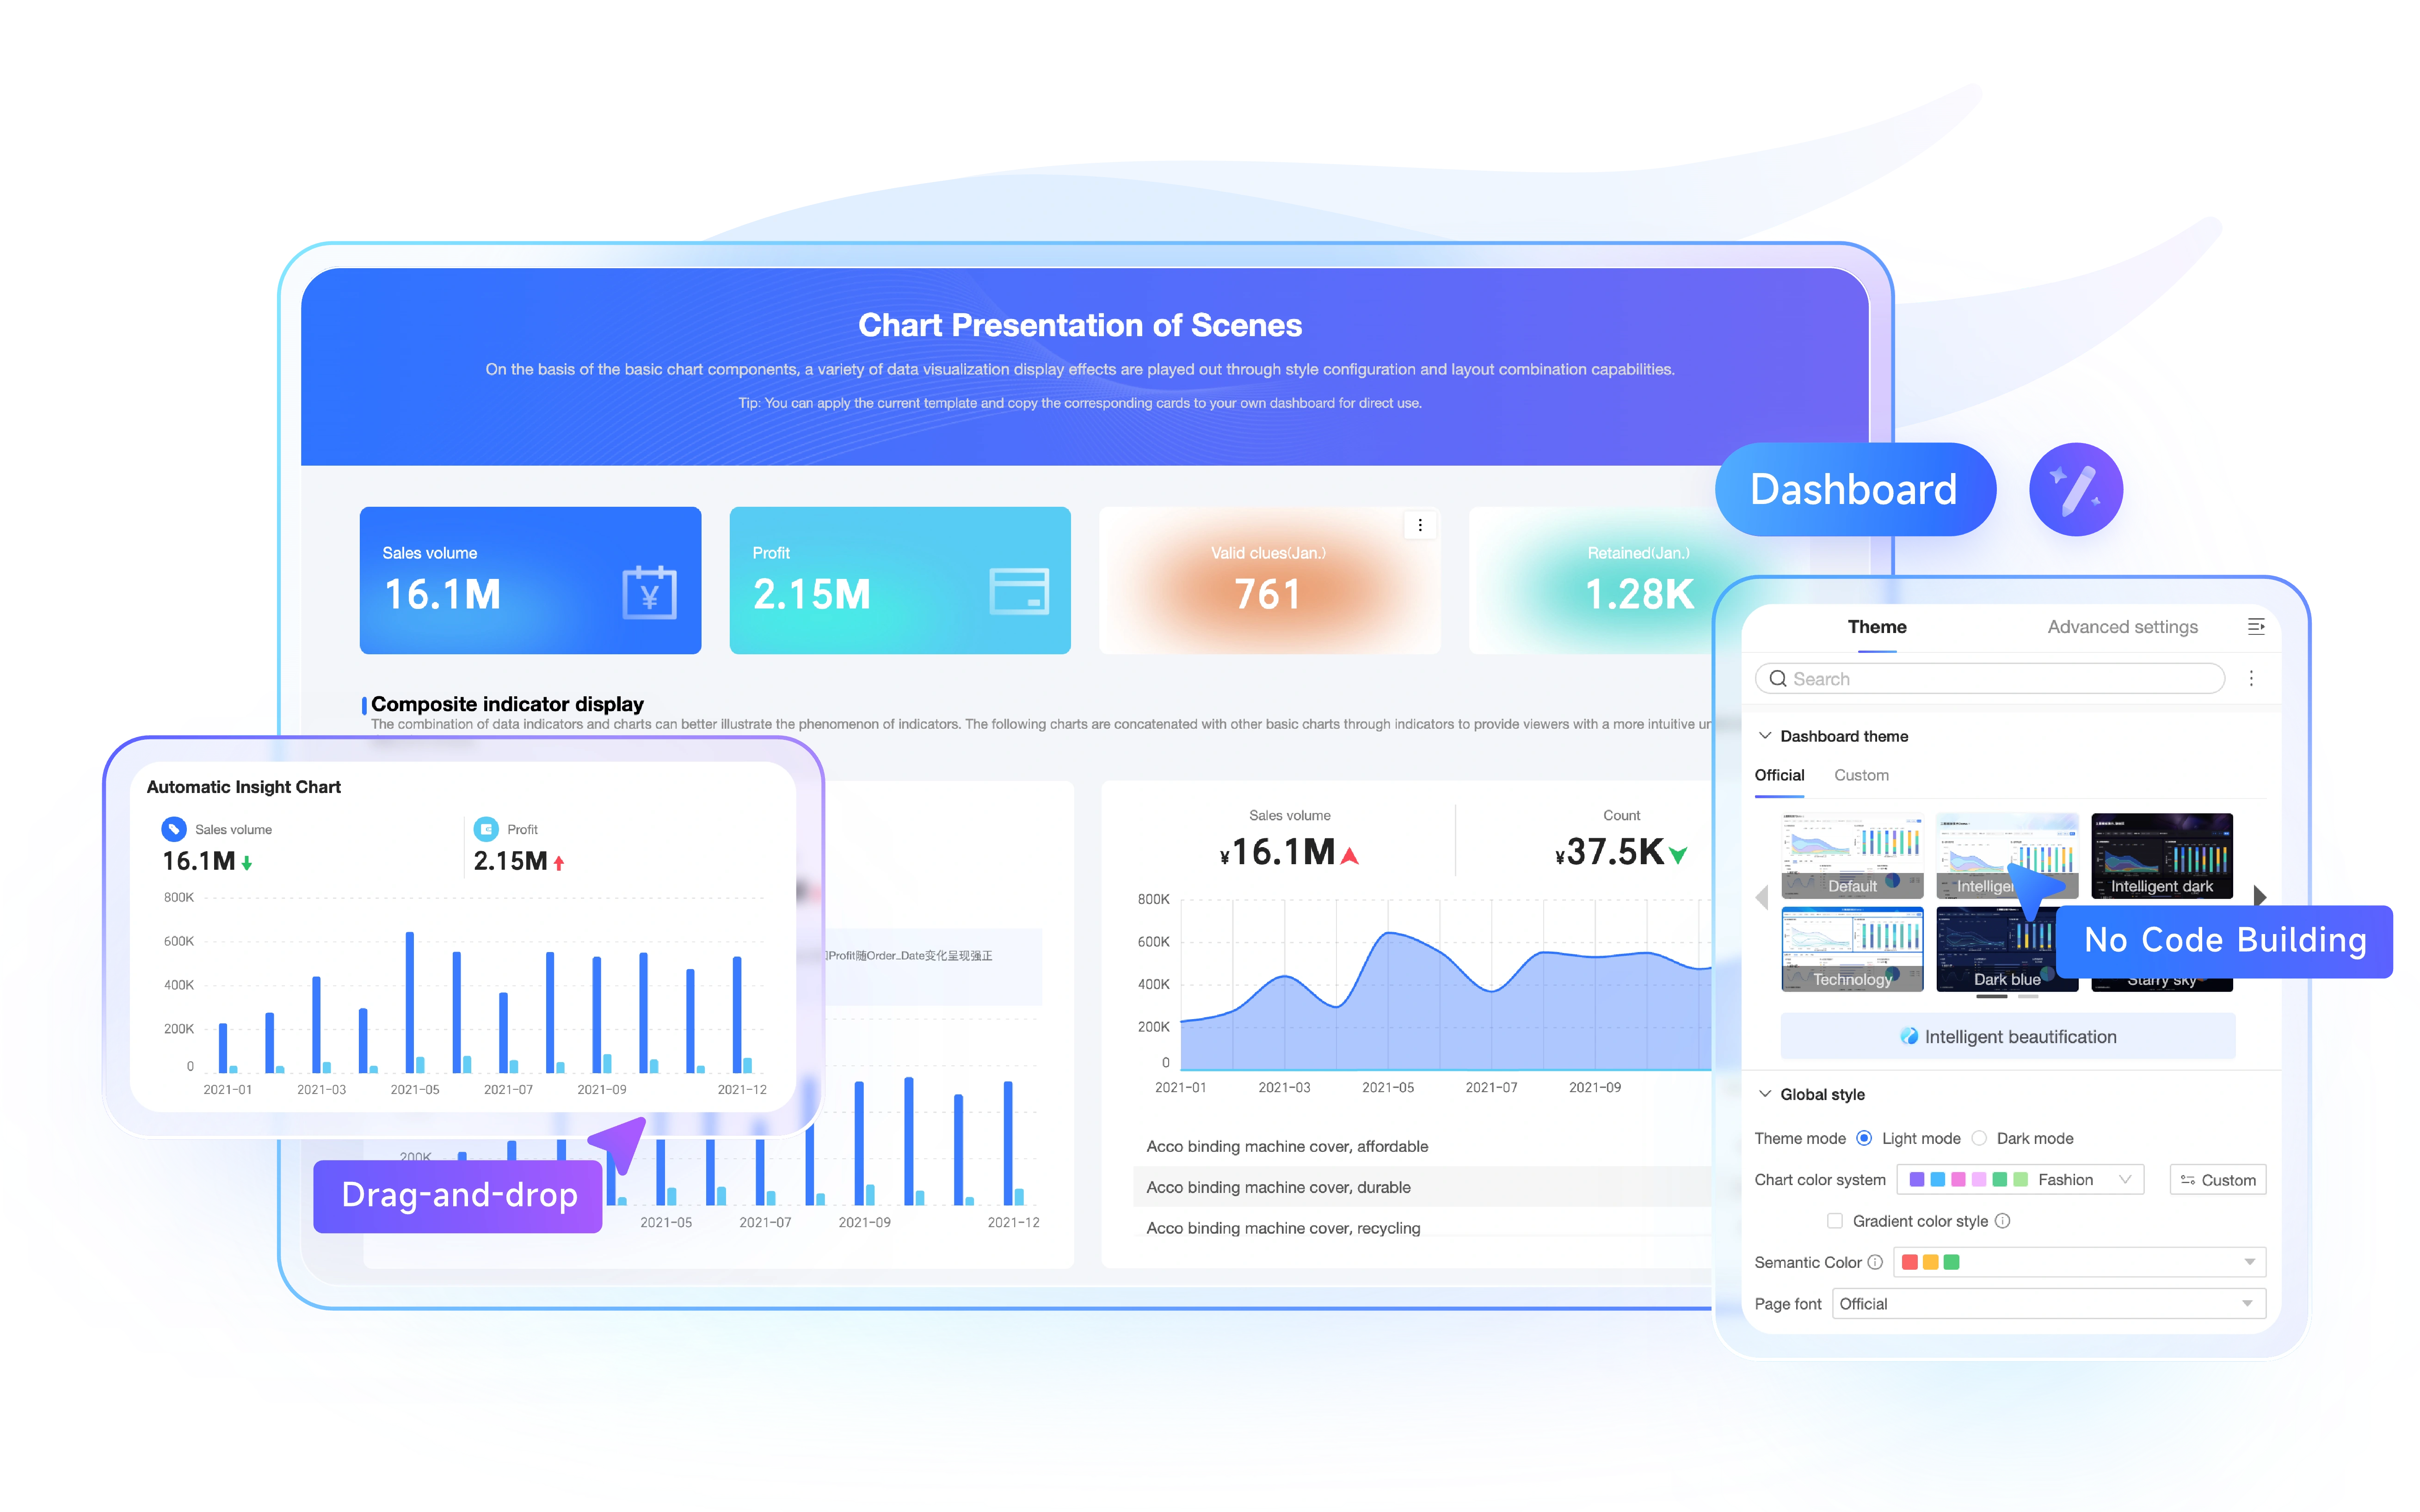
Q Dashboard intelligently generates and beautifies dashboards through natural language, creates and configures visualizations, and refines reports automatically for faster, smarter business analysis.


