
Updates
AI Application Observability released
Learn More >Intelligent O&M Assistant released
Learn More >CloudLens for ECS released
Learn More >One-Stop Observability for Cloud Products
As a one-stop full-stack intelligent observability platform of Alibaba Cloud, Cloud Monitor 2.0 seamlessly integrates Simple Log Service, Cloud Monitor, and Application Real-Time Monitoring Service (ARMS) to collect observability data such as metrics, traces, logs, and events in a unified view. Implements automatic resource association and intelligent diagnosis based on UModel modeling and observability graphs to provide end-to-end observability from user experience to infrastructure.
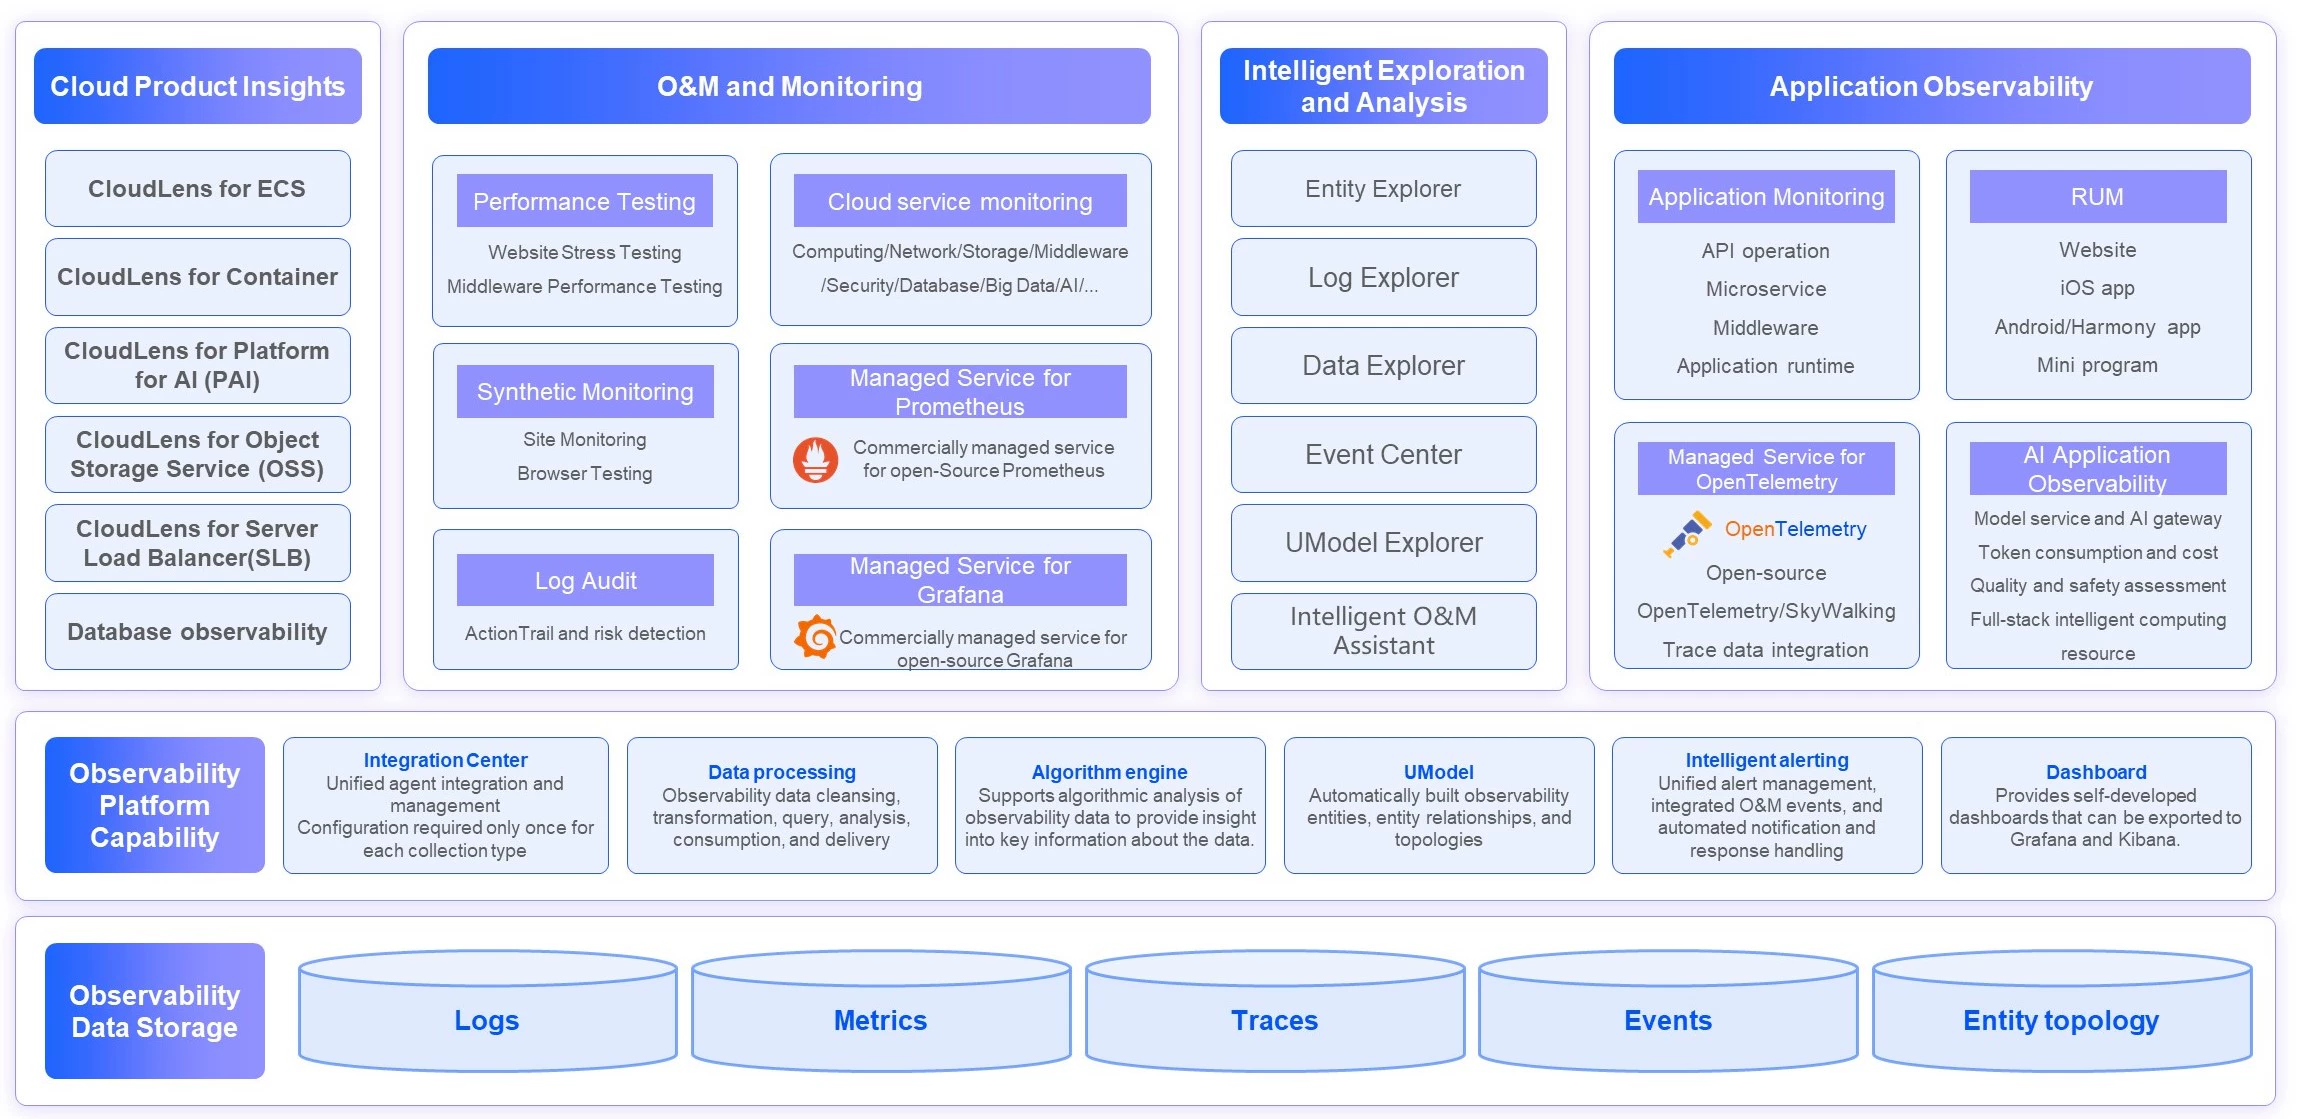
Full-Stack Observability
Integrates logs, metrics, traces, and events in a unified manner to implement full-stack monitoring of cloud products, applications, and infrastructure, reducing O&M complexity.
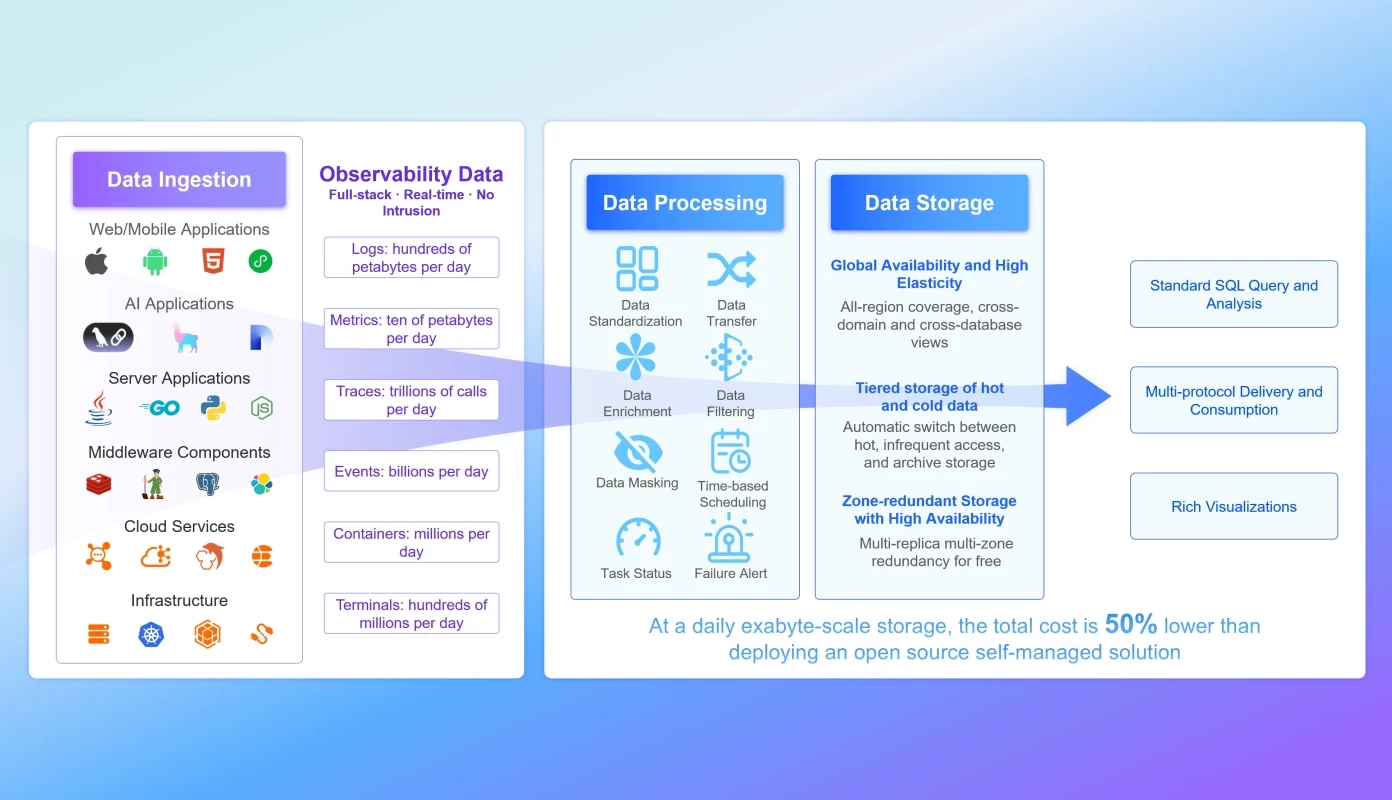
Unified Storage and Analytics
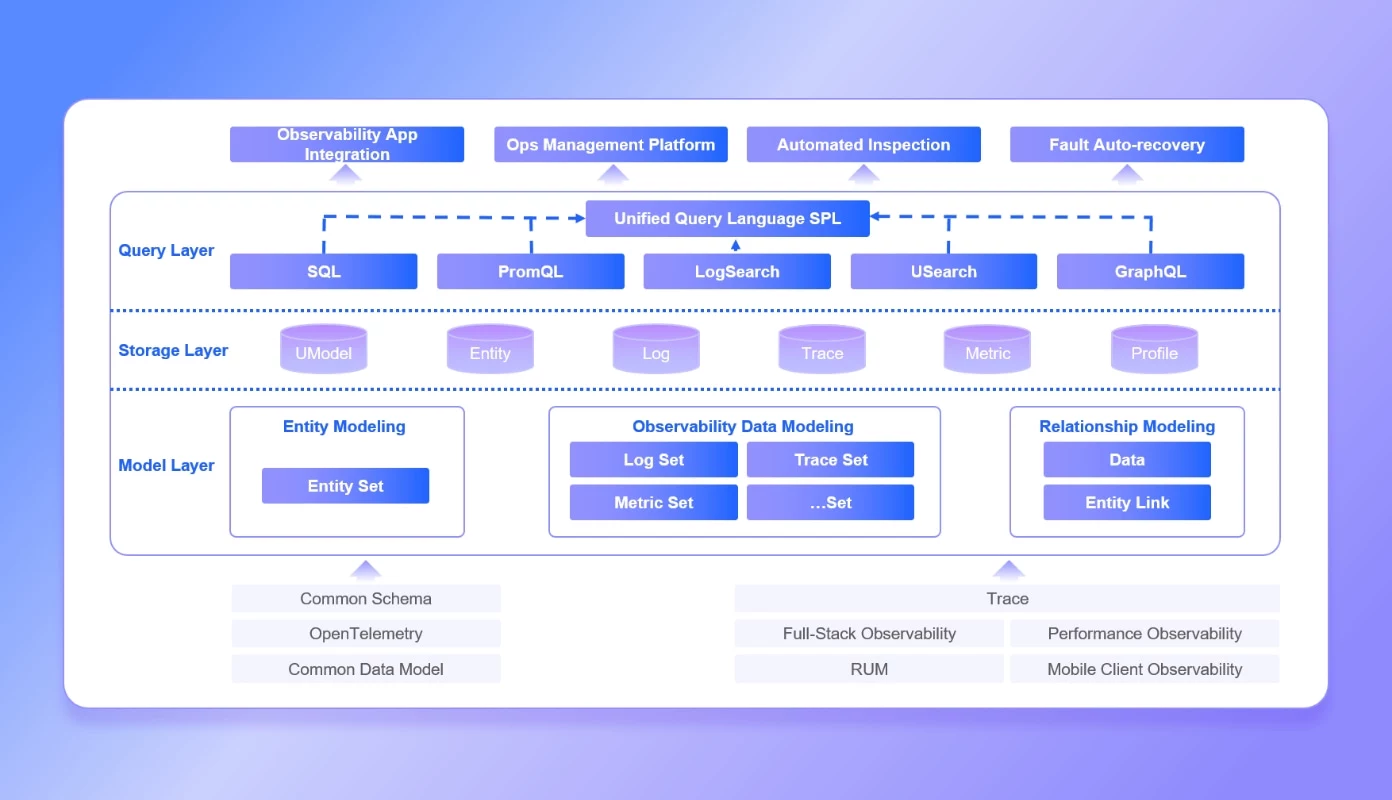
Stores observability data in a unified manner based on the data lake technology and supports the SPL query language. This improves the efficiency of data retrieval and analysis and breaks down data silos.
Automatic Association and Graph Insights
Builds an observability graph based on UModel, automatically discovers resource relationships, implements cross-domain data association, and quickly locates the root cause of issues.
Intelligent O&M
Builds the AIOps platform based on high-quality data and observability graphs, and provides a variety of intelligent O&M capabilities based on LLMs, domain models, and algorithms.
Panorama
Features
O&M and Monitoring
Cloud Product Monitoring
Provides monitoring of core metrics, basic alerts, and resource views of cloud products to meet their O&M requirements.
Network Analysis and Monitoring
Simulates user access, monitors site availability and response speed, and identifies accessibility issues in advance.
Event Center
Manages system events and O&M events of cloud products in a centralized manner, supporting event aggregation, notification, and responses.
Responsiveness
Integrates alerts and events to implement fault response, collaborative processing, and closed-loop management of post-event resumption.
Dashboard
You can customize a visualized dashboard to display key metrics and facilitate O&M decisions.
Managed Service for Grafana
Provides a managed Grafana service that supports flexible dashboard configuration and integration with multiple data sources.
Managed Service for Prometheus
Compatible with the open-source Prometheus and provides managed monitoring and federated cluster management capabilities.
Application Observability
Application Monitoring
Monitors application performance in an end-to-end manner, supporting call tracing, slow call analysis, and dependency topology.
AI Application Observability
Designed for large language model (LLM) applications, it monitors key metrics such as inference latency and token consumption.
Real User Monitoring (RUM)
Collects frontend performance data to monitor page loading, JavaScript errors, and user behavior experience.
CloudLens
CloudLens for Container
Provides insight into the resource usage, workloads, and events of Container Service for Kubernetes (ACK)/Kubernetes clusters to improve container O&M efficiency.
CloudLens for Simple Log Service
Analyzes the performance and usage of Simple Log Service to optimize the efficiency of log collection and query.
CloudLens for Object Storage Service (OSS)
Monitors OSS access, request distribution, and performance metrics to ensure stable storage services.
CloudLens for Redis
Analyzes the hit rate, number of connections, and slow commands of Tair (Redis OSS-compatible) instances and optimize their performance.
CloudLens for ApsaraDB RDS
Provides slow queries, session waits, and performance trend analysis to help optimize databases.
CloudLens for AI Training Service
Monitors AI training resource usage and supports GPU utilization and task scheduling analysis.
CloudLens for ECS
Analyzes the performance of Elastic Compute Service (ECS) instances in multiple dimensions, such as CPU, memory, and network, and provide alerts for exceptions.
CloudLens for AWS
Monitors AWS resources across clouds for unified observability in hybrid cloud environments.
Security and Auditing
Application Security
Provides protection for application runtime based on RASP technology to detect and block attacks.
Log Audit
Audits operations logs and security events in a centralized manner to meet compliance audit and risk tracing requirements.
Cost Manager
Analyzes the cost of cloud resource usage and provides optimization suggestions to reduce unnecessary expenditures.
Data Explorer
Metric Explorer
PromQL and SPL can be used to query time series metrics and analyze performance trends and exceptions in a flexible manner.
Data Explorer
Provides a unified portal to explore various types of observability data such as logs, metrics, and traces.
UModel Explorer
Displays the relationship graph of UModel entities in a visualized manner to understand resource associations and dependencies.
Log Analysis
Retrieves, collects, and analyzes logs to quickly identify issue clues by using SPL.
Performance Testing
Load Test Scenario Construction
APIs can be orchestrated either sequentially or in parallel, with support for defining various parameters. Features such as cookie propagation, rendezvous points (collection points), and think time instructions are provided to facilitate the simulation of complex business scenarios.
Traffic Control
Two traffic control modes are supported: virtual user concurrency and RPS (requests per second) throughput. Traffic can be adjusted automatically or manually on a per-second basis, enabling instantaneous traffic bursts up to tens of millions of requests. Combined with SLA monitoring and scheduled load testing, this enables fully unattended stress testing.
Monitoring and Protection
Throughput and concurrency metrics are available at the API level with second-level granularity. Seamless integration with Alibaba Cloud monitoring products simplifies issue diagnosis and traffic protection.
Traffic Recording
Real-user traffic can be captured directly from browsers or mobile devices in production environments, recording user interaction flows and backend API requests. This recorded traffic can then be analyzed to derive an accurate load-testing model and corresponding test scenarios.
Sub-services
Simple Log Service - Billed by the Data Write Volume
100 GB Written Data Per Month
-
![]() Payment: all upfront
Payment: all upfront
-
![]() Monthly data write volume: 100 GB (all-upfront)
Monthly data write volume: 100 GB (all-upfront)
-
![]()
Duration 1 Year
 Payment: all upfront
ARMS - Application Monitoring - Pay-As-You-Go
Application Monitoring
-
![]() Advantages: 50 GB free quota per month
Advantages: 50 GB free quota per month
-
![]() Features: trace analysis and continuous profiling
Features: trace analysis and continuous profiling
-
![]() Scenarios: application monitoring of Java, Go, and other languages
Scenarios: application monitoring of Java, Go, and other languages
Managed Service for Prometheus
Managed Service for Prometheus
-
![]() Advantages: 50 GB free quota per month
Advantages: 50 GB free quota per month
-
![]() Features: metrics collection and storage, query and analysis
Features: metrics collection and storage, query and analysis
-
![]() Scenarios: container and cloud service monitoring
Scenarios: container and cloud service monitoring
Performance Test Service PTS
Performance Testing
-
![]() Product Advantages: High concurrency, precise traffic control
Product Advantages: High concurrency, precise traffic control
-
![]() Key Features: Orchestrated recording, second-level adjustment
Key Features: Orchestrated recording, second-level adjustment
-
![]() Use Cases: Peak-season stress testing, capacity assessment
Use Cases: Peak-season stress testing, capacity assessment
Benefits
One-Stop Integrated Observability
By deeply integrating the core capabilities of Cloud Monitor, Simple Log Service, and ARMS, Cloud Monitor 2.0 ingests multiple data sources, such as metrics, logs, traces, and events. Without the need to deploy and maintain multiple sets of independent monitoring tools, you can implement comprehensive and end-to-end observability from the underlying infrastructure to the upper-layer applications on a unified platform, significantly reducing the complexity of the observability system and management costs.
Unified Data Modeling
Implements unified modeling and relational association of observed objects based on UModel, breaking down data silos and improving fault location efficiency.

AI-driven Intelligent Diagnosis
Integrates machine learning and LLM capabilities to support exception detection, root cause analysis, and natural language queries.
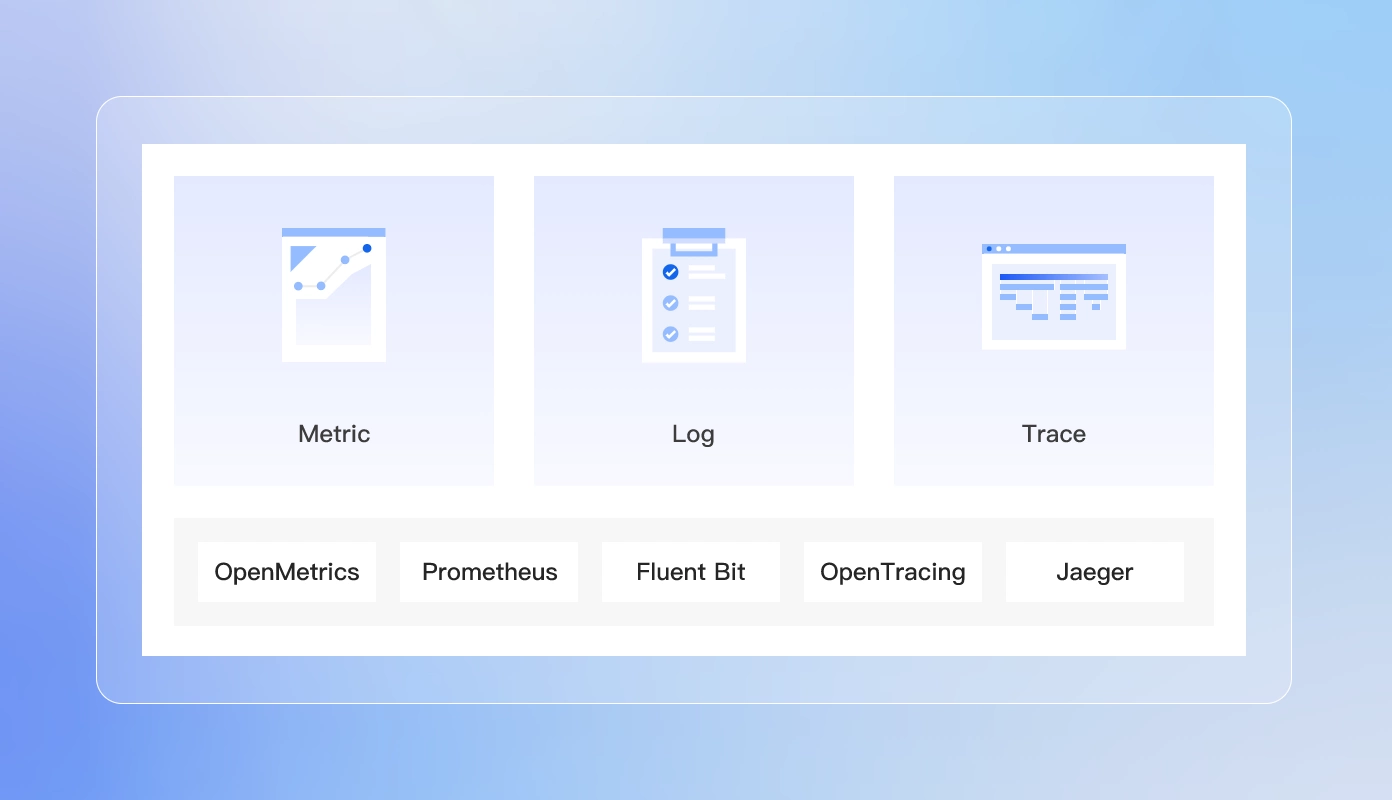
Compatibility with Open-Source Ecosystems
Cloud Monitor 2.0 fully embraces the open-source technology ecosystem and supports mainstream industry standards and tools such as Prometheus, Grafana, OpenTelemetry, and Elasticsearch. Whether it is a cloud-native application or a hybrid cloud environment, Cloud Monitor 2.0 ensures the smooth migration and access of existing monitoring assets and technology stacks to achieve seamless, unified observability.
Documentation and Tools
Documentation
Provides a complete manual that includes product overview, quick start, user guide, use cases, security and compliance, developer reference, service support, and video section.
API
Provides a full range of API queries, documents, and calls to help you quickly use APIs and easily complete secondary development.
SDK
Provides professional online debugging, deployment guides, and rich scenario-based examples for each development language to help you simplify the use of OpenAPI.
FAQs
Guides you through common questions for Cloud Monitor.

