By Wupeng

Articles in the Kubernetes Stability Assurance Handbook Series:
Stability assurance is a complex topic, and it must be effective, iterative, and sustainable to ensure the stability of clusters. A systematic method may be able to solve this problem.
To form a systematic approach, we can sort out the source of the complexity of stability assurance, develop a data model to describe it, and perform a stability assurance on the cluster based on the data model. Then, the stability assurance of the cluster can be digitized and visualized based on the data model, with the data model as the kernel to continuously iterate the understanding, practice, and solidification of experience on stability assurance.
The complexity of stability assurance usually originates from the following dimensions:
To sum up:
Data models can be abstracted for insights and pre-plans through 4 diagrams and 3 lists:
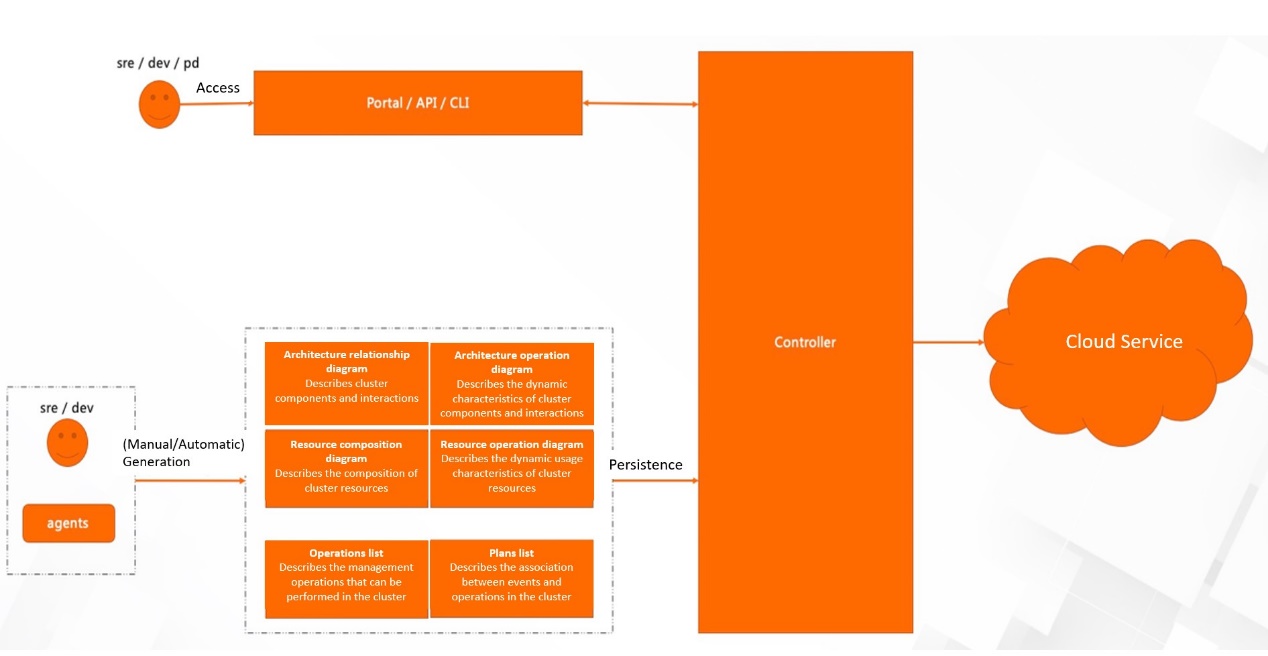
The functions of the cluster are provided by the cluster architecture, and the functional components run based on the cluster resources. As a result, the insight into cluster stability is centered on understanding the characteristics of the cluster architecture and cluster resources.
The cluster architecture can usually be characterized by a diagram, where nodes represent components and edges represent interaction relationships. The cluster architecture can be grasped intuitively through the diagram structure, as shown in the following figure:
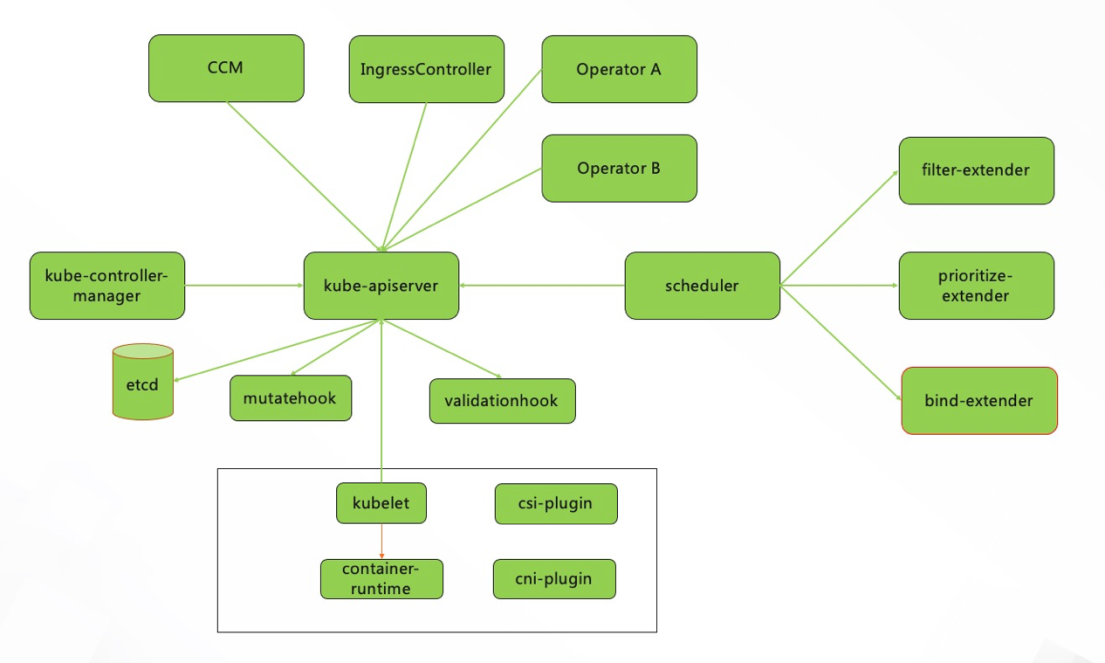
It can be described with the following data structure:
{
    "nodes": [
        {
            "_id": "0ce0e913f6e5516846c654dbd81db6ecab1f684e",
            "name": "kube-apiserver",
            "description": "Within XXX VPC",
            "type": "managed component",
            "dependencies": {}
        },
        {
            "_id": "f0740d8bb67520857061a9b71d4a9e4fc50bfe3d",
            "name": "etcd",
            "description": "Within XXX VPC",
            "type": "managed component | storage",
            "dependencies": {}
        },
        {
            "_id": "05952a825e91cb50a81cbaf23c6941d5c3bb2c89",
            "name": "eni-operator",
            "description": "Manage Enis in the XXX VPC",
            "type": "component",
            "dependencies": {
                "serviceaccount": "enioperator",
                "clusterrole": "enioperator",
                "clusterrolebinding": "enioperator",
                "configmaps": ["eniconfig"],
                "secrets": ["enioperator"]
            }
        },
        {
            "_id": "42699513a7561e89a5f99881d7b05653a1625c51",
            "name": "Network Service",
            "description": "Provides services to manage cloud network resources such as VPCs and vswitches",
            "type": "cloud service"
        }
    ],
    "edges": [
        {
            "_id": "38bce9ca8a0cec6d8586d96298bd63b0523fc946",
            "source": "eni-operator", "target": "kube-apiserver",
            "description": "Manage ENI requests"
        },
        {
            "_id": "93f3c21247165f0be3a969fc80f72bc1a402e9f5",
            "source": "eni-operator", "target": "Network Service",
            "description": "Access Alibaba Cloud ECS OpenAPI to manage network resources such as VPC and VSwitch"
        }
    ]
}During the operation of the cluster, components and interactions can be used to infer the internal state through external observation data, such as log, metrics, and trace. Combined with the cluster architecture diagram, dynamic insight data can be superimposed based on the static architecture to grasp the health status of the cluster more intuitively, as shown in the following figure:
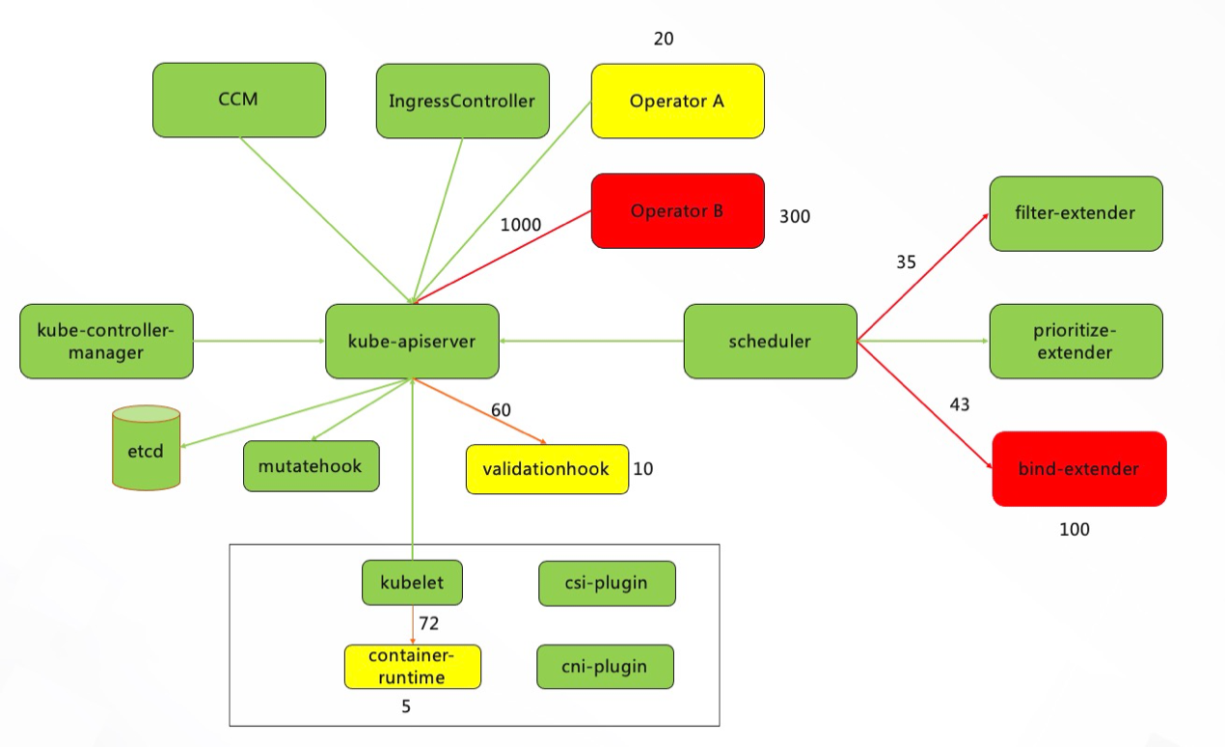
The numbers in this section represent the insight data, which can be "number of exceptions" and "request traffic." In addition to gaining insights through numbers, you can also use "color to represent health status" and "line thickness to represent traffic size."
It can be described with the following data structure:
{
    "nodes": [
      {
            "_id": "ea4538dc0625d06b0dc93579998e04288656050f",
            "name": "mutatehook",
            "deploy": {
                "type": "K8s:Deployment",
                "namespace": "kube-system",
                "replicas": 3
            },
            "insight": [
                {
                    "source": {
                        "vendor": "cloud:aliyun:sls",
                        "log_project": "xxx",
                        "log_store": "mutatehook",
                        "log_url": "https://sls.console.aliyun.com/lognext/project/xxx"
                    },
                    "signal": {
                        "exception": {
                            "fuzzy": "fail OR Fail OR error OR Error"
                        }
                    }
              }
          ]
      }
    ],
    "edges": [
        {
            "_id": "38bce9ca8a0cec6d8586d96298bd63b0523fc946",
            "source": "eni-operator", "target": "kube-apiserver",
            "insight":[
                {
                    "source": {
                        "vendor": "cloud:aliyun:sls",
                        "log_project": "xxx",
                        "log_store": "xxx",
                        "log_url": "https://sls.console.aliyun.com/lognext/project/xxx"
                    },
                    "signal": {
                        "exception": {
                            "unauthorized": "Unauthorized",
                            "throttling": "'Throttling' OR 'throttling'"
                        }
                    }
                }
            ]
        }
    ]
}Resource management is a complex topic. You can also try to use the diagram to represent the composition of resources in a cluster by analyzing the composition of resources in a cluster. Nodes represent the resources, and edges represent the dependencies or bindings of resources.
It can be described with the following data structure:
{
    "kinds": ["vpc", "vswitch", "securitygroup", "ecs", "clb", "rds", "nat", "eip"],
    "tags": {
        "cluster/product": "xxx",
        "cluster/id": "2736f42d4e882ad6825d6364545a3f1cb5136859",
        "cluster/name": "xxx",
        "cluster/env": "staging"
    },
    "nodes": [
        {
            "kind": "vpc",
            "nodes": [
                {
                    "_id": "c505f21871bac7385c1387988cf226310af0831e",
                    "id": "vpc-xxx",
                    "description": "",
                    "ipv4": "xxx",
                    "tags": {
                        "resource/creator": "product",
                        "resource/role": ""
                     },
                     "url": "https://vpc.console.aliyun.com/vpc/xxx"
                }
            ]
        },
        {
            "kind": "ecs",
            "nodes": [
                {
                    "_id": "47c4fe5cc2585a49f07798a0b8b69cda7f8d4a23",
                    "id": "xxx",
                    "az": "xxx",
                    "interfaces": {
                        "primary": {
                            "ip": "xxx",
                            "eni": "xxx",
                            "mac": "xxx"
                        }
                    },
                    "instance-type-family": "xxx",
                    "instance-type": "xxx",
                    "tags": {
                        "resource/creator": "product",
                        "resource/role": "worker",
                        "node/container-runtime": "xxx",
                        "node/user-networking": "xxx",
                        "node/system-networking": "xxx"
                    },
                    "status": "",
                    "condition": "",
                    "url": "https://ecs.console.aliyun.com/#/server/xxx"
                }
            ]
        }
    ],
    "edges": [
        {
            "_id": "a754c748b2723a25c017421dd0969d00df3c000b",
            "source": "vsw-xxx", "target": "vpc-xxx",
            "description": ""
        },
        {
            "_id": "c34b164eba2897cfb2b574a576672d8aa441d709",
            "source": "eip-xxx", "target": "ngw-xxx",
            "description": ""
        }
    ]
}During resource usage, the internal state can also be inferred from external observations of resources and relationships between resources, such as log, metrics, and event. Combined with the resource composition diagram, dynamic insight data can be superimposed based on static resources to grasp the usage status of cluster resources intuitively.
It can be described with the following data structure:
{
    "nodes": [
         {
            "_id": "35103ac62d4ef0a314e2a5128f44c684205bea2f",
            "id": "vpc",
            "insight": [
                {
                    "source": {
                        "vendor": "cloud:aliyun:vpc",
                        "type": "OpenAPI"
                    },
                    "signal": {
                        "vpc/exist": "DescribeVpcs",
                        "vswitch/count": "DescribeVSwitches"
                    }
                },
                {
                    "source": {
                        "vendor": "cloud:aliyun:ecs",
                        "type": "OpenAPI"
                    },
                    "signal": {
                        "ecs/count": "DescribeInstances",
                        "securitygroup/count": "DescribeSecurityGroups"
                    }
                }
            ]
        },
        {
            "_id": "6450e07dc67027f76f29fbfcb841e57200855196",
            "id": "ecs",
            "insight": [
                {
                    "source": {
                        "vendor": "cloud:aliyun:ecs",
                        "type": "OpenAPI"
                    },
                    "signal": {
                        "ecs/exist": "DescribeInstances",
                        "ecs/count": "DescribeInstances",
                        "ecs/usage": "DescribeInstanceMonitorData"
                    }
                },
                {
                    "source": {
                        "vendor": "cloud:aliyun:ecs",
                        "type": "auto"
                    },
                    "signal": {
                        "ecs/state_change": ""
                    }
                }
            ]
        }
    ],
    "edges": [
        {
            "_id": "caa1e395c713f47766ca7bcfc20419c0be0f0803",
            "source": "i-xxx", "target": "sg-xxx",
            "insight": [
                {
                    "source": {
                        "vendor": "cloud:aliyun:ecs",
                        "type": "OpenAPI"
                    },
                    "signal": {
                        "exist": "DescribeInstances"
                    }
                }
            ]
        },
        {
            "_id": "537dc478d95714792b3694674d6164f72b361bb0",
            "source": "eip-xxx", "target": "ngw-xxx",
            "insight": [
                {
                    "source": {
                        "vendor": "cloud:aliyun:vpc",
                        "type": "OpenAPI"
                    },
                    "signal": {
                        "exist": "DescribeEipAddresses"
                    }
                }
            ]
        }
    ]
}Exceptions in clusters are inevitable and need to be handled safely and effectively when an exception occurs.
Exceptions can be characterized by events. Safe and effective operations are operations that have been reviewed and practiced. Exceptions are combined with operations, and operations are triggered by exceptions to form reviewed and practiced plans, which can handle cluster exceptions safely and effectively.
Events that require attention are generated during the operation of a cluster. The Event format can be used based on the CloudEvents community standard: https://github.com/cloudevents/spec/blob/v1.0.1/spec.md
It can be described with the following structure:
{
    "events": [
        {
            "_id": "a1ab5b61857be35a5c5b203dd84b49248161c823",
            "description": "restart workload manually",
            "event": {
                "id": "restart-workload",
                "source": "xxx",
                "specversion": "1.0",
                "type": "com.aliyun.trigger.manual",
                "datacontenttype": "application/json",
                "data": "{\"NAMESPACE\": \"\", \"NAME\": \"\", \"TYPE\": \"\"}"
            }
        }
    ]
}You need to define a list of operations that can be performed in the cluster to reduce the possibility of misoperations and avoid unreviewed and unverified operations when exceptions occur.
It can be described with the following data structure:
{
    "actions": [
        {
            "_id": "47abc5cd9d64018ebf96dc5b2d6a4fbd35a3cb6d",
            "name": "Action Restart Workload",
            "exec": "restart-workload",
            "env": [
                "NAMESPACE",
                "NAME",
                "TYPE"
            ]
        }
    ]
}Events and operations can be associated based on the event list and operation list, and exceptions can be handled in an event-driven manner with plans.
It can be described with the following data structure:
{
    "plans": [
        {
            "_id": "29a091c48d8992991ed69e8694b017a11abe3eec",
            "name": "Plan Restart Workload",
            "description": "重启 workload",
            "event": "a1ab5b61857be35a5c5b203dd84b49248161c823",
            "actions": ["47abc5cd9d64018ebf96dc5b2d6a4fbd35a3cb6d"]
        }
    ]
}Based on the data model of the 4 diagrams and 3 lists above, a kernel of insight and prognosis for cluster stability assurance is formed, which can derive a global visual stability guarantee service.
Such a service has the following key features:
This service is implemented based on two principles:
Let's take the traffic map below as an example:
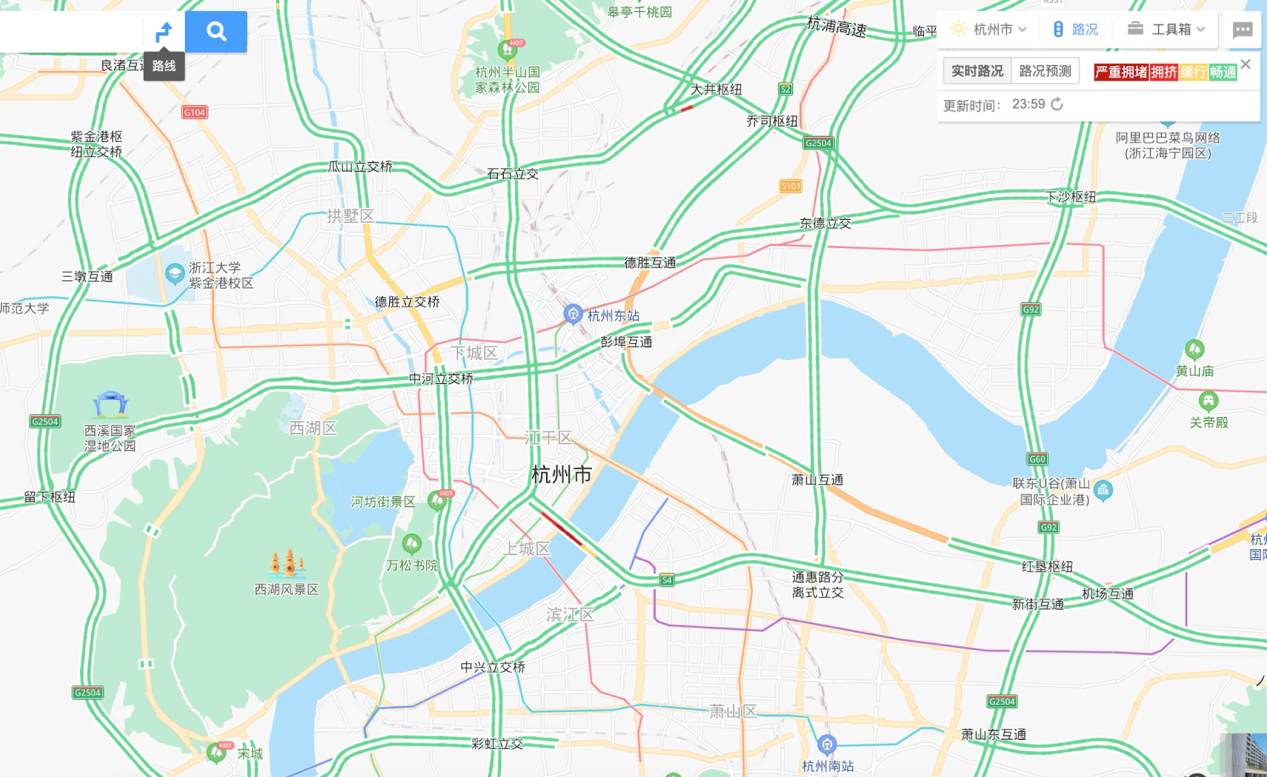
The traffic map allows you to learn about the distribution of roads and key nodes in an area quickly. The conventional red, yellow, and green colors can express the congestion status of roads intuitively. Important events, such as road construction and road closure, will be observed on more abundant traffic maps.
This way, you can understand the traffic and geographic conditions of an area quickly based on visualization.
The underlying data model is the foundation, and the application of visualization makes the value of the data more available.
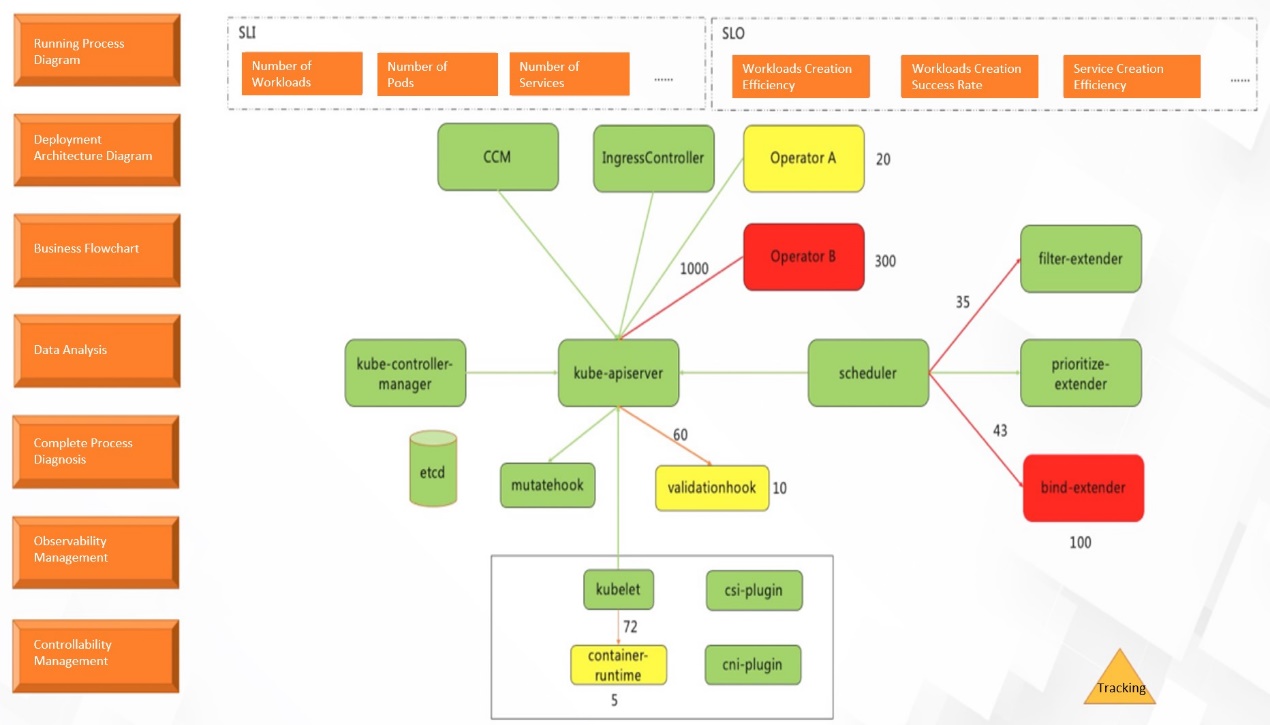
According to the best practices of stability assurance, stability assurance is divided into the following sections:
This section is used to ensure the high frequency of daily stability. You can perceive the occurrence, scope, and impact of exceptions and handle exceptions in a white screen and visualization manner through visualization.
This section describes the deployment architecture of clusters and perceives and processes problems in the deployment dimension.
This section describes capacity management, including node management and capacity planning.
This section accumulates the functional flow chart of the business. On the one hand, it helps the business control the functional complexity. On the other hand, it helps the business understand the current status of the business functions and assists the business iteration jointly. Business-related data analysis can be placed in this section.
This section serves two aspects of data requirements:
1. Business Requirement
2. Stability Assurance Requirements
This section is used to manage observability-related matters, including:
This section is used to manage control-related operations, including:
During Normal System Operation:
In the controllability management section:
During system exception and recovery, in the running process diagram:
The main contents recorded during problem tracking include:
The data model is a medium for iterating, sharing, and applying the best practices for stability assurance. General insights and plans can form standardized services. Personalized insights and plans can be described through a fixed structure and then use the common controller for landing.
The data model is used to form insight and plans stability assurance services. The technical core is:
1. Insight Models
Key Issues
2. Data Models
Key Issues
Based on technical core, it can be iterated around the following competitiveness:
1. Insights
2. Efficiency
3. Advancements
We can characterize insights + pre-plans based on structured descriptions through the Spec specification of seven data models. With this as the core, we will iterate our practices and understanding of stability assurance continuously to accelerate business iteration. It is also possible to provide feedback for the business in the development direction based on the model.
Build a Custom DevOps Platform Based on RocketMQ Prometheus Exporter

634 posts | 55 followers
FollowAlibaba Developer - August 9, 2021
Alibaba Developer - August 9, 2021
Alibaba Developer - August 9, 2021
Alibaba Cloud Community - September 3, 2024
Alibaba Clouder - December 3, 2020
Alibaba Cloud Native Community - July 19, 2022

634 posts | 55 followers
Follow ACK One
Provides a control plane to allow users to manage Kubernetes clusters that run based on different infrastructure resources
Learn More Architecture and Structure Design
Customized infrastructure to ensure high availability, scalability and high-performance
Learn More Function Compute
Alibaba Cloud Function Compute is a fully-managed event-driven compute service. It allows you to focus on writing and uploading code without the need to manage infrastructure such as servers.
Learn More Container Service for Kubernetes
Alibaba Cloud Container Service for Kubernetes is a fully managed cloud container management service that supports native Kubernetes and integrates with other Alibaba Cloud products.
Learn MoreMore Posts by Alibaba Cloud Native Community