By Chen Houdao and Feng Qing

This article will give a brief introduction to the design and implementation of RocketMQ-Exporter. Readers can also refer to the GitHub page for the RocketMQ-Exporter project.
This article mainly includes the following aspects:
1) Introduction to RocketMQ
2) Introduction to Prometheus
3) Implementation of RocketMQ-Exporter
4) RocketMQ-Exporter monitoring and alerting metrics
5) RocketMQ-Exporter examples
RocketMQ is a distributed message and streaming data platform featuring low latency, high performance, high reliability, trillions of capacity, and flexible extensibility. In other words, it consists of a broker server and a client. The client includes a message producer which sends messages to the broker server and a message consumer. Multiple consumers can form a consumer group to subscribe to and pull messages stored on the broker server.
Thanks to its high performance, high reliability, and high timeliness, RocketMQ is more widely used in combination with other protocol components in the message scenarios such as MQTT. However, such powerful message-oriented middleware lacks a monitoring and management platform in actual use.
Currently, Prometheus is the most widely used monitoring solution in the open-source field. Compared to other traditional monitoring systems, Prometheus is easy to manage and can also monitor the internal running status of the service. Apart from the powerful data model and the query language PromQL, it also features efficient data processing, extensibility, easy integration, visualization, openness, and other advantages. With Prometheus, users can quickly build a monitoring platform for RocketMQ.
The following figure shows the basic architecture of Prometheus:
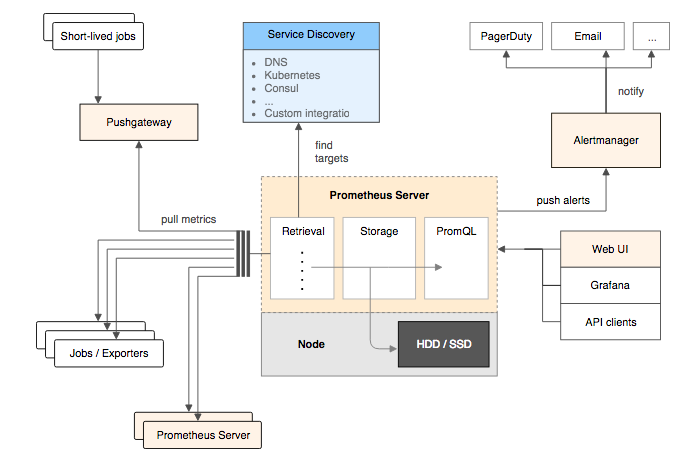
The Prometheus server is the core component of Prometheus. It retrieves, stores, and queries monitoring data. The Prometheus server can manage monitoring targets through static configuration or dynamically using service discovery to obtain data from these monitoring targets. Besides, it needs to store the collected monitoring data. The Prometheus server itself is a time series database that stores the collected monitoring data on a local disk through time series. Lastly, it also provides the custom PromQL language for public use to query and analyze data.
The Exporter exposes the endpoint for monitoring data collection to the Prometheus server through HTTP. The Prometheus server can retrieve the monitoring data to be collected by accessing the endpoint provided by the Exporter. RocketMQ-Exporter is such an Exporter. It first collects data from the RocketMQ clusters and then standardizes the collected data into data that meets the requirements of the Prometheus system with the help of the third-party client library provided by Prometheus. After that, Prometheus only needs to regularly pull data from the Exporter.
Currently, the RocketMQ-Exporter is officially included by Prometheus. You can visit the page here.

The following figure shows the current implementation of the Exporter:
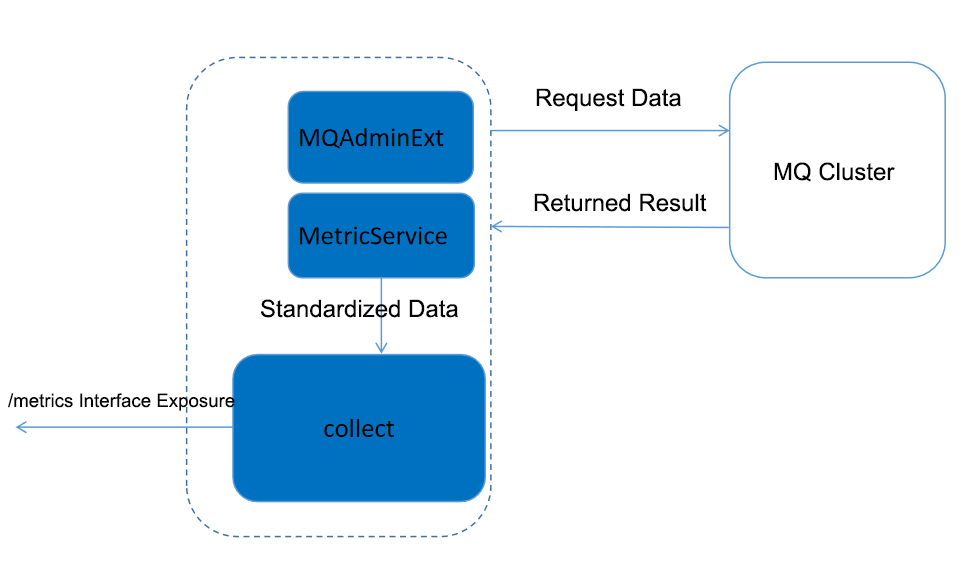
The entire system is implemented based on the Spring Boot framework. MQ provides comprehensive data statistics, so the Exporter only needs to extract the statistics provided by the MQ cluster for processing. Therefore, the basic logic of RocketMQ-Exporter is to start multiple regular tasks to pull data from the MQ clusters periodically, standardize the data, and then expose it to the Prometheus through endpoints. The following three main functional parts are involved:
The RocketMQ-Exporter is mainly used in conjunction with Prometheus for monitoring. Let's take a look at the monitoring and alerting metrics defined in Exporter.
| Monitoring Metrics | Description |
|---|---|
| rocketmq_broker_tps | The number of messages produced by the broker per second. |
| rocketmq_broker_qps | The number of messages consumed by the broker per second. |
| rocketmq_producer_tps | The number of messages produced by a topic per second. |
| rocketmq_producer_put_size | The size of messages produced by a topic per second (in bytes). |
| rocketmq_producer_offset | The progress of message production by a topic. |
| rocketmq_consumer_tps | The number of messages consumed by a consumer group per second. |
| rocketmq_consumer_get_size | The size of messages consumed by a consumer group per second (in bytes). |
| rocketmq_consumer_offset | The progress of message consumption by a consumer group. |
| Cost | The consumption latency of a consumer group. |
| rocketmq_message_accumulation(rocketmq_producer_offset-rocketmq_consumer_offset) | The amount of accumulated messages (production progress - consumption progress) |
rocketmq_message_accumulation is an aggregation metric that is aggregated based on other reported metrics.
| Alerting Metrics | Description |
|---|---|
| sum(rocketmq_producer_tps) by (cluster) >= 10 | The cluster sending tps is too high. |
| sum(rocketmq_producer_tps) by (cluster) < 1 | The cluster sending tps is too low |
| sum(rocketmq_consumer_tps) by (cluster) >= 10 | The cluster consumption tps is too high. |
| sum(rocketmq_consumer_tps) by (cluster) < 1 | The cluster consumption tps is too low. |
| Instances> 1000 | Cluster Consumption latency alert. |
| rocketmq_message_accumulation > value | Consumption accumulation alert. |
The consumer accumulation alert is also an aggregation metric generated based on the aggregation metric of consumption accumulation. The threshold value varies for different consumers and is currently decided by the number of messages produced by the producer in the past five minutes. Users can also set the threshold value as needed. The value set for the alerting metric is only a symbolic threshold value. Users can set it as required. Here, the focus is on the consumer accumulation alerting metric. There is no such powerful PromQL language as possessed by Prometheus in the previous monitoring systems, which means that an alert must be set for each consumer when dealing with the consumer alerting problem. This requires the RocketMQ system maintenance personnel to add alerts for each consumer, or the alerts are added automatically when the system background detects newly created consumers. In Prometheus, this is achieved by using the following statement:
(sum(rocketmq_producer_offset) by (topic) - on(topic)  group_right  sum(rocketmq_consumer_offset) by (group,topic))
- ignoring(group) group_left sum (avg_over_time(rocketmq_producer_tps[5m])) by (topic)*5*60 > 0
With the PromQL statement, users can not only create a consumption accumulation alert for any consumer but can also take a threshold value related to the sending speed of the producer as the consumption accumulation threshold value. This significantly increases the accuracy of the consumption accumulation alert.
To verify the Spring Boot client of RocketMQ, make sure that the RocketMQ service is correctly downloaded and enabled. You may refer to the quick start on the RocketMQ official website. Ensure that the NameServer and the broker are started correctly.
Current users need to download the Git source code for compiling:
git clone https://github.com/apache/rocketmq-exporter
cd rocketmq-exporter
mvn clean installRocketMQ-Exporter has the following running options:
| Parameter | Default Value | Description |
|---|---|---|
| rocketmq.config.namesrvAddr | 127.0.0.1:9876 | The nameSrv address of the MQ cluster |
| rocketmq.config.webTelemetryPath | /metrics | Metrics collection path |
| server.port | 5557 | HTTP server port |
These parameters can be modified in the configuration file after downloading the code, or through the command line.
The compiled jar package is called rocketmq-exporter-0.0.1-SNAPSHOT.jar which can be run as follows:
java -jar rocketmq-exporter-0.0.1-SNAPSHOT.jar [--rocketmq.config.namesrvAddr="127.0.0.1:9876" ...]First, go to the official download address to download the Prometheus installation package. Let's consider the Linux system installation as an example. The installation package selected is prometheus-2.7.0-rc.1.linux-amd64.tar.gz. We can enable the Prometheus process after the following procedure:
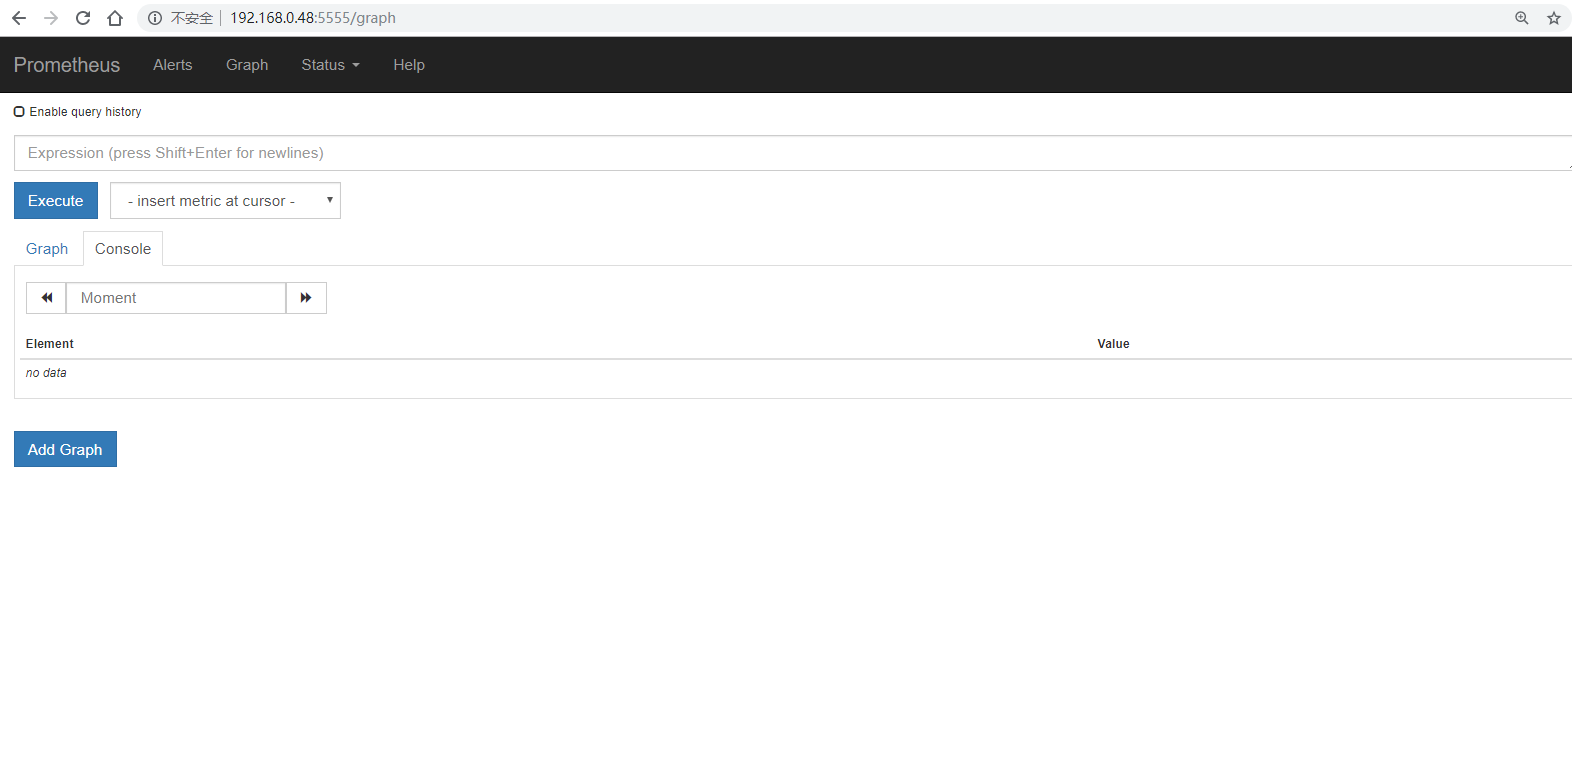
tar -xzf prometheus-2.7.0-rc.1.linux-amd64.tar.gzcd prometheus-2.7.0-rc.1.linux-amd64/./prometheus --config.file=prometheus.yml --web.listen-address=:5555Port 9090 is the Prometheus listening port by default. To avoid conflict with the listening ports of other processes in the system, the listening port number is reset to 5555 in the startup parameters. Access http://<server IP address>:5555 through a browser to verify whether Prometheus is installed successfully. The interface is as follows:
With the RocketMQ-Exporter process started, the Prometheus can be used to retrieve the data of the RocketMQ-Exporter, which then only requires the modification of the configuration file for starting Prometheus.
The overall configuration file is as follows:
# my global config
global:
   scrape_interval:     15s # Set the scrape interval to every 15 seconds. Default is every 1 minute.
   evaluation_interval: 15s # Evaluate rules every 15 seconds. The default is every 1 minute.
   # scrape_timeout is set to the global default (10s).


 # Load rules once and periodically evaluate them according to the global 'evaluation_interval'.
 rule_files:
   # - "first_rules.yml"
   # - "second_rules.yml"


 scrape_configs:
   - job_name: 'prometheus'
     static_configs:
     - targets: ['localhost:5555']


   - job_name: 'exporter'
     static_configs:
     - targets: ['localhost:5557']
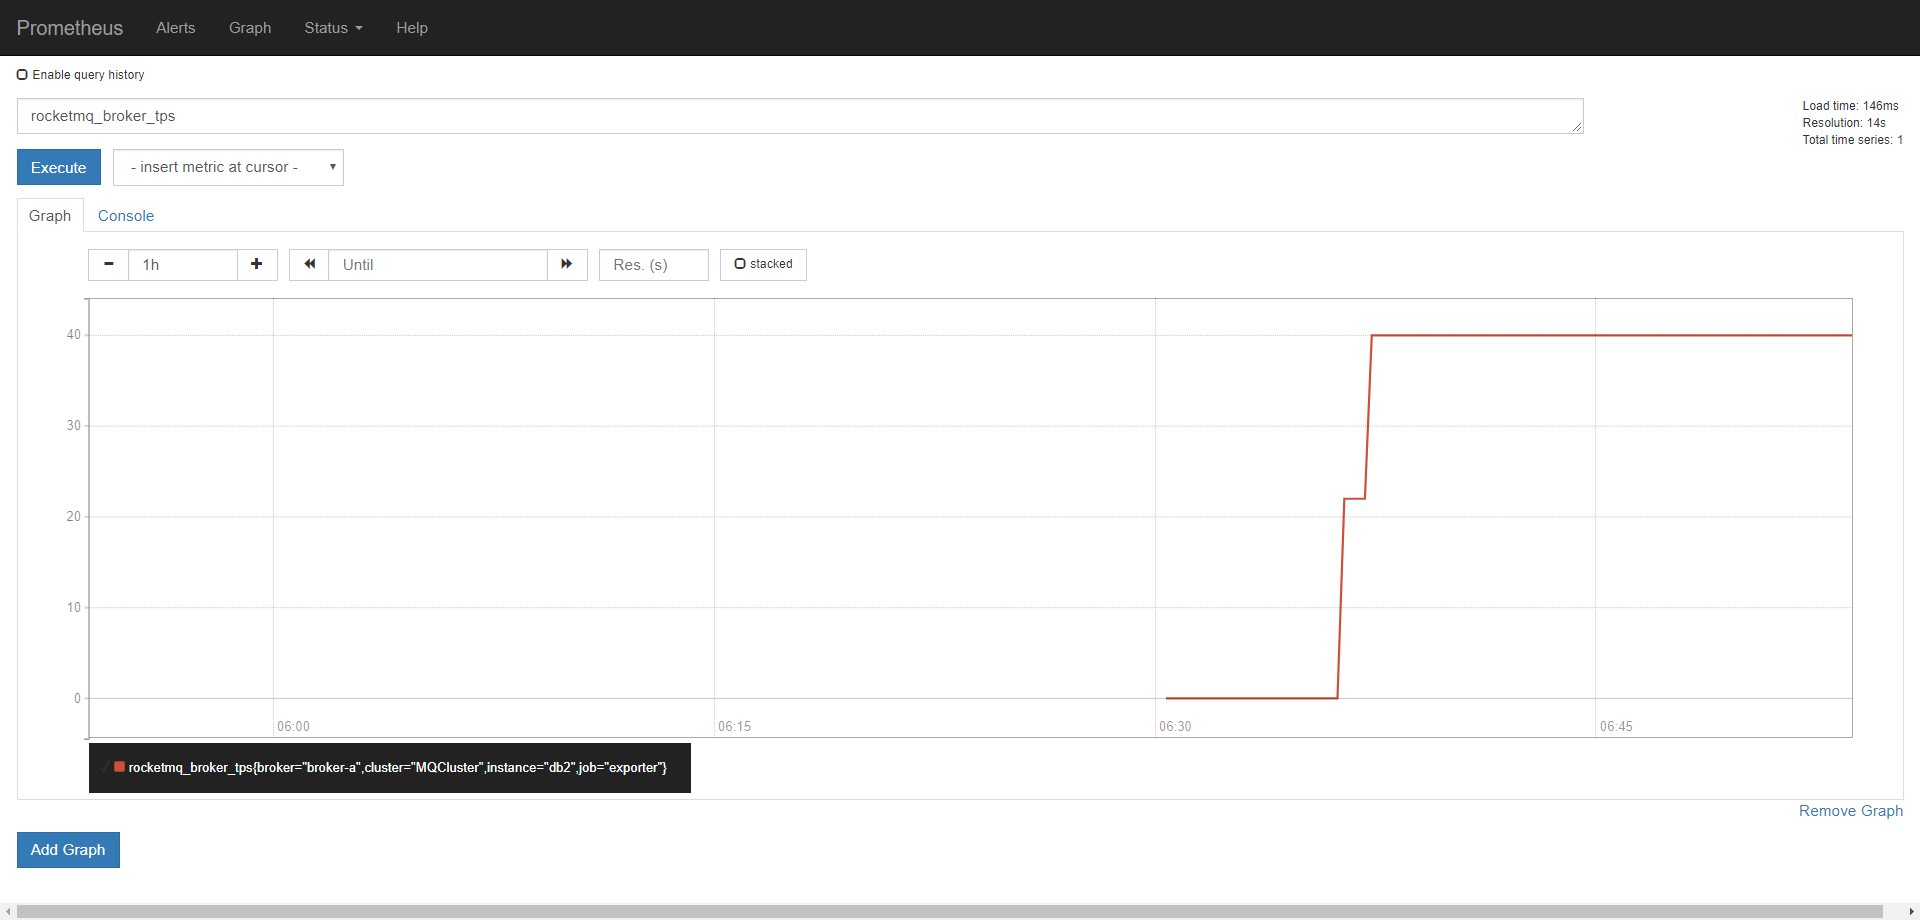
Restart the service after modifying the configuration file. The metrics reported by RocketMQ-Exporter can be queried on the Prometheus interface after restart. For example, query the rocketmq_broker_tps metric, and the result is as follows:
When RocketMQ-Exporter metrics are displayed in Prometheus, users can configure RocketMQ alerting metrics in Prometheus. Add the following alerting configuration items to the Prometheus configuration file. *.rules which indicates that multiple files with rules as the suffix can be matched.
rule_files:
  # - "first_rules.yml"
  # - "second_rules.yml"
  - /home/prometheus/prometheus-2.7.0-rc.1.linux-amd64/rules/*.rules
The current alerting configuration file is warn.rules, whose contents are as follows:
The threshold value serves only as an example. Users need to set the threshold value according to the actual use.
###
# Sample prometheus rules/alerts for rocketmq.
#
###
# Galera Alerts

groups:
- name: GaleraAlerts
  rules:
  - alert: RocketMQClusterProduceHigh
    expr: sum(rocketmq_producer_tps) by (cluster) >= 10
    for: 3m
    labels:
      severity: warning
    annotations:
      description: '{{$labels.cluster}} Sending tps too high.'
      summary: cluster send tps too high
  - alert: RocketMQClusterProduceLow
    expr: sum(rocketmq_producer_tps) by (cluster) < 1
    for: 3m
    labels:
      severity: warning
    annotations:
      description: '{{$labels.cluster}} Sending tps too low.'
      summary: cluster send tps too low
  - alert: RocketMQClusterConsumeHigh
    expr: sum(rocketmq_consumer_tps) by (cluster) >= 10
    for: 3m
    labels:
      severity: warning
    annotations:
      description: '{{$labels.cluster}} consuming tps too high.'
      summary: cluster consume tps too high
  - alert: RocketMQClusterConsumeLow
    expr: sum(rocketmq_consumer_tps) by (cluster) < 1
    for: 3m
    labels:
      severity: warning
    annotations:
      description: '{{$labels.cluster}} consuming tps too low.'
      summary: cluster consume tps too low
  - alert: ConsumerFallingBehind
    expr: (sum(rocketmq_producer_offset) by (topic) - on(topic)  group_right  sum(rocketmq_consumer_offset) by (group,topic)) - ignoring(group) group_left sum (avg_over_time(rocketmq_producer_tps[5m])) by (topic)*5*60 > 0
    for: 3m
    labels:
      severity: warning
    annotations:
      description: 'consumer {{$labels.group}} on {{$labels.topic}} lag behind
        and is falling behind (behind value {{$value}}).'
      summary: consumer lag behind
  - alert: GroupGetLatencyByStoretime
    expr: rocketmq_group_get_latency_by_storetime > 1000
    for: 3m
    labels:
      severity: warning
    annotations:
      description: 'consumer {{$labels.group}} on {{$labels.broker}}, {{$labels.topic}} consume time lag behind message store time
        and (behind value is {{$value}}).'
      summary: message consumes time lag behind message store time too much
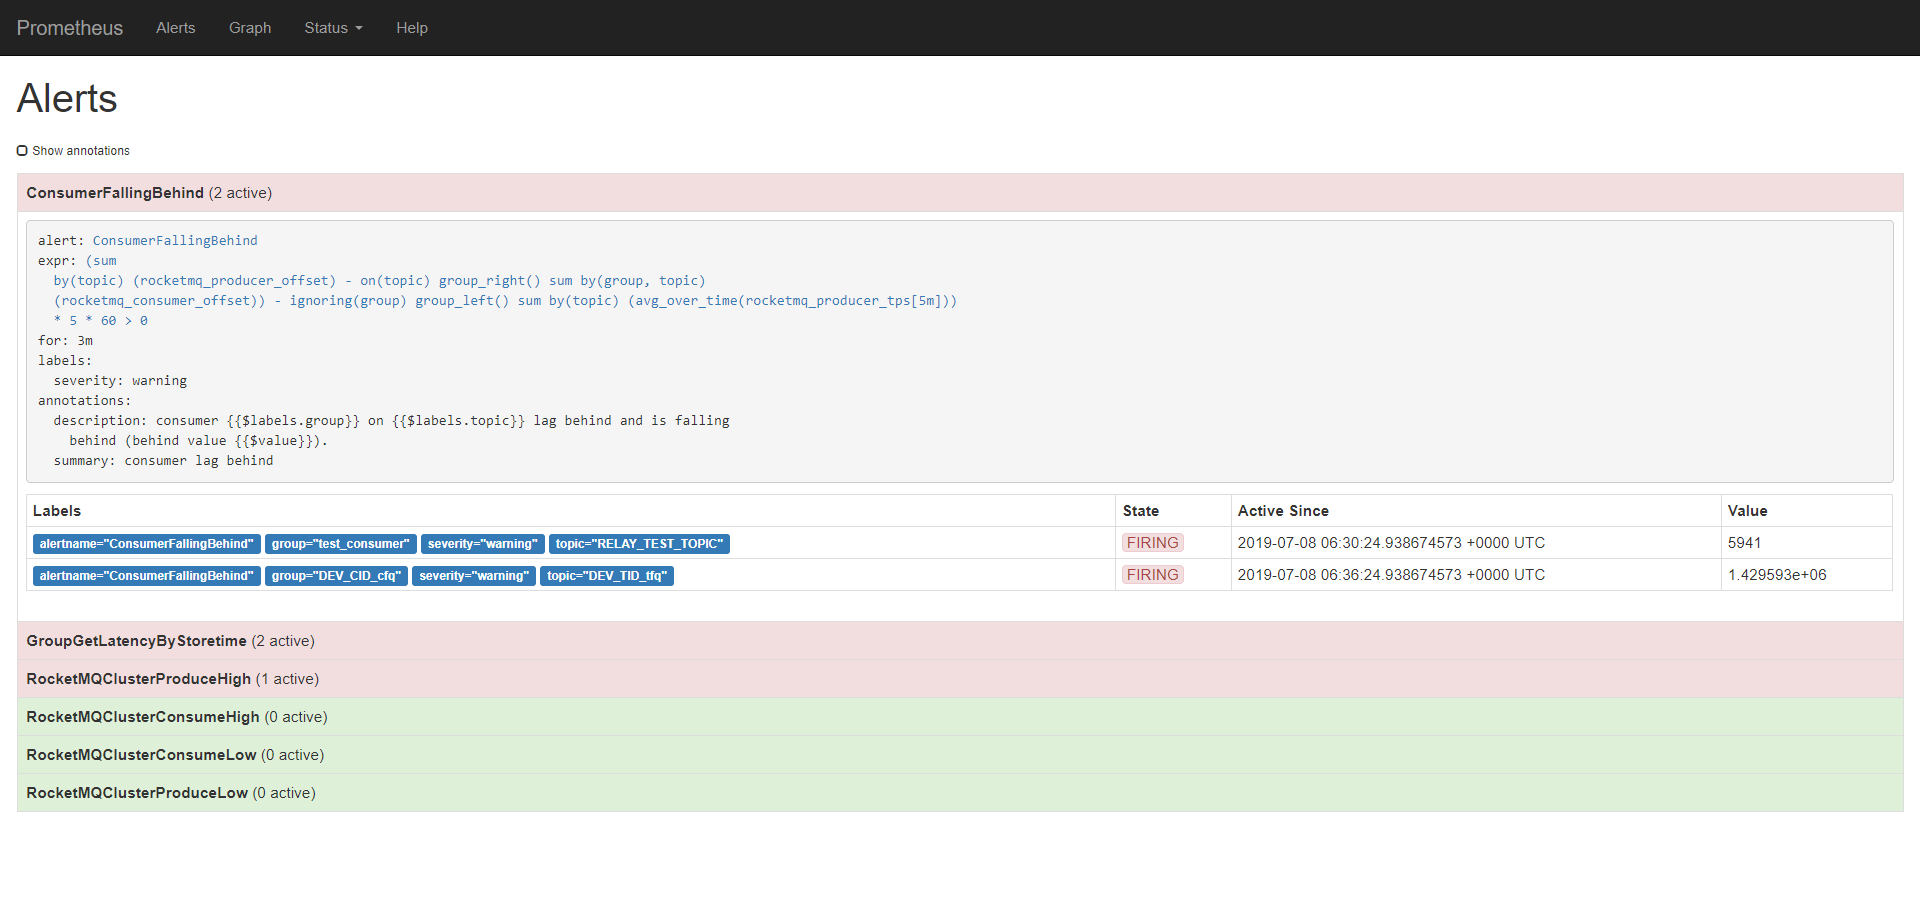
Finally, the alerting results can be seen in Prometheus. Red indicates an alerting status and green indicates a normal status.
The Prometheus metric display platform is not as good as the popular Grafana display platform. Users can turn to Grafana for a better display of the RocketMQ metrics obtained by Prometheus.
First, go to the official website to download Grafana. Consider the following example of the binary file installation.
wget https://dl.grafana.com/oss/release/grafana-6.2.5.linux-amd64.tar.gz
tar -zxvf grafana-6.2.5.linux-amd64.tar.gz
cd grafana-5.4.3/
Similarly, to prevent the conflict with the ports used by other processes, users can modify the listening port of the defaults.ini file under the conf directory, changing the listening port of Grafana to 55555, and then start it with the following command:
./bin/grafana-server webAccess http://<server IP address>:55555 through a browser to verify whether Grafana is installed successfully. The default username and password are admin and admin. Users are required to change the default password when logging on to the system for the first time. The interface is as follows:
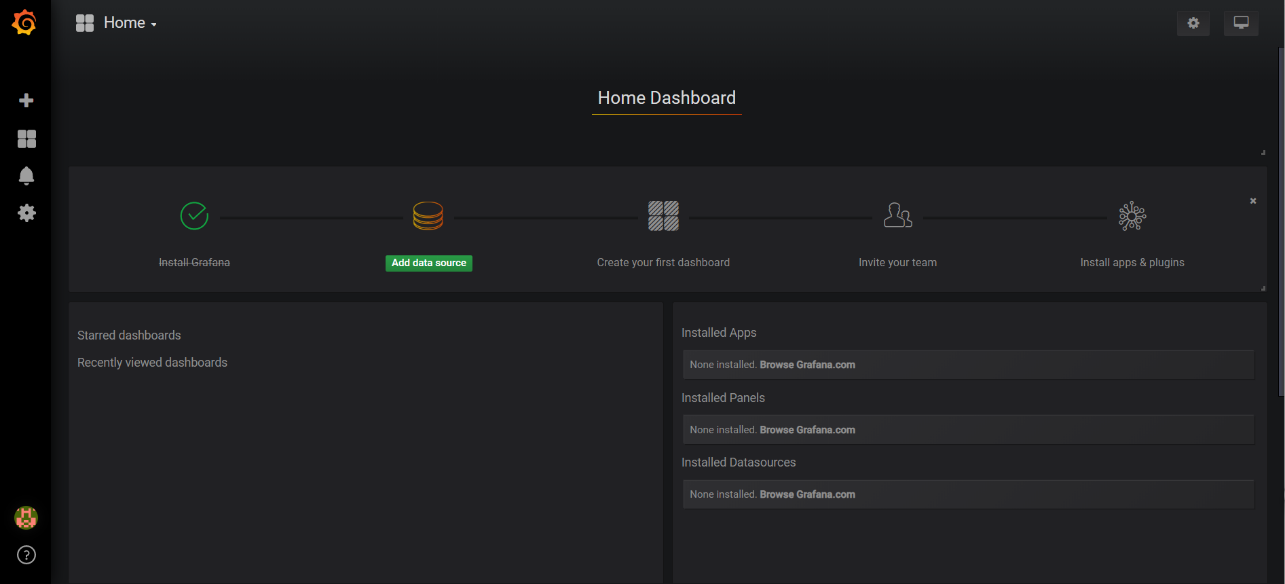
Click the Data Source button and to select a data source.
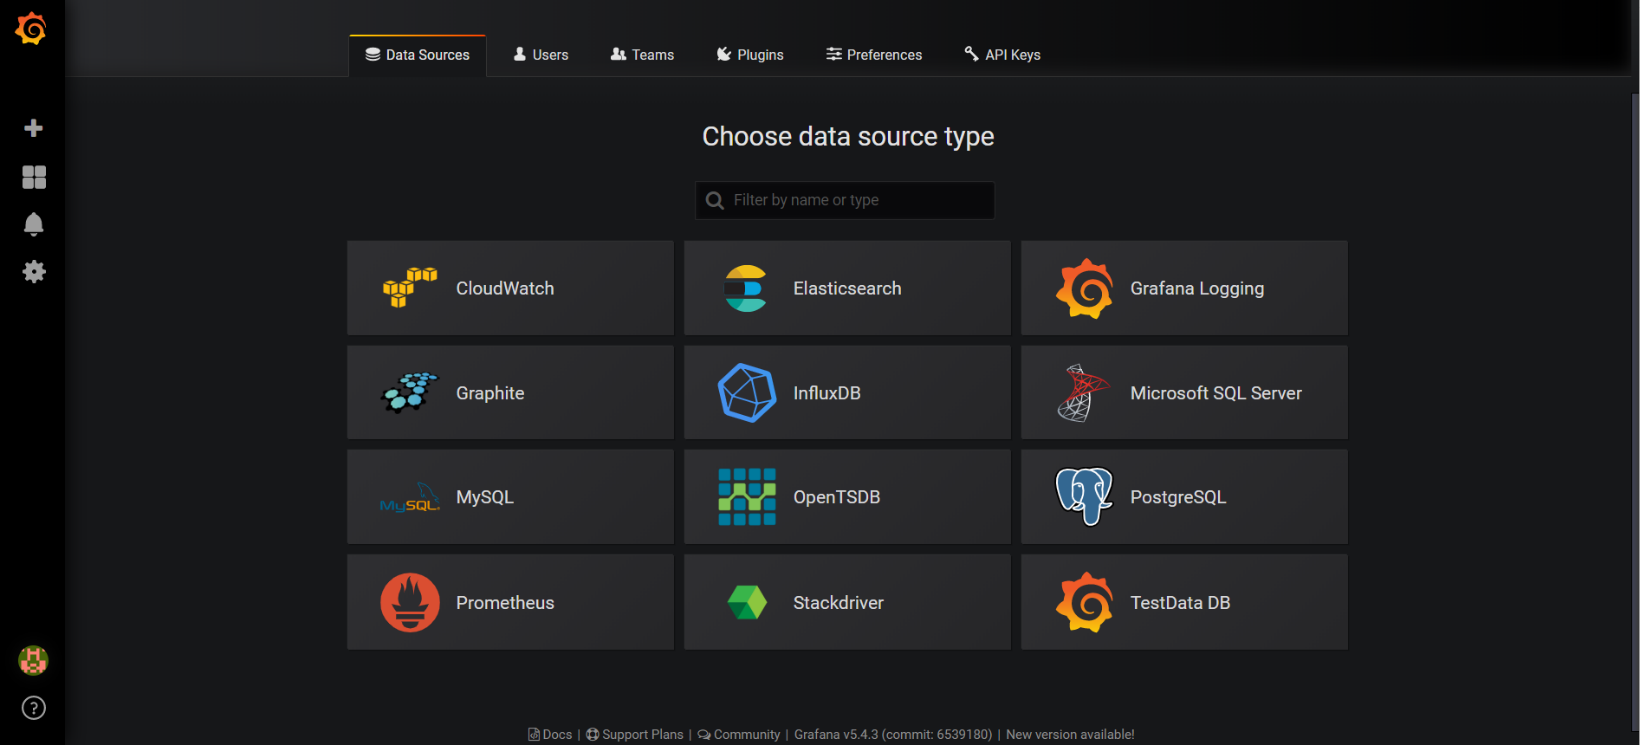
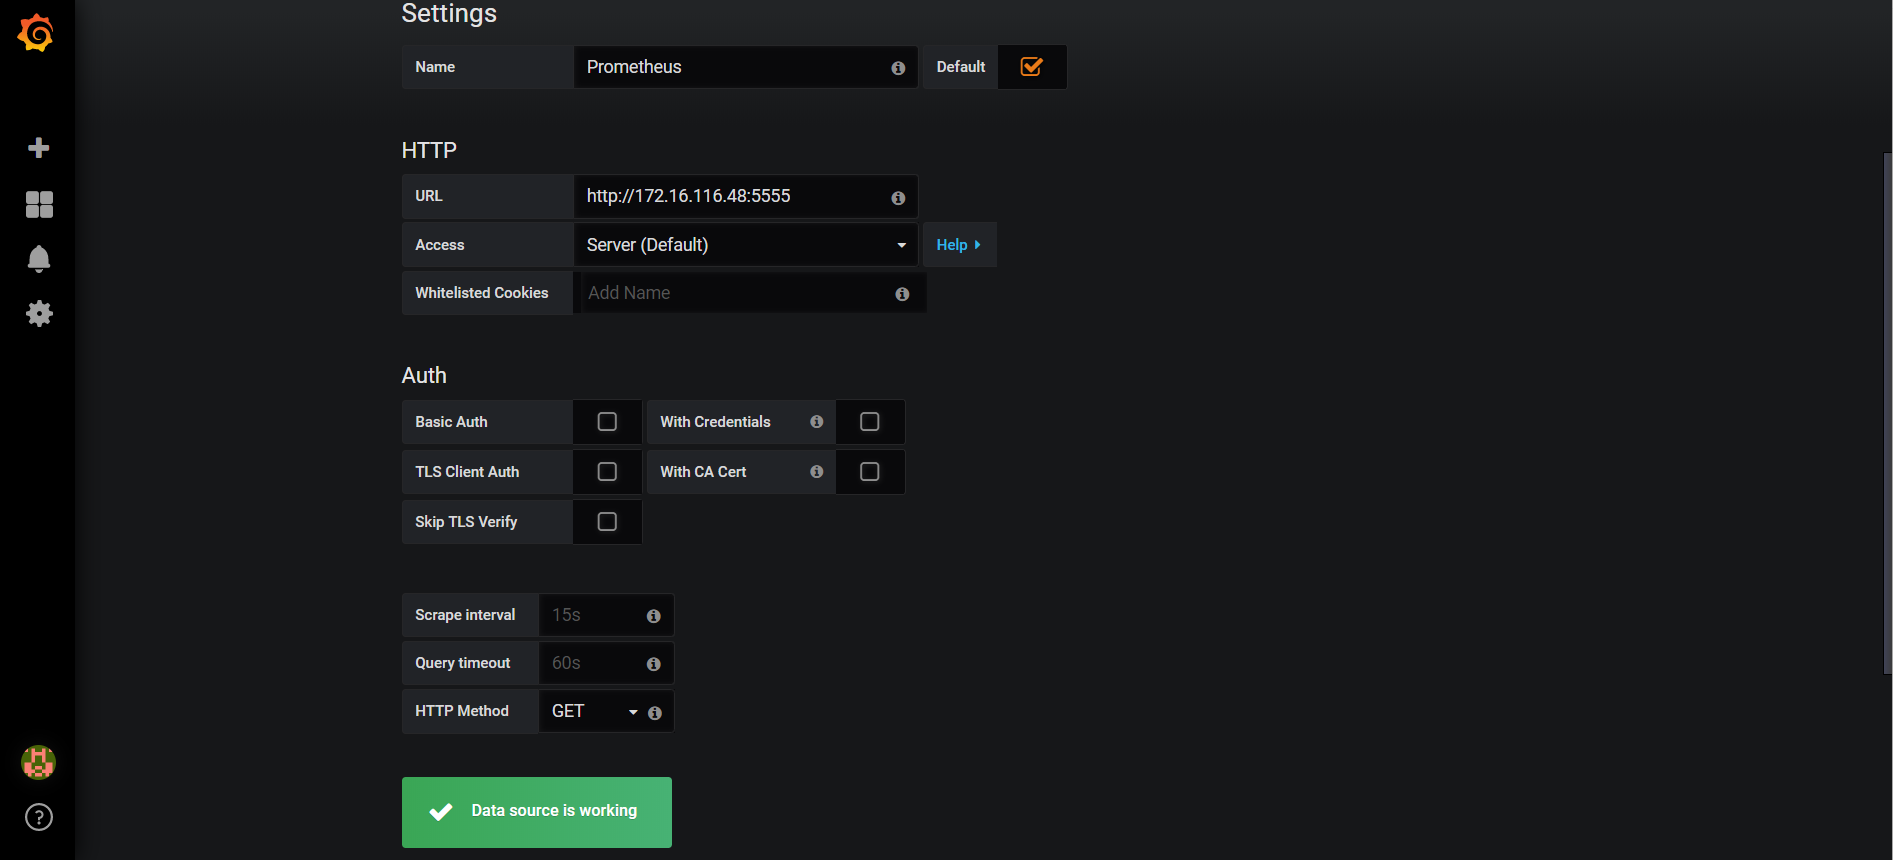
Select Prometheus as the data source and set the data source address to the address of Prometheus enabled in the previous step.
Back to the homepage, users will be required to create a new dashboard.
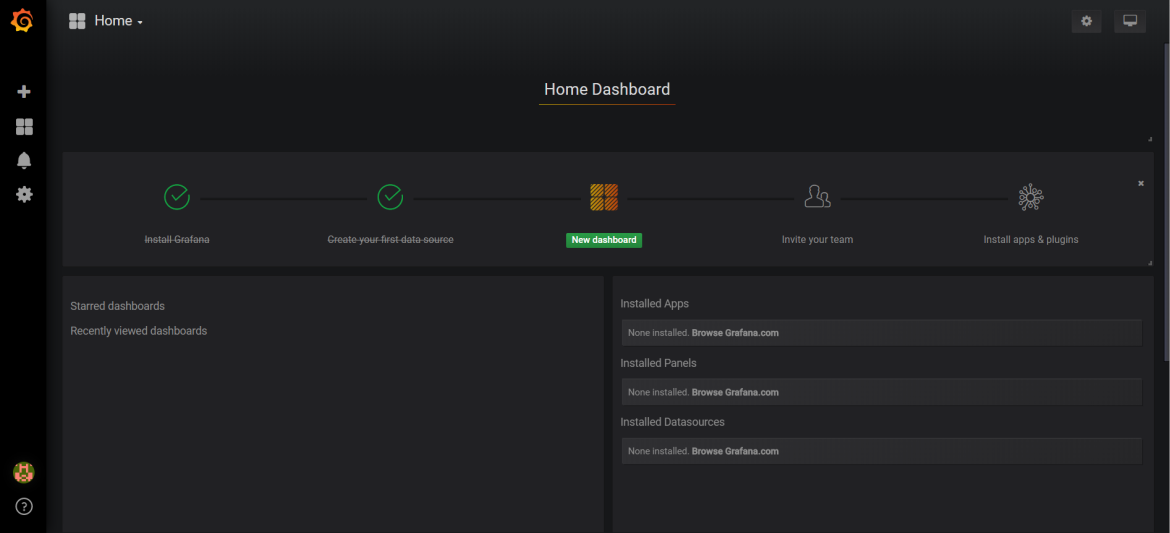
Click Add to create a new dashboard. Users can create a dashboard either manually or by importing a configuration file. Currently, the RocketMQ dashboard configuration file has been uploaded to Grafana official website. Here, the new dashboard is created by importing the configuration file.
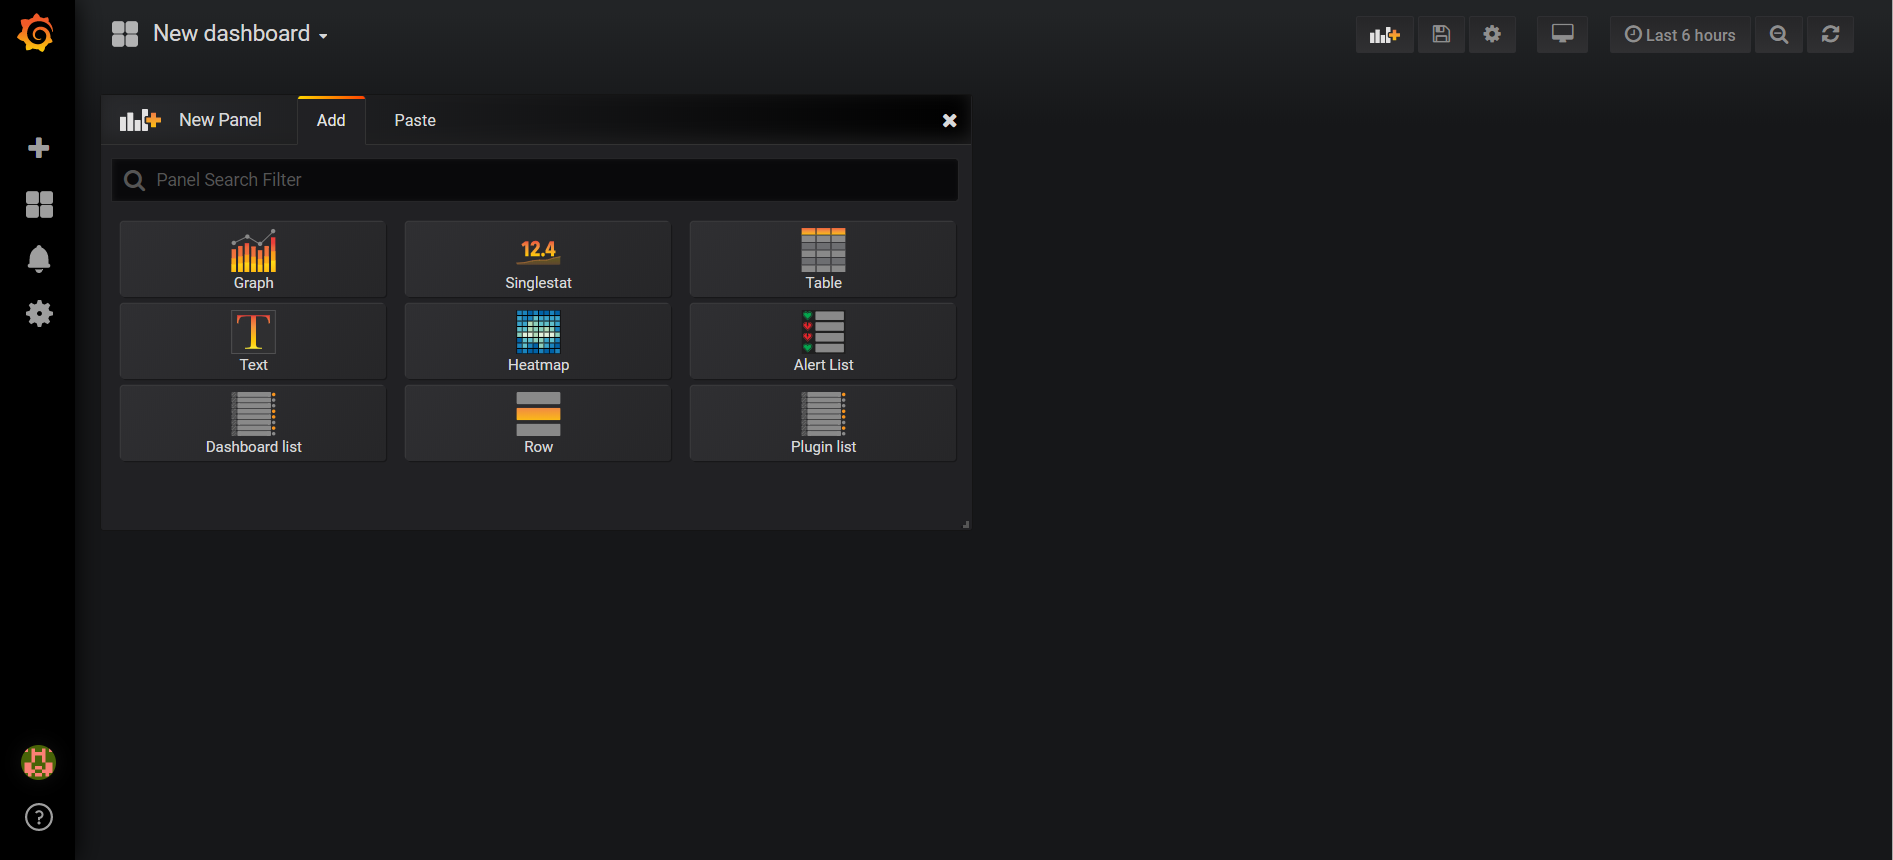
Click the New dashboard button.
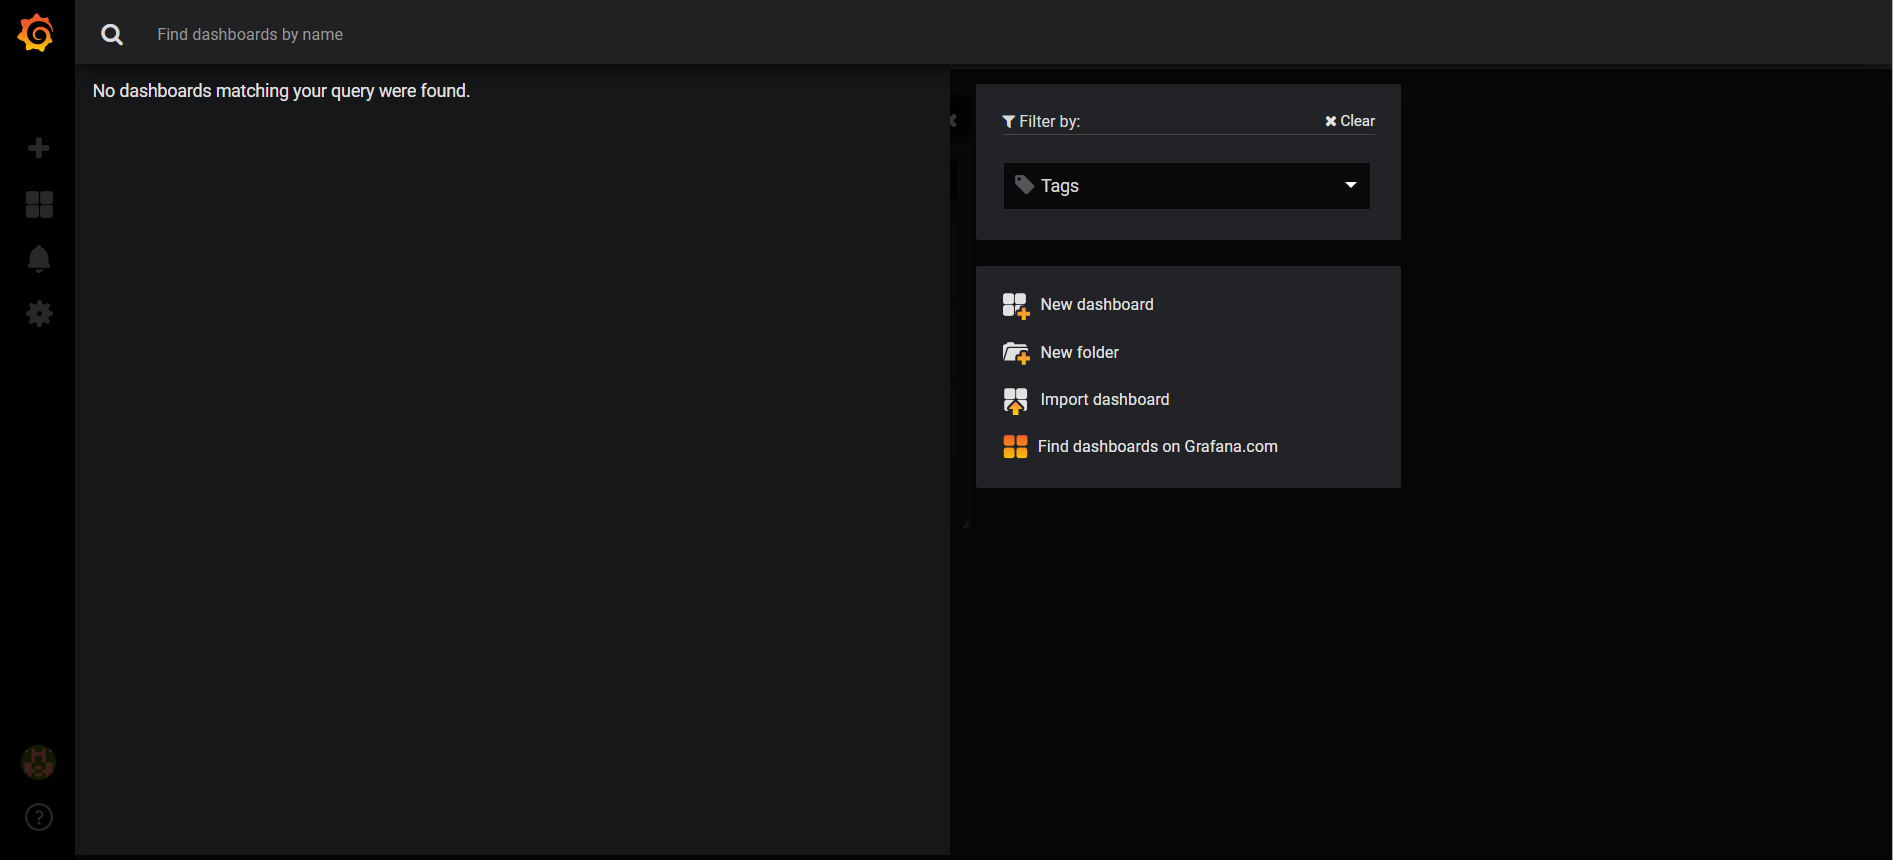
Click the Import button.
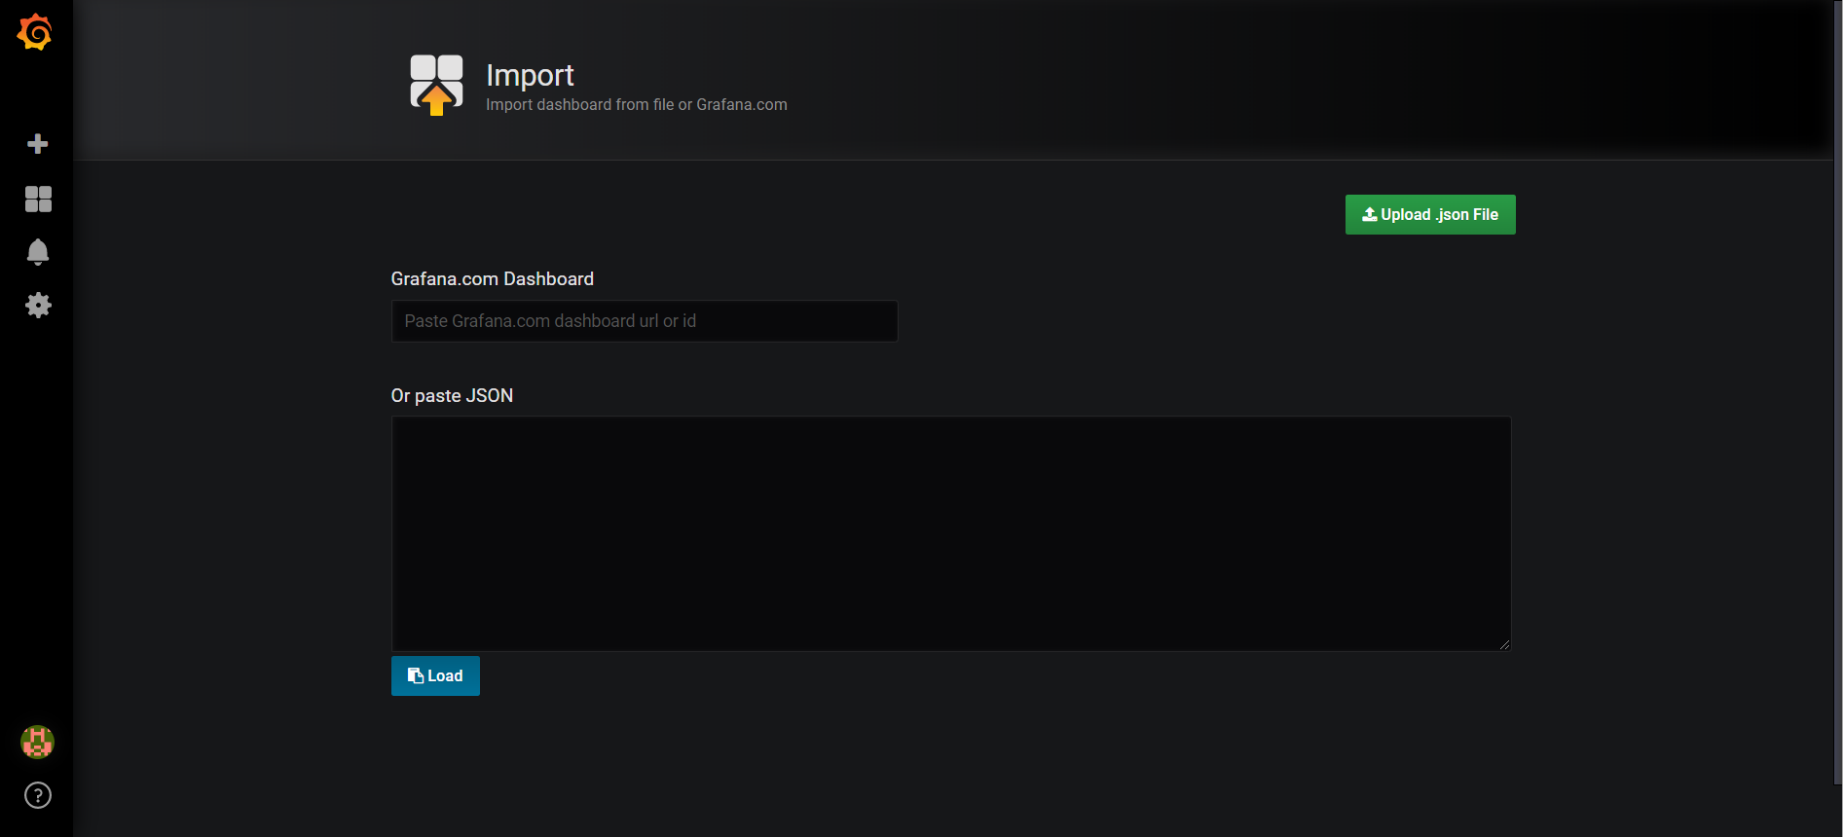
Now, users can download the configuration file created for RocketMQ on the Grafana official website, as shown in the following figure:
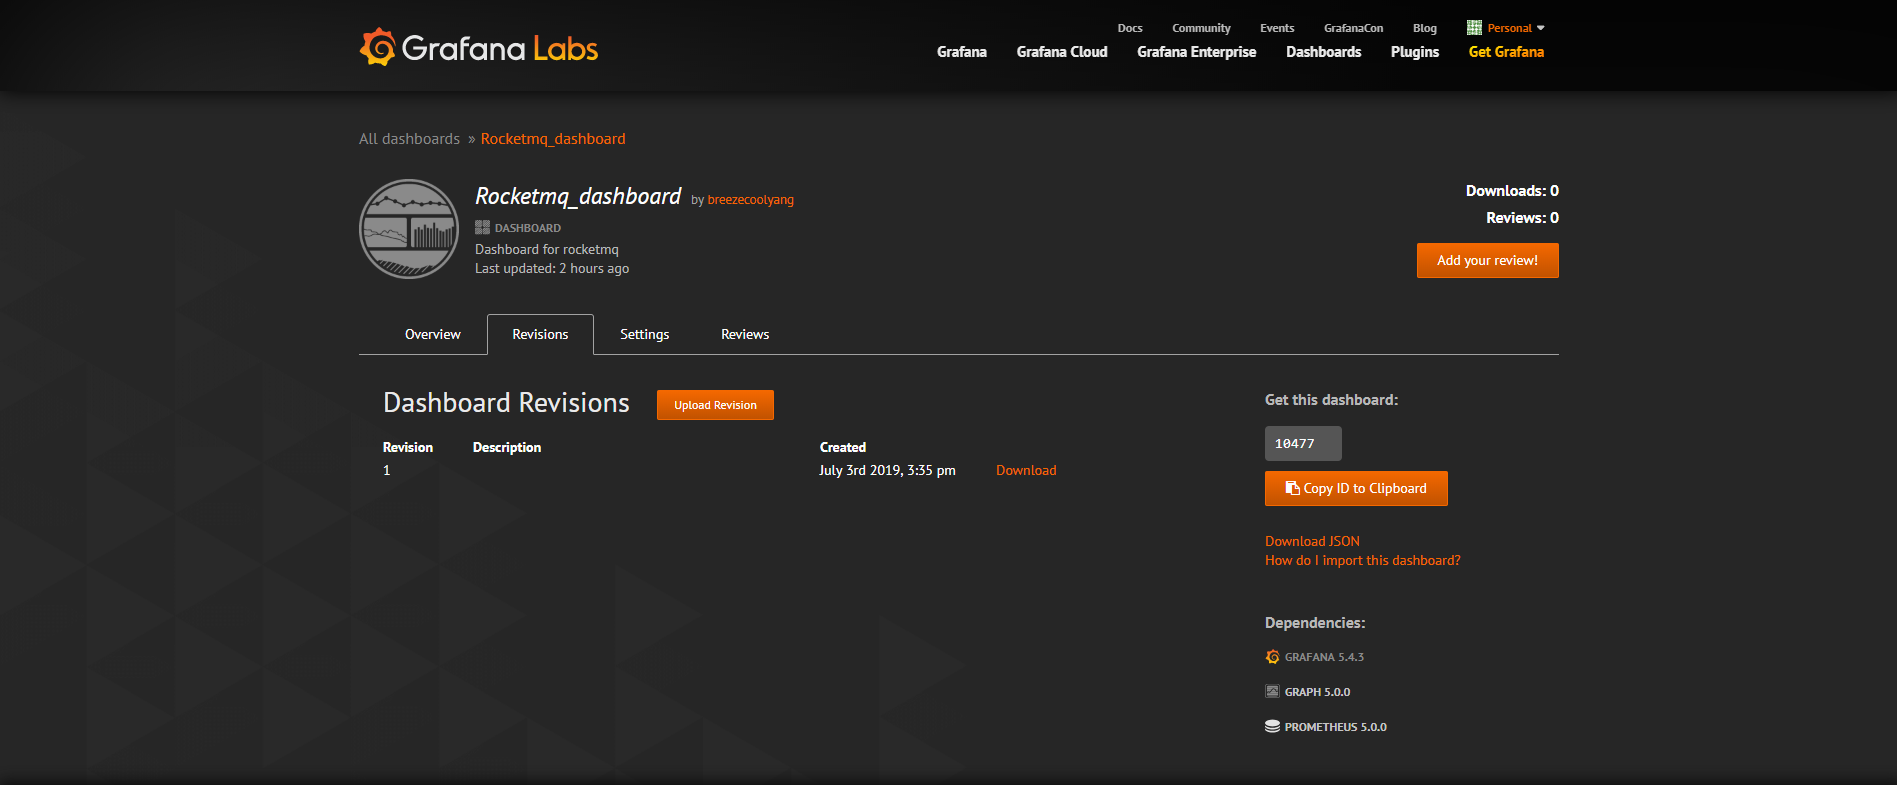
Click Download to download the configuration file. Then, copy the contents in the configuration file and paste them as required.
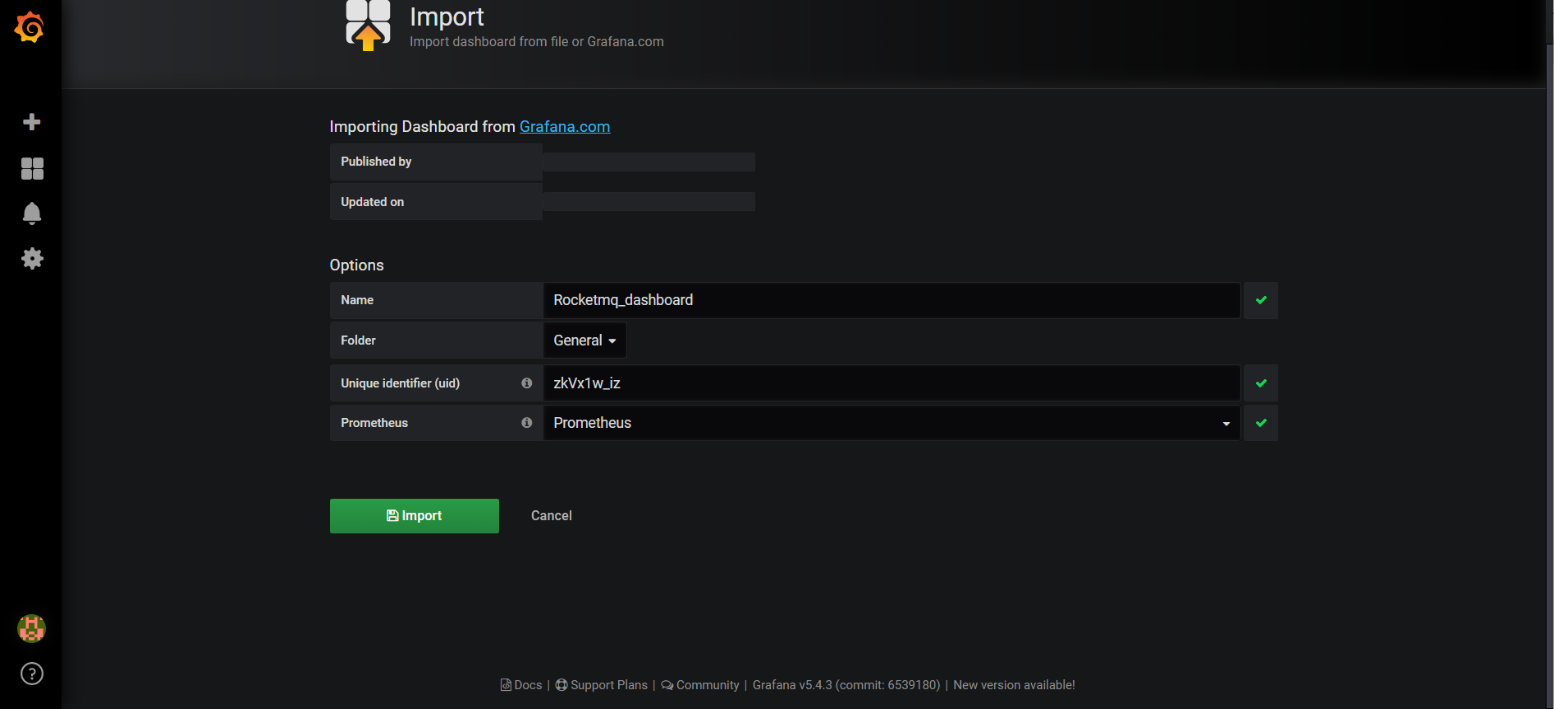
Finally, the configuration file is imported to Grafana.
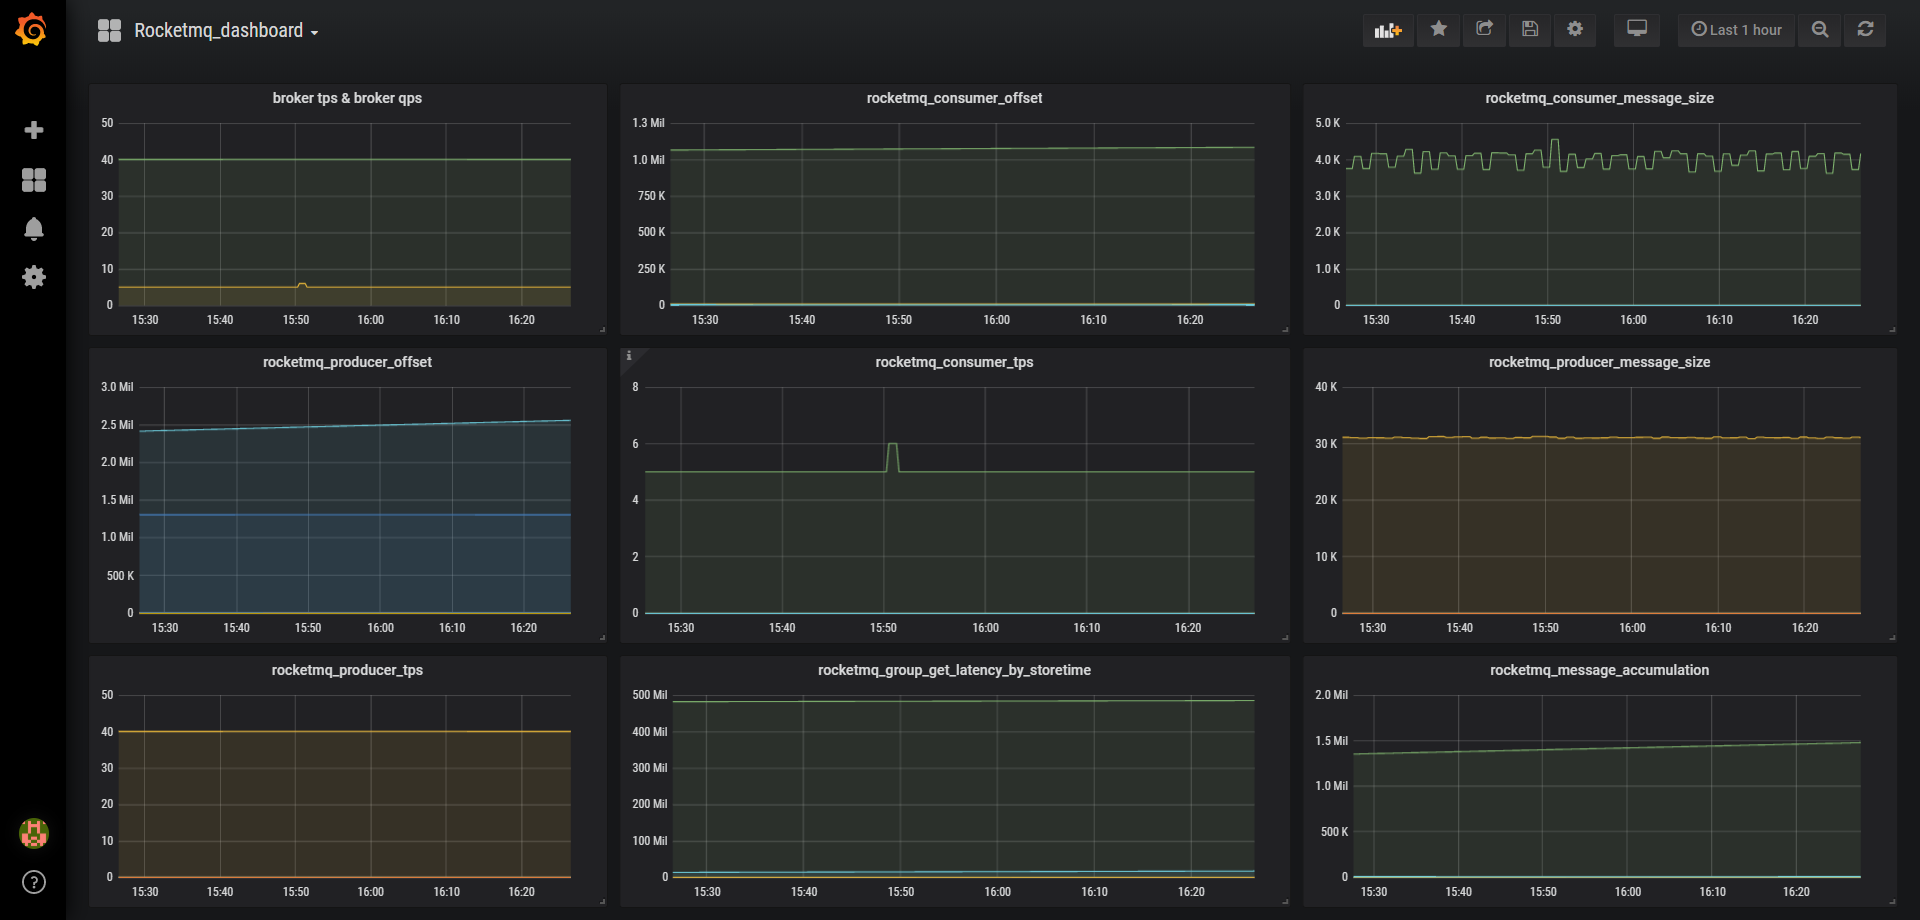
The following figure shows the final result.
Kubernetes Stability Assurance Handbook – Part 4: Insight + Plan

694 posts | 56 followers
FollowAlibaba Cloud Native Community - April 13, 2023
Alibaba Cloud Native Community - December 6, 2022
Alibaba Cloud Native Community - January 5, 2023
Alibaba Cloud Native Community - March 22, 2023
Alibaba Clouder - April 12, 2021
Alibaba Cloud Native Community - March 20, 2023

694 posts | 56 followers
Follow Alibaba Cloud Flow
An enterprise-level continuous delivery tool.
Learn More DevOps Solution
Accelerate software development and delivery by integrating DevOps with the cloud
Learn More ApsaraMQ for RocketMQ
ApsaraMQ for RocketMQ is a distributed message queue service that supports reliable message-based asynchronous communication among microservices, distributed systems, and serverless applications.
Learn More Resource Management
Organize and manage your resources in a hierarchical manner by using resource directories, folders, accounts, and resource groups.
Learn MoreMore Posts by Alibaba Cloud Native Community