By OpenAnolis System Operation & Maintenance Alliance (SOMA)
As AI and cloud-native technologies continue to evolve, O&M tools are playing an increasingly vital role in rapid assessment of system stability, timely alerting, and root cause analysis. Among the varieties of O&M tools available in the industry, there are ineffective ones characterized as low-quality, redundant, difficult to use, and poorly compatible. To identify excellent options, the OpenAnolis System Operation & Maintenance Alliance (SOMA) conducts a comprehensive evaluation and comparison of various O&M tools through fault injection.

With the development of the Internet industry, the software architecture used for applications such as e-commerce and short video has undergone leapfrog upgrades. In a word, the general system architecture has evolved from monolithic architecture to distributed architecture and finally to microservices architecture. At present, service mesh is arising as a new technology pattern.
Earlier websites only need to handle a smaller traffic volume, using a monolithic architecture where all required functions, modules, and components of the system were coupled within a single application. These tightly coupled elements usually ran in the same process and share the same database. This design pattern is simple and intuitive, with lower costs of development, deployment, and maintenance. It is suitable for the rapid development of small applications. However, its disadvantages are also evident, as it does not allow horizontal expansion and exhibits high coupling.
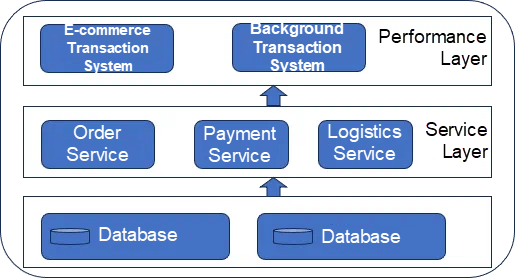
Distributed architecture abstracts away repetitive code to provide unified functionality able to be called by other business code or modules. It consists of a service layer and a presentation layer. The service layer encapsulates specific business logic for use by the presentation layer, while the presentation layer handles interactions with the web pages. Distributed architecture improves code reusability and the overall access performance. However, such architecture involves complex call relationships, making it difficult to maintain the system.
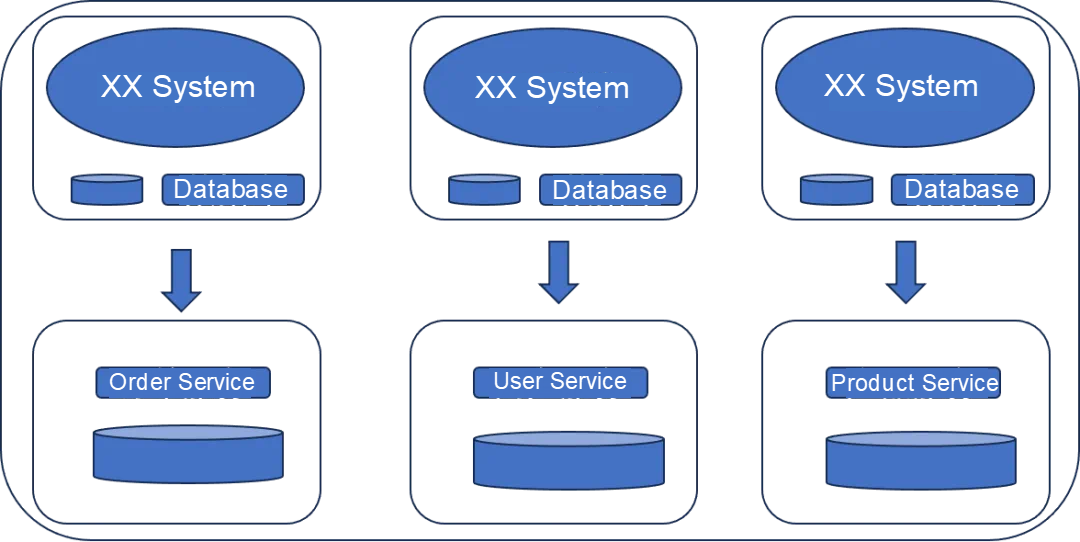
Microservices architecture is an approach of breaking a large application into multiple small, independent applications (microservices) running separate processes. They communicate with one another through messaging or remote calls. Each microservice in the system can be independently developed, deployed, and maintained. These microservices are loosely coupled, which facilitates expansion and maintenance. Its development can be costly and complicated, with challenges in maintaining data consistency.

As system architecture becomes more complex and applications diversify, especially in Kubernetes scenarios, the number of call levels between different services increases. This poses the following challenges to the stability of business systems and the effectiveness of O&M tools:

Stability issues resulting from architecture changes can cause more severe impact, especially as the traffic and the number of users grow. In addition to necessary pre-launch tests, targeted assurance activities are equally important. For instance, when a new game project goes live, it is accompanied by a one- or two-month special assurance operation.
However, current assurance measures are limited to post-incident remediation. Is it possible to enable proactive O&M through fast detection and early warning of issues? The answer is enhanced O&M tools to support system monitoring and observability (such as the current cloud-native observability products). Such tools should be able to collect system operation metrics in real time, make fault predictions based on abnormal metric trends, conduct root cause analysis using intelligent algorithms, and offer suggestions for issues. This way, we can quickly find and solve problems.
To ensure effective O&M, we also need to carry out failure drills to uncover and address potential problems, such as insufficient metrics, ineffective alerts, and inadequate root cause analysis, in the O&M tools.
The development of cloud-native technologies and the wide adoption of microservices architecture and containerization result in increasingly complex software architecture, and the uncertainty caused by dependencies between services is also growing exponentially. Any unexpected or abnormal changes in one component may exert a significant impact on other services. Therefore, it is necessary to build a failure drill platform and mechanism to improve the fault tolerance and resilience of the system architecture and verify the entire fault location capability and recovery system.
The following figure shows the drill tasks performed in different environments in each stage. The purpose is to verify the system stability and the effectiveness of the O&M alert management platform in the test environment, staging environment, and production environment through fault injection.
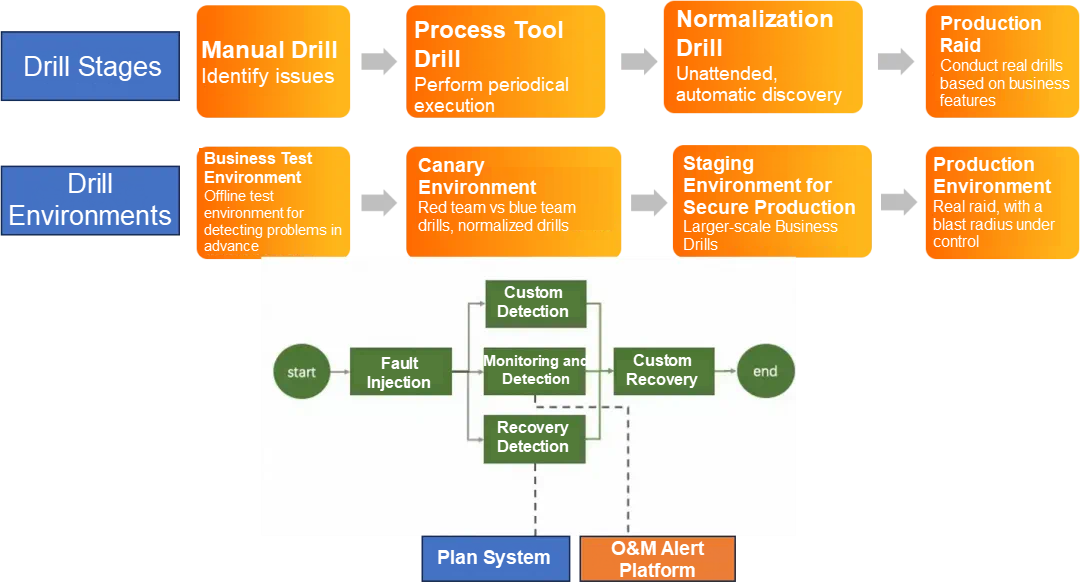
According to the general process of fault handling, a failure drill can also be divided into the following three stages:
Failure drills are conducted to test the stability of a business system or the overall performance of O&M tools in response to various potential problems that may occur in online environments.
Failure drills conducted in the production environment is of the highest level. They provide key insights into the diversity of injected cases, the control and orchestration capabilities (chaos engineering) of the system, the alerting and root cause analysis capabilities of the observability platform, and the effectiveness of data isolation. This is where the full-link stress testing comes into play, which will be discussed in the next section.
Why do we need full-link stress testing if we already have failure drills? This is because some problems are only exposed under extreme traffic conditions, such as those related to network bandwidth, inter-system impacts, and infrastructure dependencies.
Many people may be curious about how we conduct full-link pressure testing for major sales events like the Double 11 Shopping Festival. Beyond a mere stress test, the full-link stress testing is more of a simulated high-traffic sales event aiming to verify the high-availability solutions, such as plan drills, throttle validation, and destructive drills.
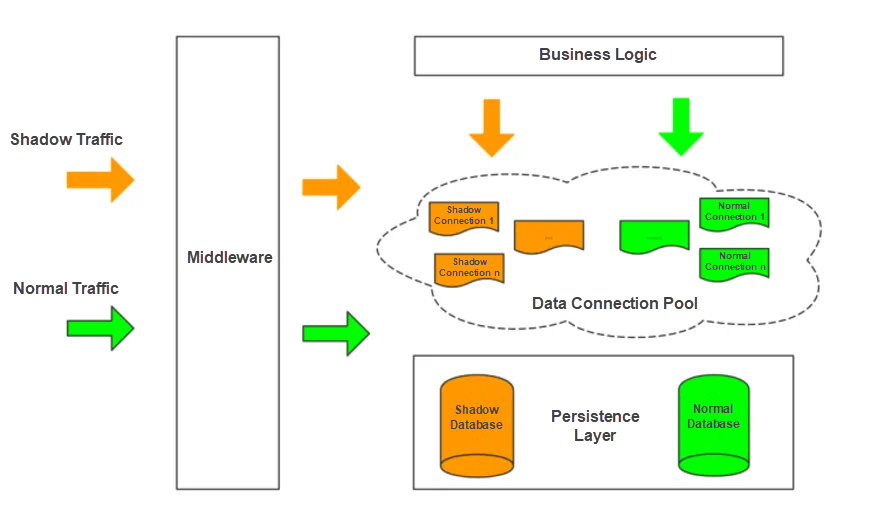
Special attention must be paid to isolation of production data in the full-link stress testing. This is to ensure that the stress testing on the production environment does not affect the normal operation of online business. The solution is to store the data generated from stress testing in isolation from the actual data used in production to prevent dirty reads. Currently, there are two isolation approaches: shadow tables and shadow databases.
Here we will take a closer look at shadow databases, which are created on the same instance. The stress testing probe mounted on the user service performs bypass processing when detecting the traffic markers. For shadow traffic, it retrieves shadow connections from the shadow connection pool for use by the business side to route the data generated from the stress testing traffic to the corresponding shadow database. This way, stress testing data can be isolated from the production databases and will not contaminate the production data.
A business can be safely launched after failure drills and full-link stress testing. Does it make O&M tools useless? Of course not. Typically, large-scale cloud-native systems still rely on robust observability tools to safeguard business operations. Therefore, O&M tools that have been validated through failure drills and full-link stress testing could be potential options. It is helpful to design various failure scenarios for a comprehensive assessment of available O&M tools.
There are many scenarios for failure drills. We can design a failure scenario at the level of a single system application or cluster components to test the stability of a business system and, more importantly, its ability to detect problems early. This places higher demand on O&M tools, thus posing greater challenges.
Design failure scenarios based on vertical layering:
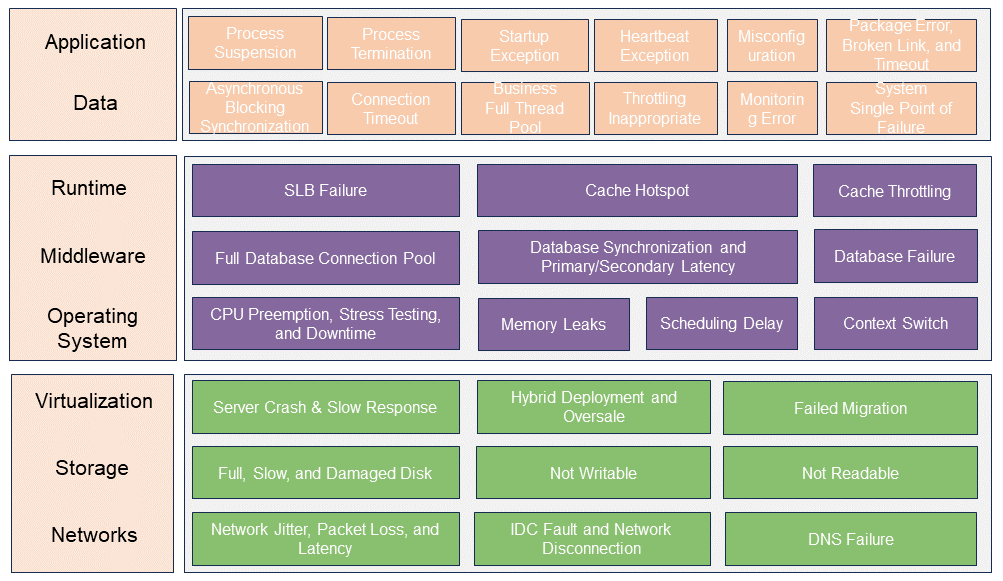
Design failure scenarios at the cluster and component levels:
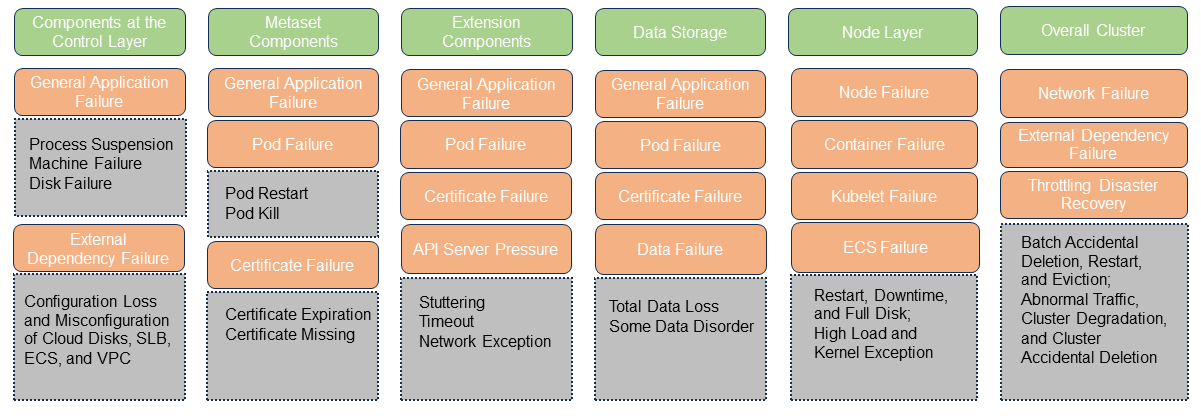
Conducting drills for different business and deployment scenarios allows us to comprehensively assess O&M tools. For example, by simulating packet loss using chaos engineering, we can evaluate whether the tools can identify and alert on issues within milliseconds and detect connection failures and timeouts from application monitoring, and whether the tools can pinpoint errors in the OS kernel, cloud environments, or physical environments.
O&M tools can be effectively tested in an all-around manner with a scenario where system crashes are caused by null pointer dereference. It tests whether cluster-based O&M tools can quickly detect single-node failures, capture vmcore information, analyze the root cause of the crash, report on the health status of the node, and perform migration actions based on impact assessment.
According to the above discussion on failure drills, it is evident that O&M tools play an important role in the early warning and detection of problems, as well as root cause analysis. They are essential for quickly identifying the stability issues of business systems, giving timely alerts, and conducting root cause analysis. Other metrics of interest for evaluating O&M tools include diversity of features, timeliness of alerts, metric validity, stability, size, ease of use, functionality, and community support. Failure drills create a suitable environment for effectively evaluating O&M tools based on the aforementioned considerations.
Deploying a complete set of O&M tools on a mature business system, especially those that run constant monitoring, typically incurs a performance overhead. For instance, profiling, which is often used for performance analysis in observable scenarios, can affect the overall system performance. Therefore, it is essential to minimize the impact of O&M tools on the system after deployment. To this end, we must select an O&M product that offers rich functionality while ensuring minimal performance overhead, reasonable storage costs, effective fault prediction and alerting, and intelligent root cause analysis and repair suggestions.
Considerations for the evaluation of O&M tools are summarized as follows:
The evaluated items under functionality, alerting, and observability metrics are further discussed in the following section.
1. Comprehensive functionality:
2. Flexibility in alert configuration:
3. Fault location accuracy:
1. Alert latency detection:
2. Coverage of alerting channels:
3. Threshold sensitivity:
4. Alert notification frequency control:
1. Richness of observable data source:
2. Data visualization:
3. Insight and analysis depth:
4. Extensibility and compatibility:
The quantitative evaluation of the above evaluation items provides a full picture of the functional accuracy, alarm timeliness, and observation effectiveness of O&M products. At the same time, the evaluation process should be combined with specific scenarios and user needs to ensure that the evaluation results are targeted and practical.
As the business system involves thousands of industries, many kinds of chaos engineering exist in the market, O&M tools are uneven, the O&M technology is always going after foreign countries, and industry development is blocked. The O&M ecosystem also shows the phenomenon that no one pays attention when there is no problem, and the O&M personnel take the blame when there is a problem, with no awe of faults and no sufficient understanding of the role of O&M tools.
With the development of AI and cloud-native technologies, systems are becoming increasingly complex, and the number of call levels is rising. Therefore, the exploration of observability and AIOps O&M has never ceased both domestically and internationally, leading to the emergence of many excellent tools. However, some of these tools are low quality, repetitive, difficult to use, and poorly compatible. To foster growth in the O&M industry and distinguish excellent tools, the OpenAnolis community has established SOMA. One of its key tasks is to inject failures into specific business systems to assess and evaluate different O&M tools. These tools are then compared through a scoring and ranking mechanism to determine which is the best.
SOMA is an organization initiated and established by the OpenAnolis community together with platform manufacturers, O&M manufacturers, universities and scientific research institutes, institutions, and industry users in accordance with the principles of equality and voluntariness, with the aim of promoting the progress of system operation and maintenance technology and facilitating industry-university-research cooperation. By establishing a fault injection platform and an O&M product strength evaluation system, SOMA bridges the communication between platform manufacturers, O&M manufacturers, and customers, enabling users to have a comprehensive understanding of the O&M product landscape.
The O&M tool evaluation set up by SOMA mainly includes four systems: case injection, system under test, evaluation system, and report and scoring system. By injecting different types of cases into the system under test that uses a standard microservice system, with the fault expectation given to the evaluation system through the standardized API, the evaluation system collects field metrics from the test point, such as the standard API exposed by the O&M tool or the third-party standard observation system, to match the range with the expected metrics. After the evaluation is completed, the evaluation system generates a score and test report of the product. Later, these score results will be ranked, industry reports will be released, and some commercialization actions will be carried out.
Workflow:
1. Input fault cases and chaos control engineering.
The fault cases include customer cases, manufacturer cases, and evaluation cases. The first two cases are mainly used to allow customers and manufacturers to simulate case injection and fault behaviors at any time, so that customers can have a comprehensive understanding and evaluation of fault manifestations and the capabilities of O&M tools. Evaluation cases are mainly used to review, rank, and score the qualifications of O&M tools, and are standardized and credible.
2. Collects metrics.
When evaluating business systems, you should consider the following selection criteria: sustainable maintenance, microservice applications, and rich debugging APIs. The Train-ticket microservice application developed by Professor Peng Xin's team from Fudan University is currently used as a business benchmark. This microservice application can also be based on online boutiques. The benchmark metrics of the evaluation system come from the fault injection system, and we have to collect the business system metrics from the APIs provided by the O&M tool. At present, most O&M tools do not have these APIs, or the APIs are not perfect. Therefore, we need to create some standards to standardize them.
3. Carry out metric comparison and range matching.
The evaluation system needs to obtain the expected output metrics from the injection system as a benchmark and compare them with the metrics obtained by the O&M tool itself. Develop a set of criteria based on the metric category, and then determine the metric deviation range to score the tool.
4. Score, output tool level distribution, and generate a single test report.
5. Publish the rankings and the annual O&M industry report according to the scores.
Workflow and data APIs of failure drills and O&M tool evaluation:
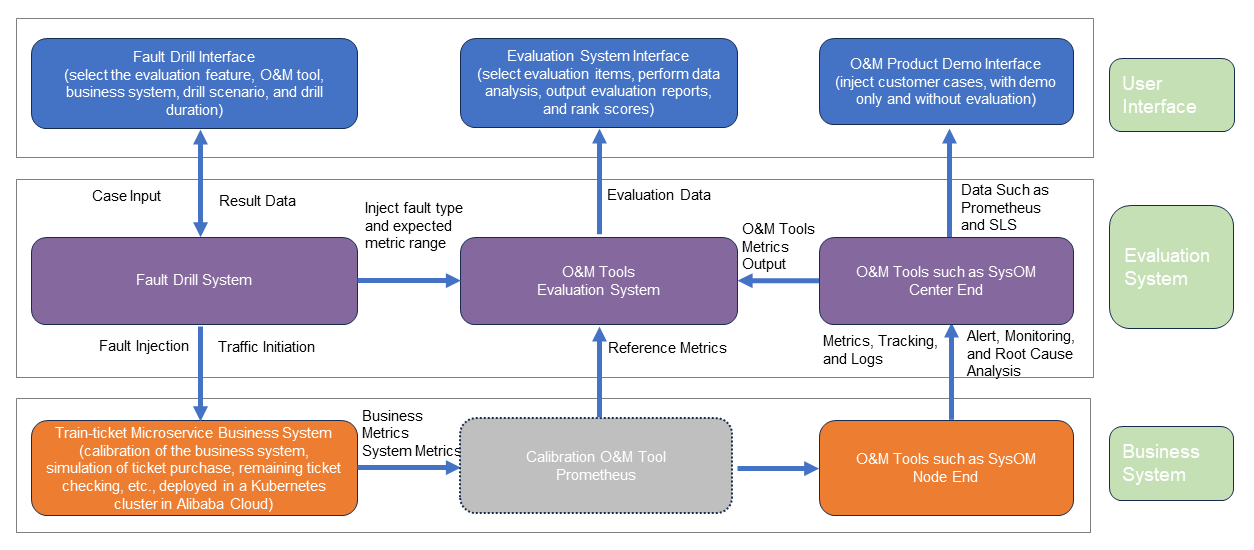
From the above analysis, we can see that the key aspect of an evaluation system is to formulate a set of evaluation items and standards to determine which metrics can be evaluated automatically. The metric range needs to be standardized for specific scenarios, ideally determined at the time of fault injection. Metrics such as CPU utilization, memory usage, and system delay should have deterministic expectations.
The most challenging work done by the O&M Alliance is to define this set of standards and implement automated evaluation capabilities based on the standards. We also hope that more and more individuals and enterprises who are interested in this will contribute to it together.
At present, the Chaos Mesh-based fault injection system that is developed by the alliance member Yunguan Qiuhao team has been open sourced in the OpenAnolis community. It currently provides fault cases for network, storage, and Kubernetes. I hope everyone can contribute cases together. You can visit the SOMA webpage to experience it through the OpenAnolis community homepage: https://soma.openanolis.cn/
We have formed the following evaluation knowledge graph for O&M platforms of Alliance members according to different evaluation types.
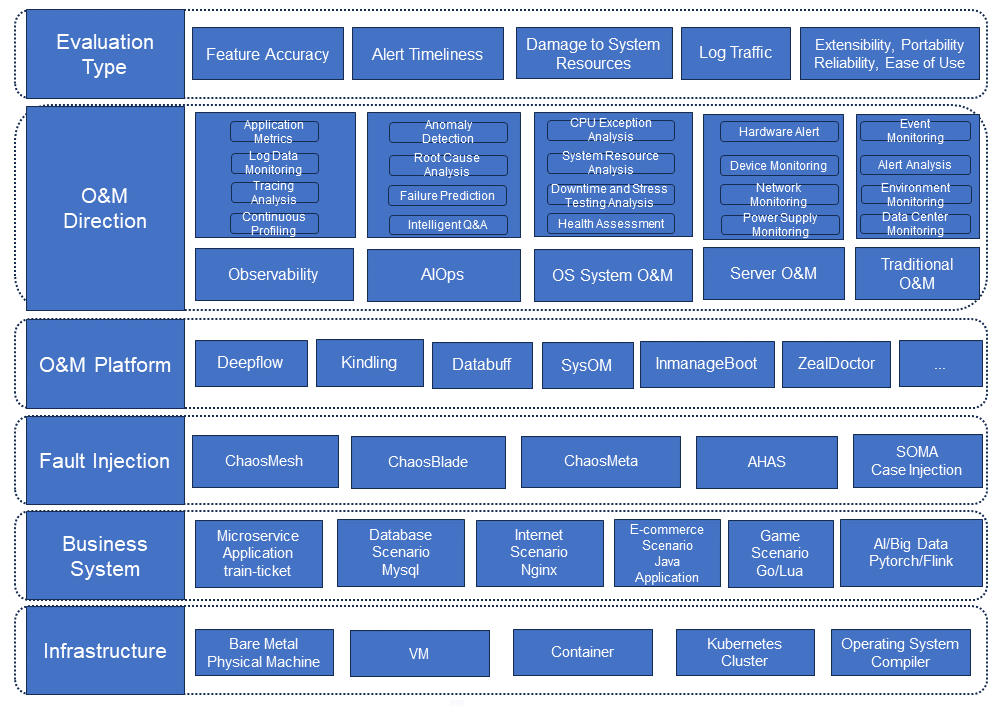
As can be seen from the above evaluation knowledge graph, we have divided evaluations conducted by SOMA into the following fields:
Each field has its own evaluation items, evaluation content, and evaluation methods, some of which are shared and cross-cutting. But in any case, a good evaluation includes the following key points:
The focuses of O&M tools vary from different business. SOMA will focus on the popular tools of these two types: observability and AIOps.
For observability, we'll choose a specific function point for evaluation. Feedback on the health status of a node is provided based on aggregated metrics. The health status can be healthy, sub-healthy, or unhealthy. The metrics include saturation, system errors, system latency, and network traffic. The following list describes the metrics:
In addition, when the O&M tool is in place, how can we judge its impact on the original system, that is, the damage to system resources? We first take a third-party calibration tool as a trusted source, such as the Prometheus collection tool, and compare the metrics of the calibration tool with the metrics output by the tested tool to score and evaluate the tested tool. At present, this evaluation item is being developed by the Alliance member Yunshan network team and will soon be open sourced at https://gitee.com/anolis/soma.
Related evaluation items:
In the end, we will evaluate the level of the tool, which will include the following aspects:

The score and tool level that are evaluated may vary with the evaluation item. The research results in this field will be introduced in the future.
When evaluating the AIOps tool, you need to analyze the root causes of specific problems and use chaos engineering to simulate multiple fault scenarios to test the effectiveness and robustness of the AIOps solution. You provide a set of standardized evaluation metrics and datasets by collecting metrics and logs, and tracing analysis, offering a reference to users to select an appropriate AIOps tool. You provide real data and scenarios for O&M application developers and researchers for academic research, product testing, and evaluation ranking.
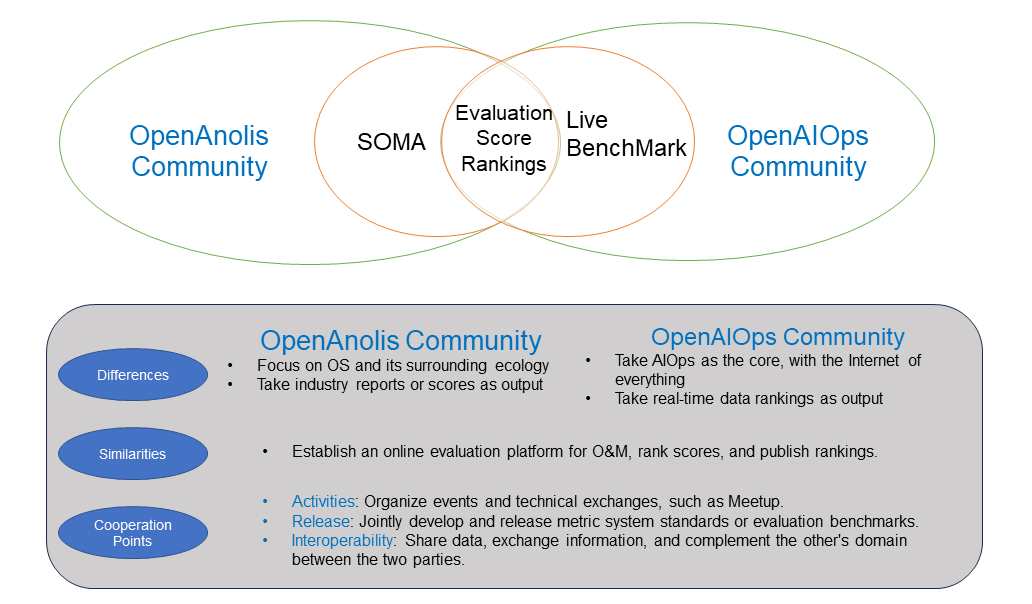
SOMA cooperated with the OpenAIOps community initiated by Professor Pei Dan from Tsinghua University to jointly establish evaluation capabilities in the AIOps field.

1,397 posts | 492 followers
FollowAlibaba Cloud Native Community - March 2, 2023
Alibaba Cloud Community - October 10, 2022
Alibaba Clouder - March 12, 2020
Alibaba Developer - January 19, 2022
Alibaba Clouder - November 11, 2020
Aliware - August 18, 2021

1,397 posts | 492 followers
Follow Bastionhost
A unified, efficient, and secure platform that provides cloud-based O&M, access control, and operation audit.
Learn More Managed Service for Grafana
Managed Service for Grafana displays a large amount of data in real time to provide an overview of business and O&M monitoring.
Learn More Mobile Testing
Provides comprehensive quality assurance for the release of your apps.
Learn More Penetration Test
Penetration Test is a service that simulates full-scale, in-depth attacks to test your system security.
Learn MoreMore Posts by Alibaba Cloud Community