By Liu Zhongwei (Moyuan), Alibaba Technical Expert
To begin with, let's discuss the requirement to ensure the health and stability of applications that are migrated to Kubernetes. The requirement is met by taking the following measures:
1) Improve the observability of applications
2) Improve the recoverability of applications
The observability of an application is improved as follows:
1) Check the health of applications in real-time.
2) Learn about the resource usage of applications.
3) Troubleshoot and analyze problems based on the real-time logs of applications.
When a problem occurs, the first priority is to reduce the scope of its impact and troubleshoot the problem. In this situation, the ideal result is to fully recover the applications using the Kubernetes-integrated self-recovery mechanism.
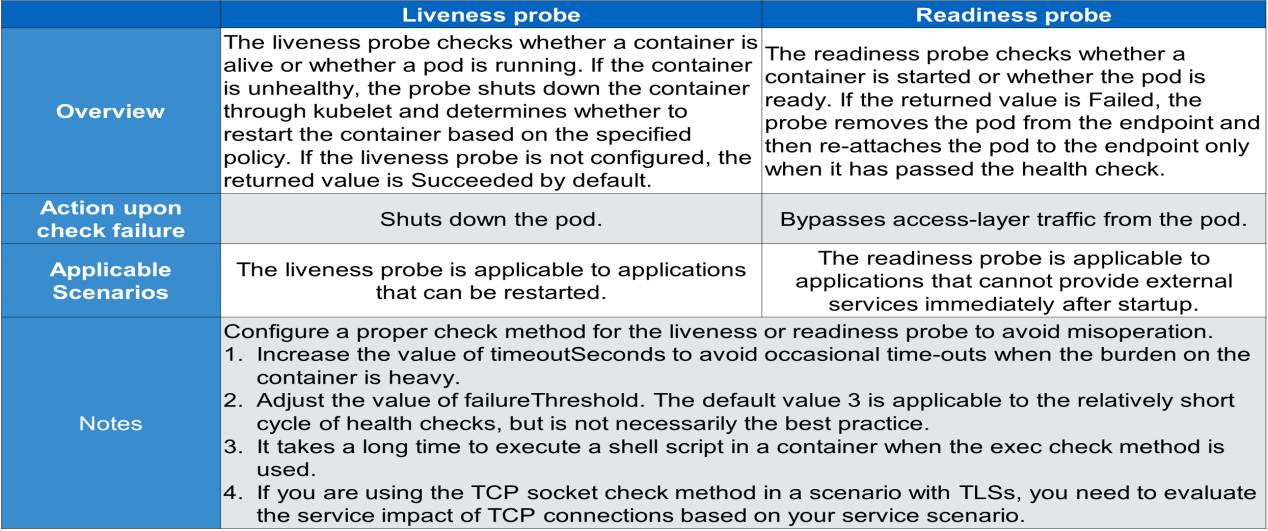
The readiness probe is used to check whether a pod is ready. Only pods in the ready state provide external services and receive traffic from the access layer. When a pod is not in the ready state, the access layer bypasses traffic from the pod.
Let's take a look at a simple example.
The following figure shows a simple schematic diagram of the readiness probe.
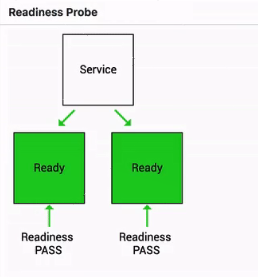
Traffic from the access layer is not directed to the pod when the readiness probe determines that the pod is in the Failed state.
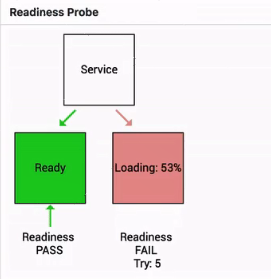
The pod receives traffic from the access layer only after its state changes from Failed to Succeeded.
The liveness probe is used to check whether a pod is alive. What happens when a pod is not alive?
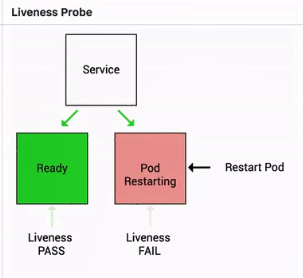
A high-level mechanism determines whether to restart the pod. The pod is directly restarted if the set high-level policy is "restart always".
This section describes how to use the liveness and readiness probes.
The liveness and readiness probes support three check methods.
1) HTTP GET: Sends an HTTP GET request to check the health of an application. The application is considered healthy when the return code ranges from 200 to 399.
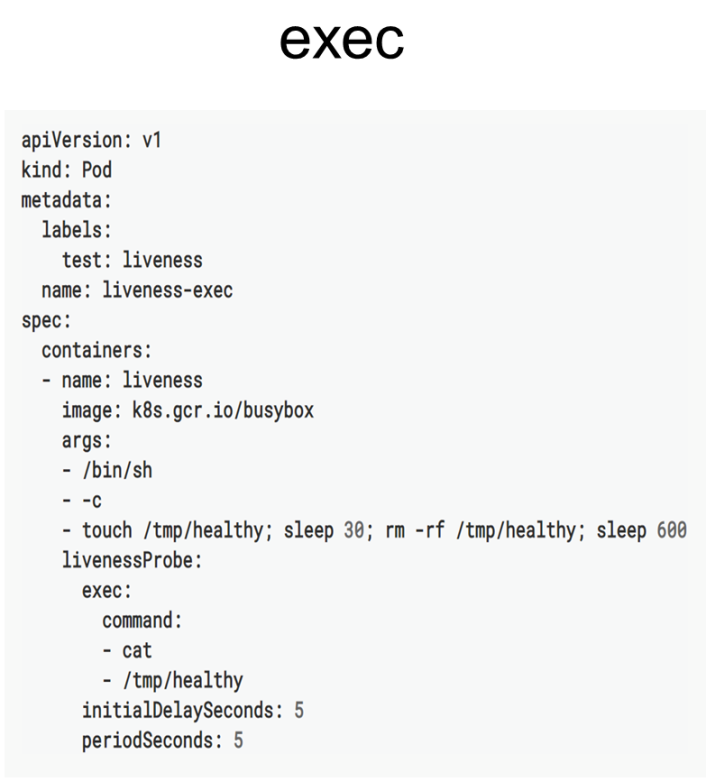
2) exec: Checks whether a service is normal by running a command in the container. The container is healthy when 0 is returned for the command.
3) TCP Socket: Performs a TCP health check on a container by checking the IP address and port of the container. The container is healthy if a TCP connection is established.
Check results are divided into three states:
The kubelet includes the ProbeManager component that provides the liveness probe or readiness probe, which checks the application health through pod diagnosis.
The following describes the YAML file that is used by the preceding check methods.
The exec check method is described first. The following figure shows the liveness probe that is configured with an exec-based diagnosis and a command field in which a specific file of cat is used to check the status of the current probe. The liveness probe determines that the pod is healthy when the return value in the file (or the command-returned value) is 0.
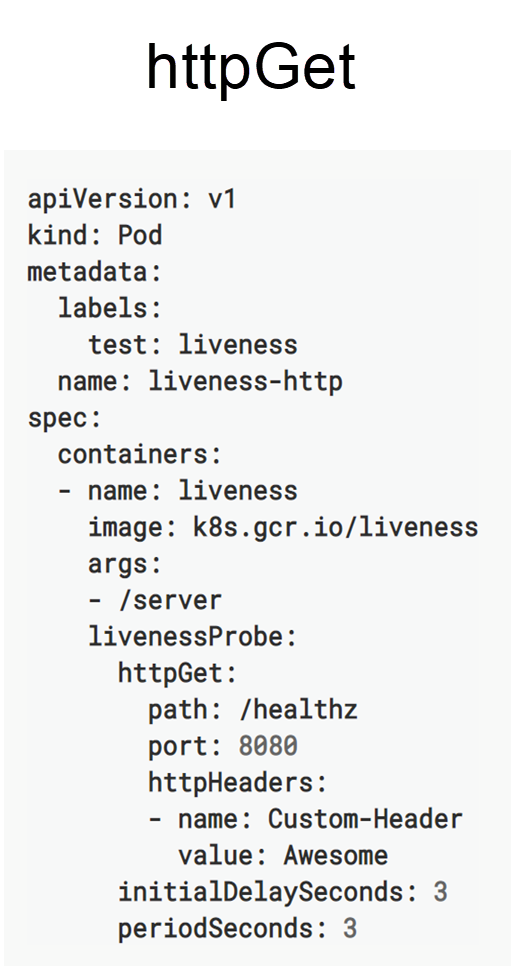
The following figure shows the HTTP GET method that is configured with three fields: path, port, and headers. The "headers" field is required when the health status is determined based on the header value. Other cases, only require the "health" and "port" fields.
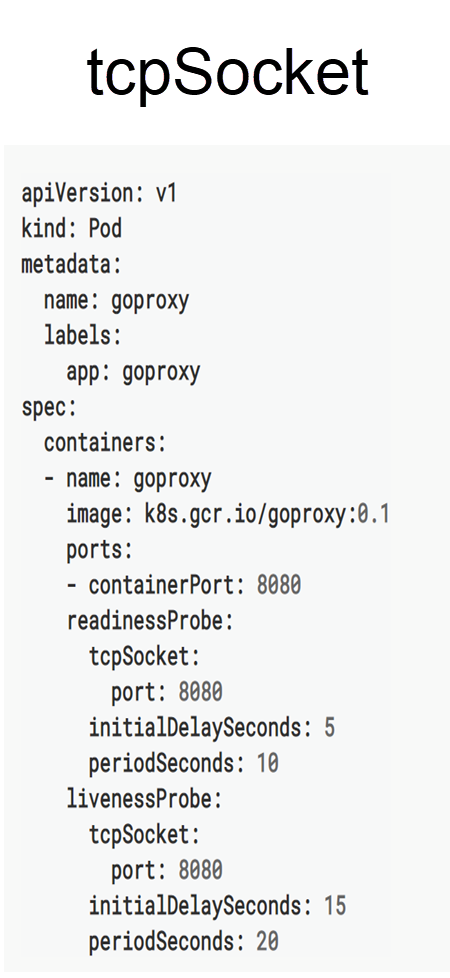
Another simple method is the TCP socket method, which only requires a monitoring port. In the following figure, Port 8080 is the monitoring port. The probes used by TCP socket-based health check determine that the pod is healthy when a TCP connection is established through Port 8080 after review.
The following five global parameters are used by health check:
The following table summarizes the liveness and readiness probes:
Now, let's understand how to troubleshoot common problems in Kubernetes.
A design idea of Kubernetes is the state mechanism. Kubernetes is designed specifically for the state machine, and it defines the expected state by using YAML files. When YAML files are executed, the state transition is managed by controllers.
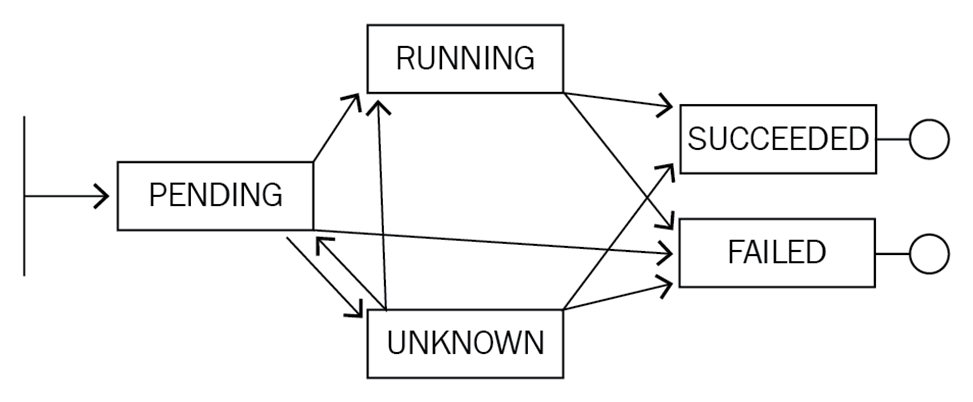
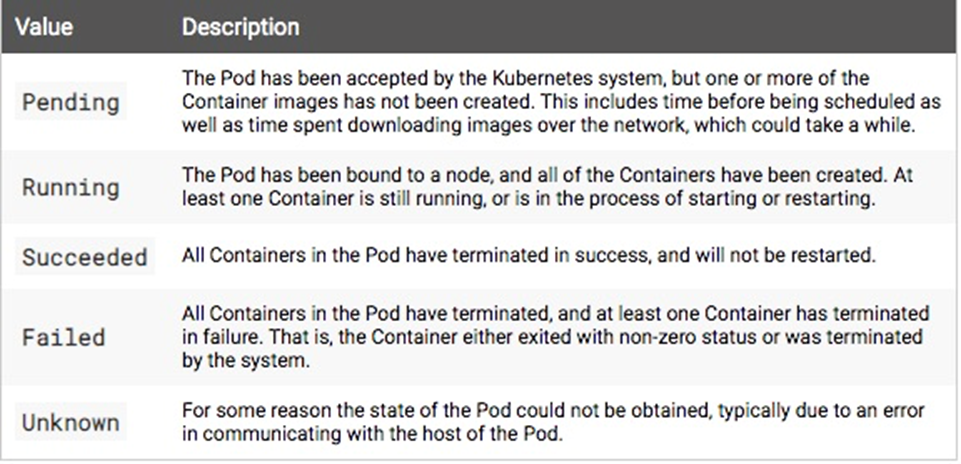
The preceding figure shows the life cycle of a pod. The pod may change from the initial Pending state to the Running, Unknown, or Failed state. The pod may change to the Succeeded or Failed state after it has run for a while. It may also change from the Unknown state to the Running, Succeeded, or Failed state by means of recovery.
The Kubernetes system implements state transition in a way that is similar to the state machine. A specific state transition is indicated by the Status and Conditions fields on the corresponding Kubernetes object.
The following screenshot shows the states of a pod.
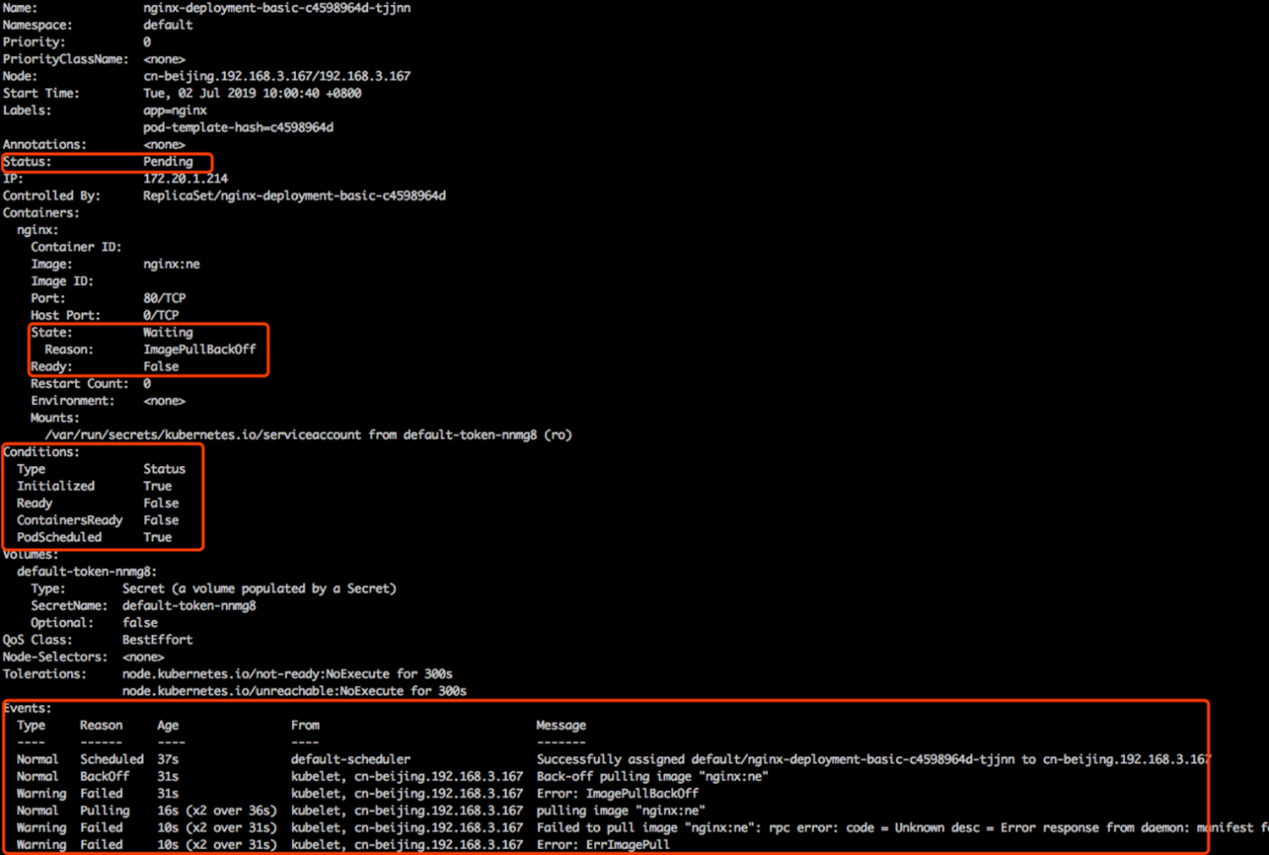
The Status field indicates the aggregate status of the pod, which is Pending in this case.
The State field indicates the aggregate status of a specific container in the pod, which is Waiting in this case because the container image is not yet pulled. Ready is set to False because the pod cannot provide external services until the container image is pulled. The pod provides external services only when the high-level endpoint determines that the value of Ready is True.
The Conditions fields in the Kubernetes system are aggregated to determine the Status field. Initialized is set to True to indicate that the pod has been initialized. Ready is set to False to indicate that container images are not yet pulled.
ContainersReady is set to False. PodScheduled is set to True to indicate that the pod is scheduled and bound to a node.
The pod status is determined based on the values (True or False) of the Conditions fields. The state transition in Kubernetes triggers two types of events: normal events and warning events. The reason for the first normal event is "Scheduled", indicating that the pod is scheduled to the node cn-beijing192.168.3.167 by the default scheduler.
The reason for another normal event is "Pulling", indicating that an image is being pulled. The reason for the warning event is "Failed", indicating that the image failed to be pulled.
Each of the normal and warning events indicates the occurrence of a state transition in Kubernetes. Developers determine the application status and make diagnoses based on the Status and Conditions fields as well as the events that are triggered during state transition.
This section describes some common application exceptions. A pod may stay in a specific state.
A pod stays in the Pending state until it is scheduled by a scheduler. View the specific event by running the kubectl describe pod command. View the result of the event if the event indicates that the pod cannot be scheduled due to resource or port occupation or a node selector error. The event result indicates the number of non-compliant nodes due to insufficient CPU capacity, node errors, and tagging errors, respectively.
A pod stays in the Waiting state because its image cannot be pulled, in most cases. Image pulling failure occurs due to the following causes:
(1) The image is a private image but not configured with Pod Secret.
(2) The address of the image does not exist.
(3) The image is a public image.
When a pod is restarted repeatedly and encounters backoff, it indicates that the pod is scheduled but cannot be started. In this case, determine the application status by checking the pod log rather than checking configurations or permissions.
When a pod in the Running state cannot provide external services, check configurations in detail. For example, a portion of a YAML file does not take effect after delivery due to misspelled fields. In this case, check the YAML file by running the apply-validate-f pod.yaml command. If the YAML file is correct, check whether the set port is normal and whether the liveness or readiness probe is properly configured.
When a service is abnormal, check whether it is correctly used. The service-pod association is established by a selector. A service associates with a pod by matching the labels configured for the pod. If the labels are misconfigured, the service cannot locate the subsequent endpoint, which may result in service provision failure. When the service is abnormal, check whether an endpoint follows the service and provides external services properly.
This section describes how to remotely debug pods and services in Kubernetes and how to optimize performance through remote debugging.
Log on to a container to diagnose, verify, or modify a problematic application in a cluster.
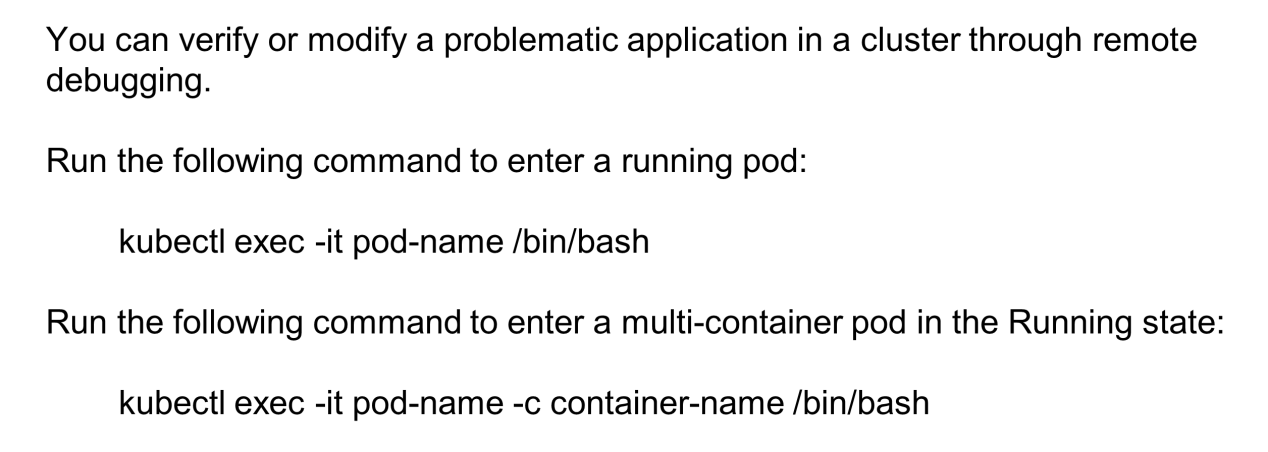
For example, log on to a pod by running an exec command. To start an interactive bash on a pod, append /bin/bash to the kubectl exec-it pod-name command. The bash allows performing operations, such as reconfiguration, by running commands. Then, restart the application through Supervisor.
To remotely debug a multi-container pod, set container-name after pod-name -c to the name of the target container and append a suffix to the kubectl exec-it pod-name command, as shown by the second command in the preceding figure.
Implement either of the following two ways to remotely debug a service:
For reverse debugging, use the open-source component, Telepresence, to configure a service in a remote cluster as a proxy for a local application.

Deploy a proxy application of Telepresence in a remote Kubernetes cluster, and then swap a single remote deployment to a local application by running the Telepresence-swap-deployment command with DEPLOYMENT_NAME defined. This helps to configure a remote service as the proxy for the local application and locally debug the application in the remote cluster. For more information about how to use Telepresence, visit GitHub.
If a local application needs to call the service in a remote cluster, call the remote service through a local port in port-forward mode. For example, locally debug code by directly calling the API server that provides ports in a remote cluster in port-forward mode.

Configure a local port as a proxy for a remote application by running the kubectl port-forward command that is appended with the remote service name and namespace. This enables access to the remote service through the local port.
This section describes the kubectl-debug, an open-source debugger used by kubectl. Docker and container are common container runtimes in Kubernetes. They are virtualized and isolated based on the Linux namespace.
Normally, only a small number of debuggers, such as Netstat and Telnet, are embedded into images to keep applications slim. Use kubectl-debug for debugging.
The kubectl-debug tool applies a Linux namespace to an additional container for debugging in the same way as directly debugging the Linux namespace. The following is a simple example.
After kubectl-debug (a plug-in of kubectl) is installed, diagnose a remote pod by running the "kubectl-debug" command. This command runs to pull an image that includes diagnosis tools by default and starts the debug container when the image starts. Meanwhile, this command connects the debug container to the namespace where the container to be diagnosed is located. In this way, the debug container is in the same namespace as the container to be diagnosed. This allows viewing website information or kernel parameters in the debug container in real-time.

The debug container that includes information such as the hostname, processes, and netstat is in the same environment as the pod to be debugged. Therefore, it's easy to view this information by running the three commands described in the preceding section.
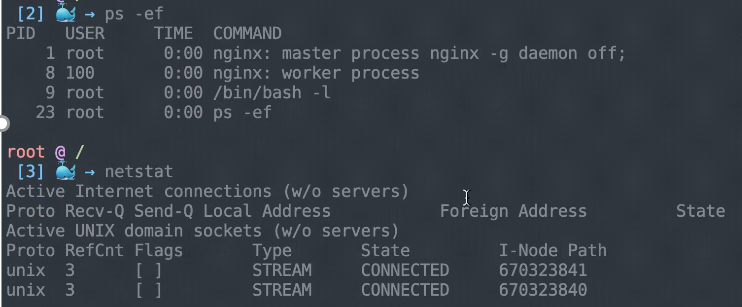
The kubectl-debug command shuts down the debug pod when the user logs out, which does not affect the application. This allows diagnosing a container without actually logging on to it.

Also, customize a command-line tool (CLI) by configuring images with htop for remote pod debugging.
This article describes the liveness and readiness probes. The liveness probe checks whether a pod is alive, whereas the readiness probe checks whether a pod is ready to provide external services. It outlines the steps to diagnose an application:
(1) Describe the application status.
(2) Determine the diagnosis plan based on the application status.
(3) Obtain more details based on the object event.
Moreover, it suggests how to implement the remote debugging strategy. It explains how to use Telepresence to configure a proxy in a remote cluster for a local application or use the port-forward mode to configure a local proxy for a remote application for local calling or debugging.
Getting Started with Kubernetes | Observability: Monitoring and Logging

673 posts | 56 followers
FollowAlibaba Cloud Native - April 28, 2022
Alibaba Developer - April 7, 2020
Alibaba Cloud Native - March 6, 2024
Alibaba Container Service - March 12, 2024
Alibaba Container Service - May 23, 2025
Alibaba Cloud Native Community - November 24, 2025

673 posts | 56 followers
Follow Container Service for Kubernetes
Alibaba Cloud Container Service for Kubernetes is a fully managed cloud container management service that supports native Kubernetes and integrates with other Alibaba Cloud products.
Learn More ACK One
Provides a control plane to allow users to manage Kubernetes clusters that run based on different infrastructure resources
Learn More Container Compute Service (ACS)
A cloud computing service that provides container compute resources that comply with the container specifications of Kubernetes
Learn More Cloud-Native Applications Management Solution
Accelerate and secure the development, deployment, and management of containerized applications cost-effectively.
Learn MoreMore Posts by Alibaba Cloud Native Community