By Hang Yin
A zone-level fault is an extreme type of fault that may occur in the cloud. When a zone fails, workloads in the failed zone are subject to risks such as unavailability, inaccessibility, or data errors. These include workloads deployed by users and workloads managed by cloud service providers. The causes of zone-level faults include but are not limited to:
• Power supply issues: Regional power outages affect the entire zone, which may cause service disruptions and workload unavailability.
• Infrastructure failures: Failures of critical network devices and the cooling system, or excessive load may cause the workload to be unavailable or in a degraded state (such as high latency and continuous return of 5xx status code).
• Resource problems: For example, the file system has no more available space. This may result in logical errors in the application or a degraded state.
• Human causes: Misoperations made by the IDC administrator or operator.
When a zone fails, we mainly need to consider the disaster recovery of the cloud service infrastructure and that of the business application itself. ASM combined with Container Service for Kubernetes can perfectly deal with these two situations:
1. Multi-zone high availability of Alibaba Cloud-managed components
All managed components of ACK and ASM adopt a deployment strategy of multiple replicas evenly distributed across multiple zones. This ensures that the cluster and the service mesh control plane can still provide services when a single zone fails. WorkerNode and elastic container instances in the cluster are also distributed in different zones. When zone-level faults occur, such as power outages or network disruptions in the data center caused by uncontrollable factors, healthy zones can still provide services.
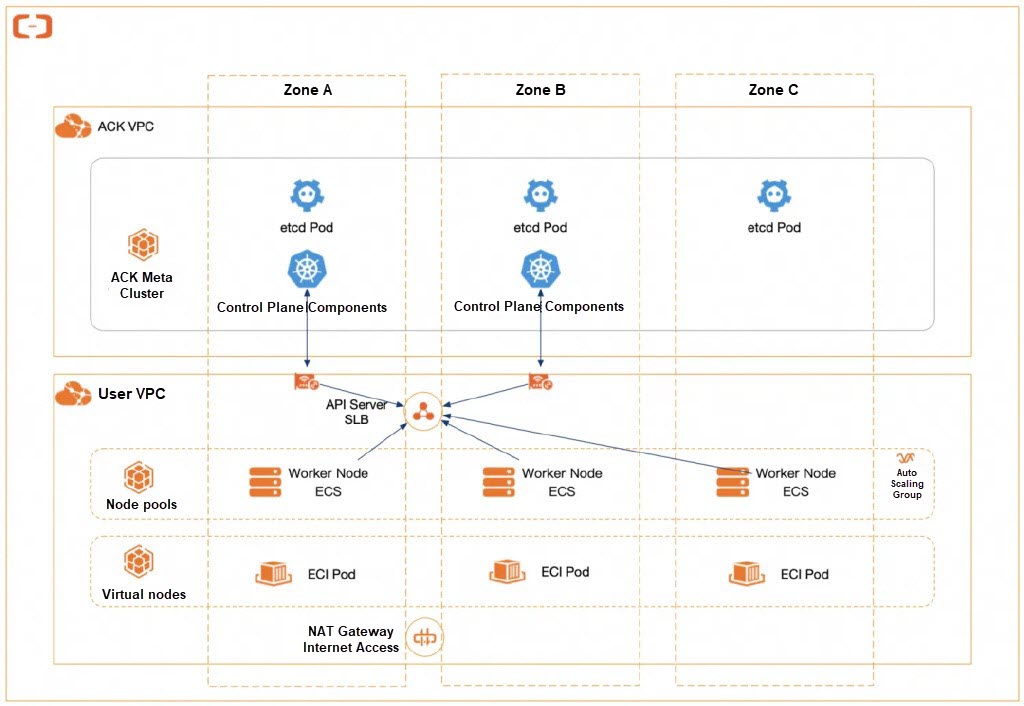
By using ACK and ASM, you can ensure the availability of the managed infrastructure in the event of zone-level faults. Next, you only need to consider how to design a fault prevention solution for the application itself.
2. Use the cluster high availability configuration and service mesh to cope with zone-level faults of applications
To handle zone-level faults, the first step is to evenly deploy application workloads in different zones.
ACK supports multi-zone node pools. When you create or run a node pool, we recommend that you select vSwitches residing in different zones for the node pool, and set Scaling Policy to Distribution Balancing. This way, ECS instances can be spread across the zones (vSwitches in the VPC) of the scaling group. Furthermore, based on the auto scaling of nodes, deployment set, multi-zone distribution, and other means, combined with the topology spread constraints in Kubernetes scheduling, the workload can be evenly deployed in different zones. For more information, see Suggested configurations for creating HA clusters.
After the application is deployed in multiple zones, you need to check the health status of Kubernetes applications and clusters in a timely and effective manner at runtime to detect zone failures and quickly respond to disaster recovery.
• Service mesh technology can help improve the network observability of the system. The data plane proxy of the service mesh exposes key metrics related to network requests and application service interactions. These metrics signal a variety of problems, including the monitoring metric content of specific zones. The observability information can be combined to help identify zone failures.
• When a zone-level fault occurs, ASM also supports using zone traffic redirection capabilities combined with those of load balancing for disaster recovery: When a zone is unavailable, you can configure zone transfer after receiving relevant alert information to temporarily redirect network traffic in the cluster from the affected zone. When the zone returns to a healthy state, you can also resume traffic management for that zone.
When dealing with zone-level faults, a series of practical measures are often involved, including:
• Evenly deploy across multiple zones and carry out operations in each zone.
• Observe service metrics and detect faults.
• When a zone fails, quickly divert the traffic from the affected zone (manually or automatically) to recover from the failure. This mainly involves the following aspects:
As shown in the following figure, to cope with multi-zone level failures, you need to prepare an ACK cluster with multi-zone worker nodes and evenly deploy workloads in multiple zones. In addition, you can collect control plane logs of ACK clusters and ASM instances as well as cluster events to Simple Log Service. You can also use ACK clusters and ASM instances to collect metrics related to nodes, containers, and services to Managed Service for Prometheus. This way, you can observe fault events of different levels and view the service status in the clusters through logs and Grafana dashboards. We recommend that you use a load balancer with a multi-zone deployment mechanism (such as NLB and ALB) as the ingress traffic handler.
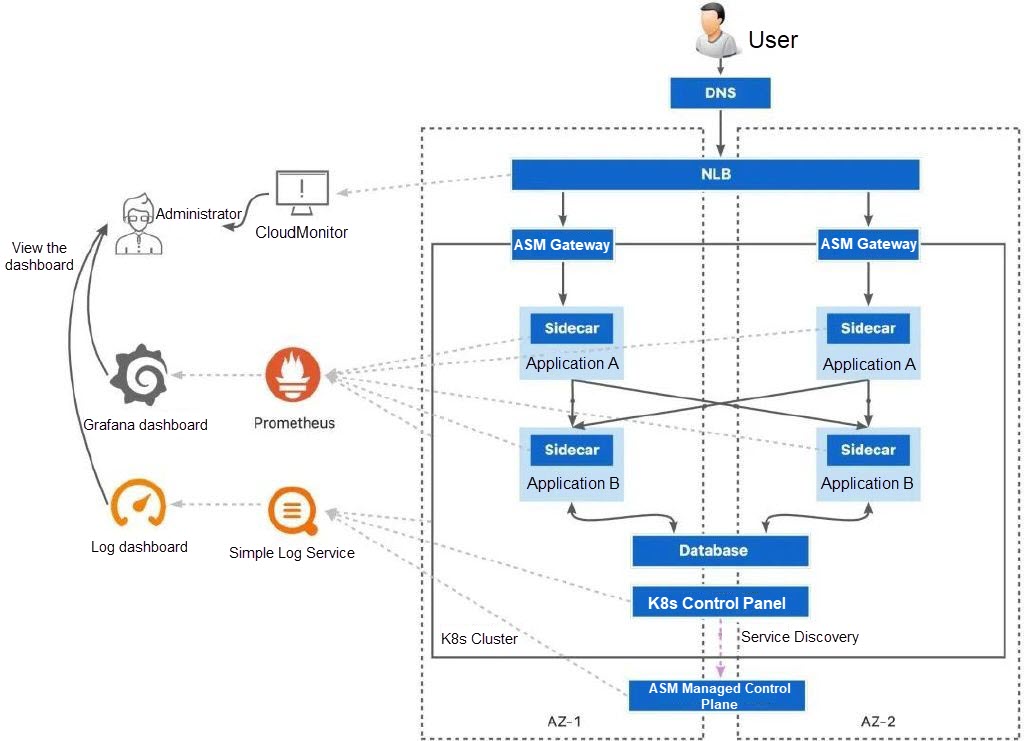
When an application in a zone fails, the fault can be handled in different ways depending on the severity of the fault.
A critical fault is a failure mode that can be directly discovered through a cluster event or health check.
When a critical fault occurs, workloads running in the Kubernetes cluster change to the Unhealthy state due to the health check failure or change to the Unknown state because of the unavailability of nodes in the zone. The health check of the gateway workload at the ingress of the cluster by the load balancer also fails. The load balancer will remove the workload in the failed zone from the backend server group to achieve fault recovery.
Meanwhile, the preset alert contact (possibly an administrator) will receive an alert message and can obtain the failure information from Kubernetes events, CloudMonitor alerts, and other channels to help confirm the status of unavailable zones.
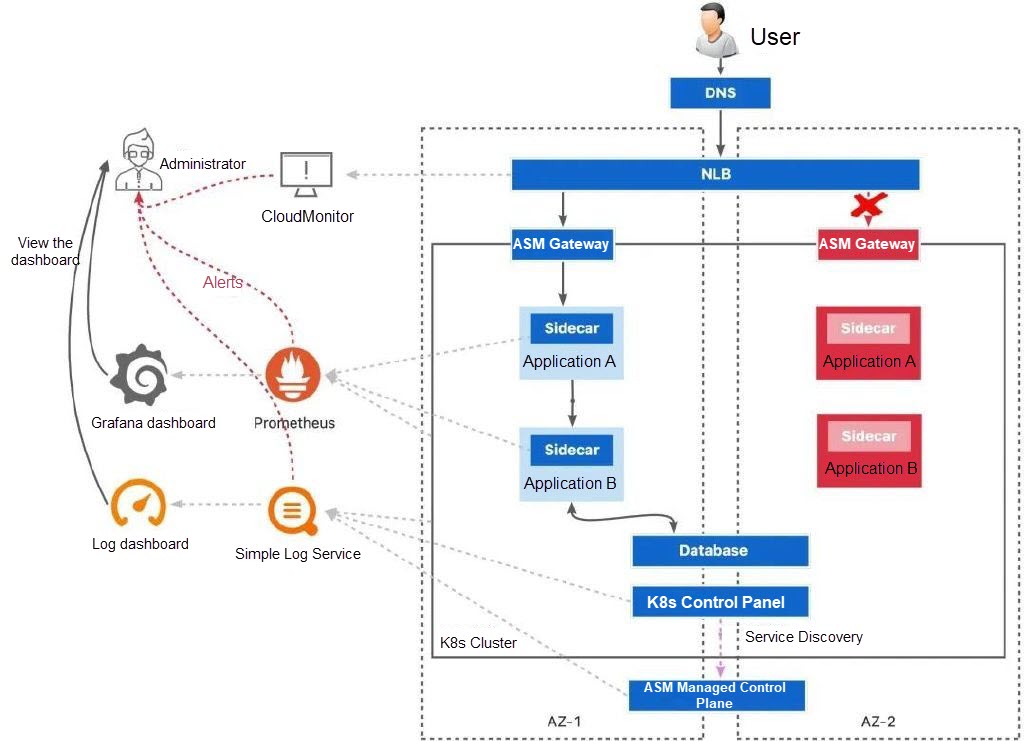
Health checks are fast and effective in identifying detectable hardware faults or software problems, such as network hardware faults, application listening cessation, and data center faults.
However, even with an in-depth health check, there may still be some ambiguous or intermittent gray fault modes that are difficult to detect. For example, after a regional deployment, a replica might respond to a probe and appear healthy, but it actually has functional defects that affect customers. Alternatively, the inventory in the zone lacks a specific type of device, which prevents the workloads in the zone from being able to handle the actual business logic. There may also be subtle infrastructure issues in the zone, such as packet loss or intermittent dependency failures, which can lead to slower responses but the zone still passes the health check.
When a gray fault occurs, you can use the DNS removal capability of NLB and ALB and the zone transfer capability of ASM to temporarily redirect network traffic in the cluster away from the affected zone. You can also investigate the application in the affected zone while the service remains available to confirm the cause of the fault. When the zone returns to a healthy state, you can resume traffic management for that zone.
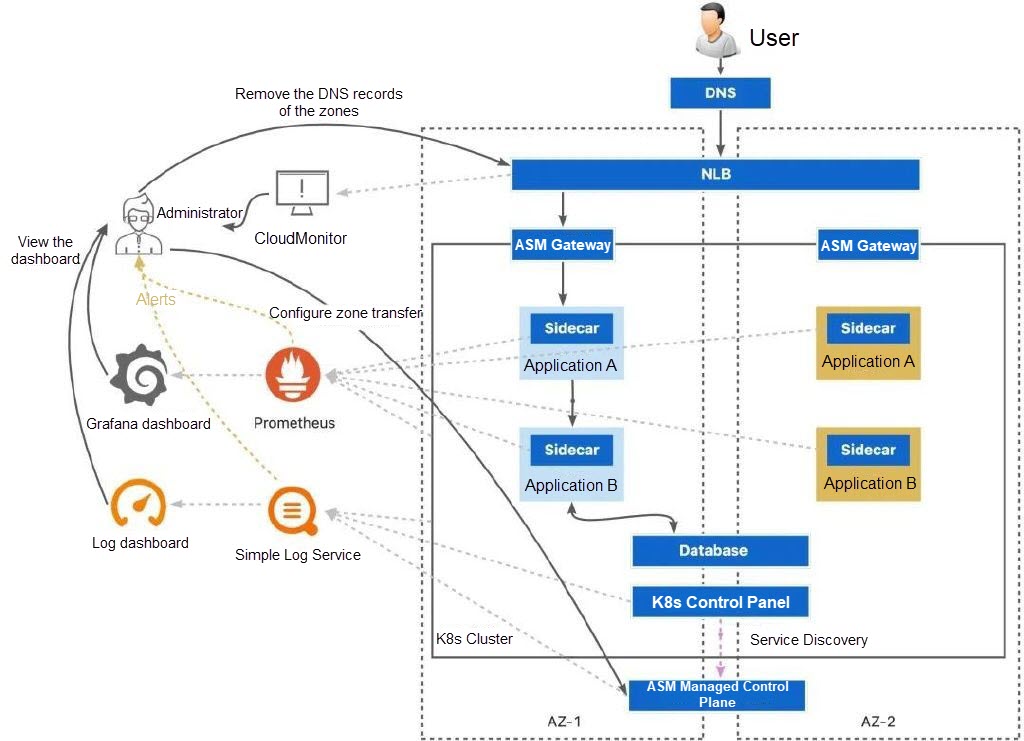
In the example, we create a cluster that contains multiple zones to rehearse disaster recovery for zone-level faults. In best practices, it is recommended to create multiple ACK clusters with multiple zones in multiple regions to cope with larger region-level faults and minimize the impact. In this example, we mainly focus on a single cluster perspective with multiple zones.
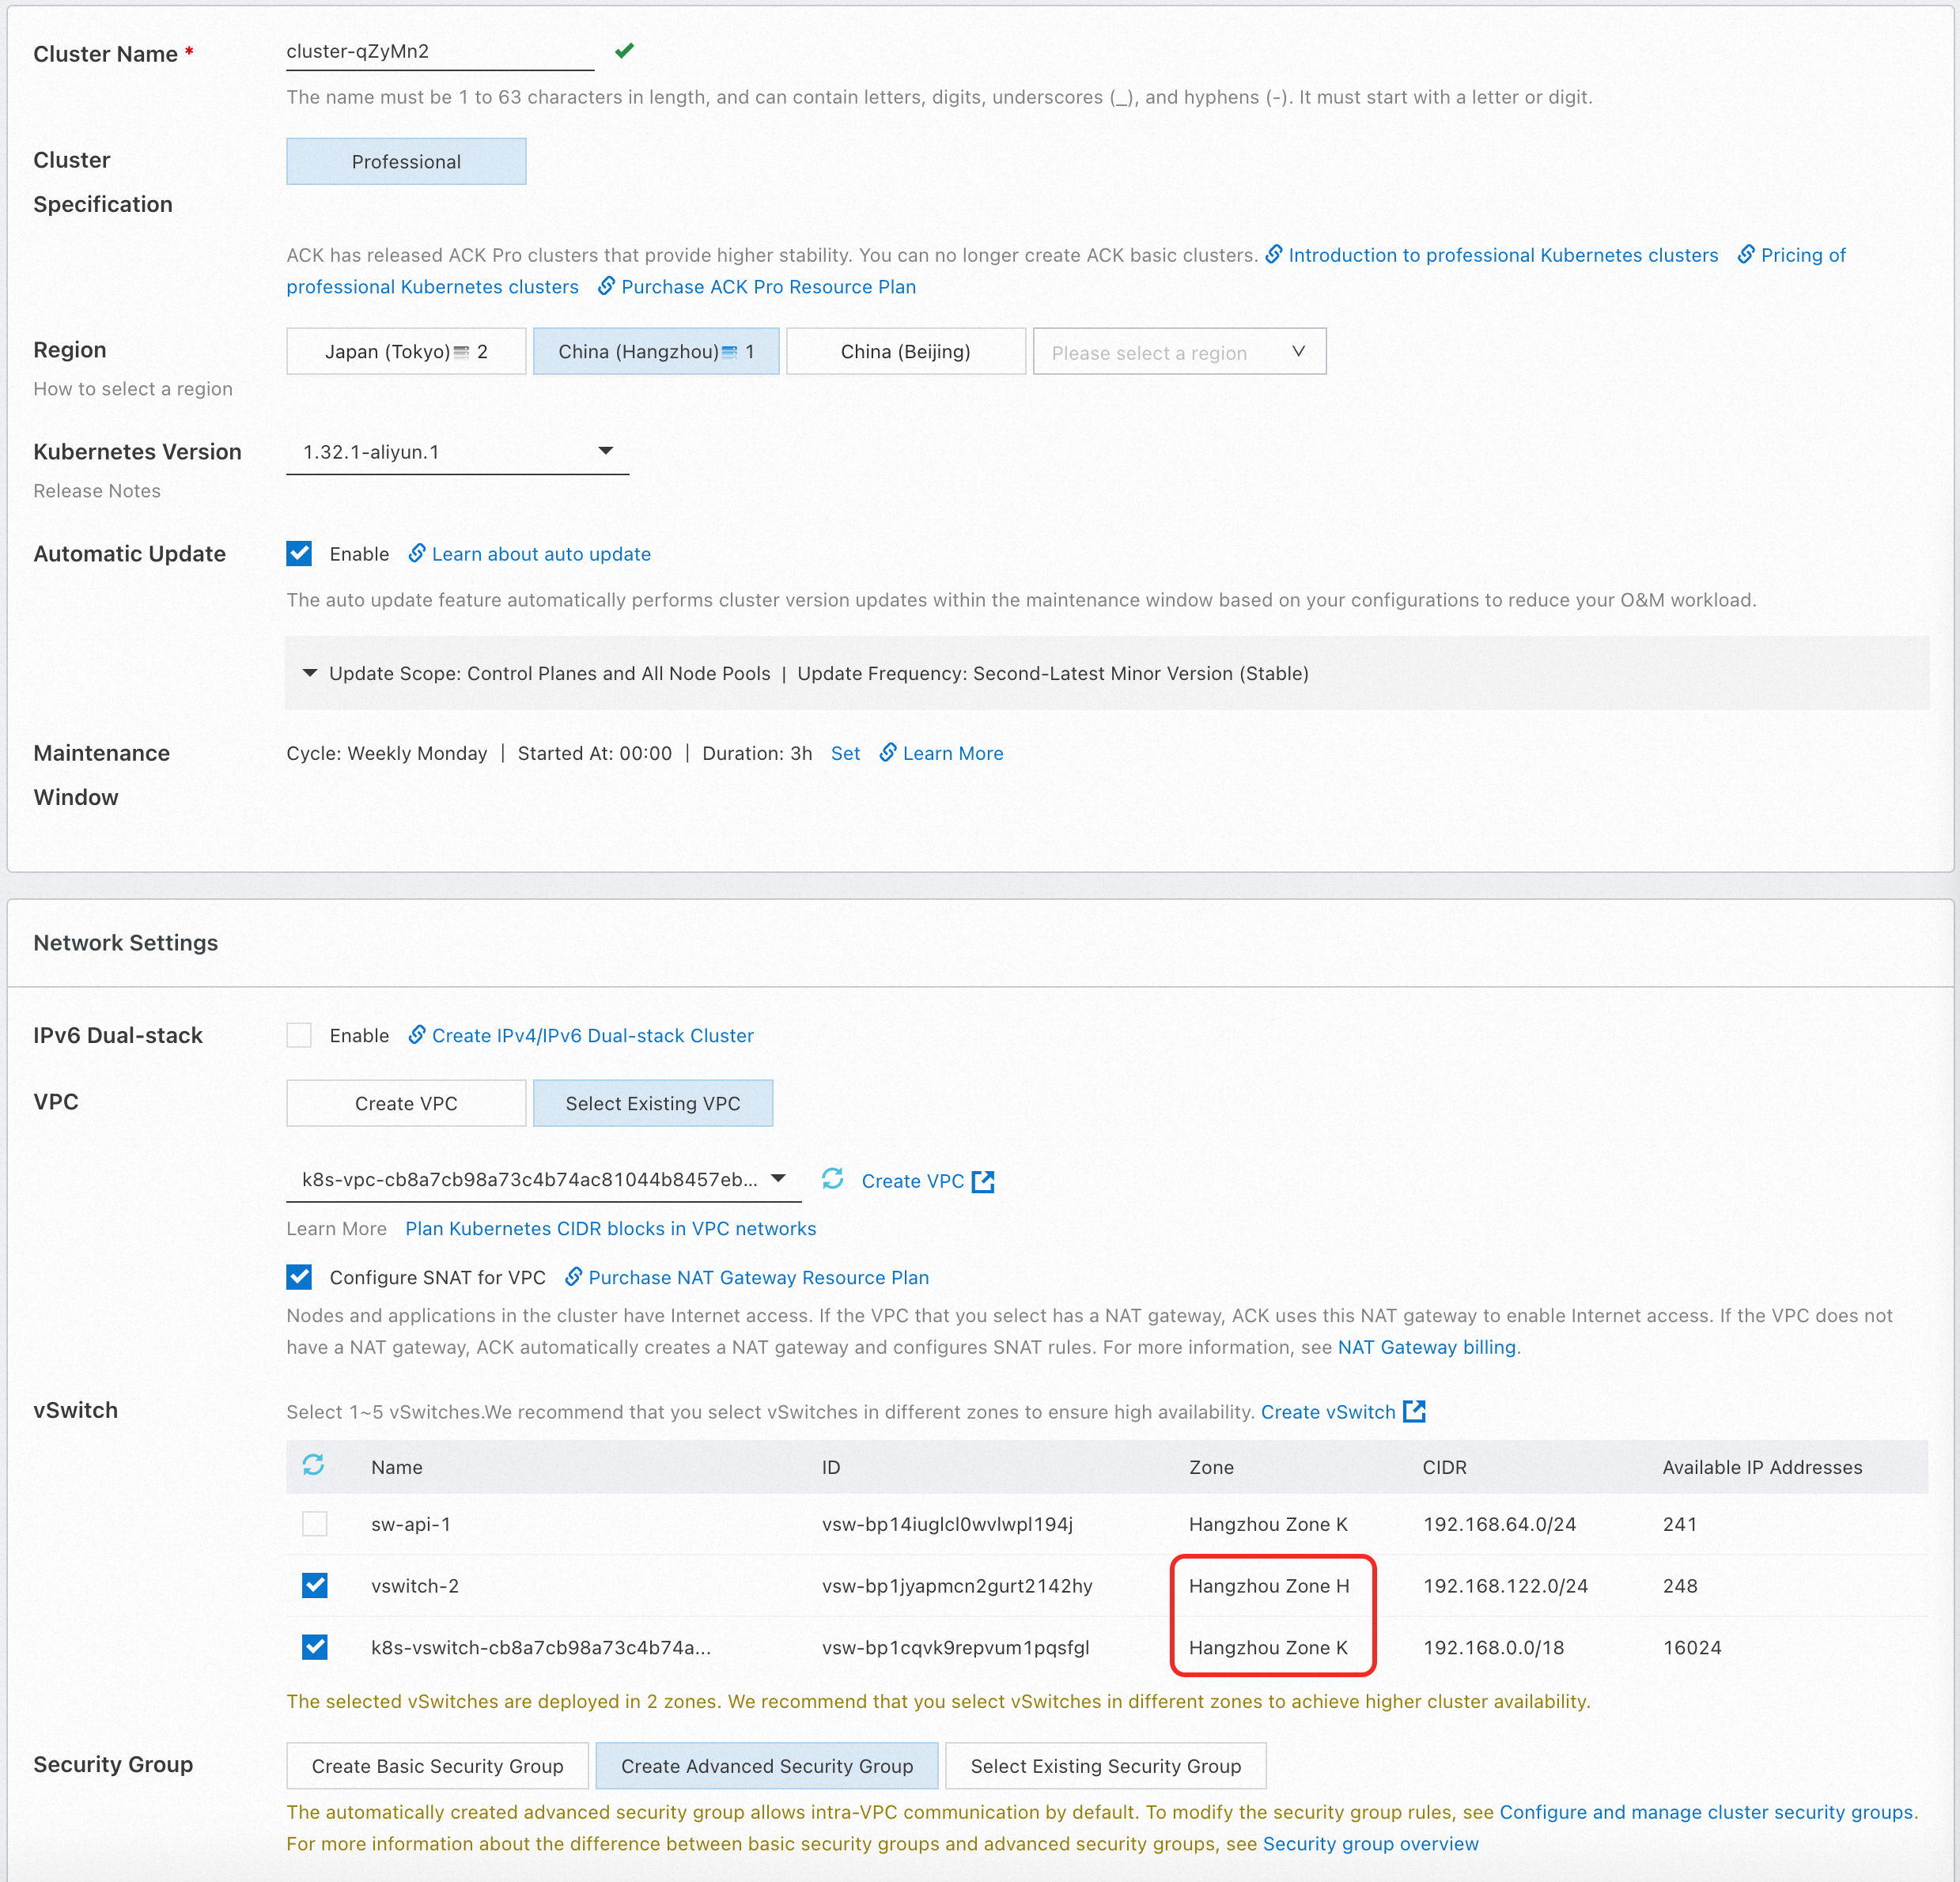
Create an ACK managed cluster. When you create a cluster, select vSwitches from multiple zones to support the multi-zone deployment feature of the cluster. Keep the default settings for other configurations. The node pool uses the evenly distributed scaling policy by default.
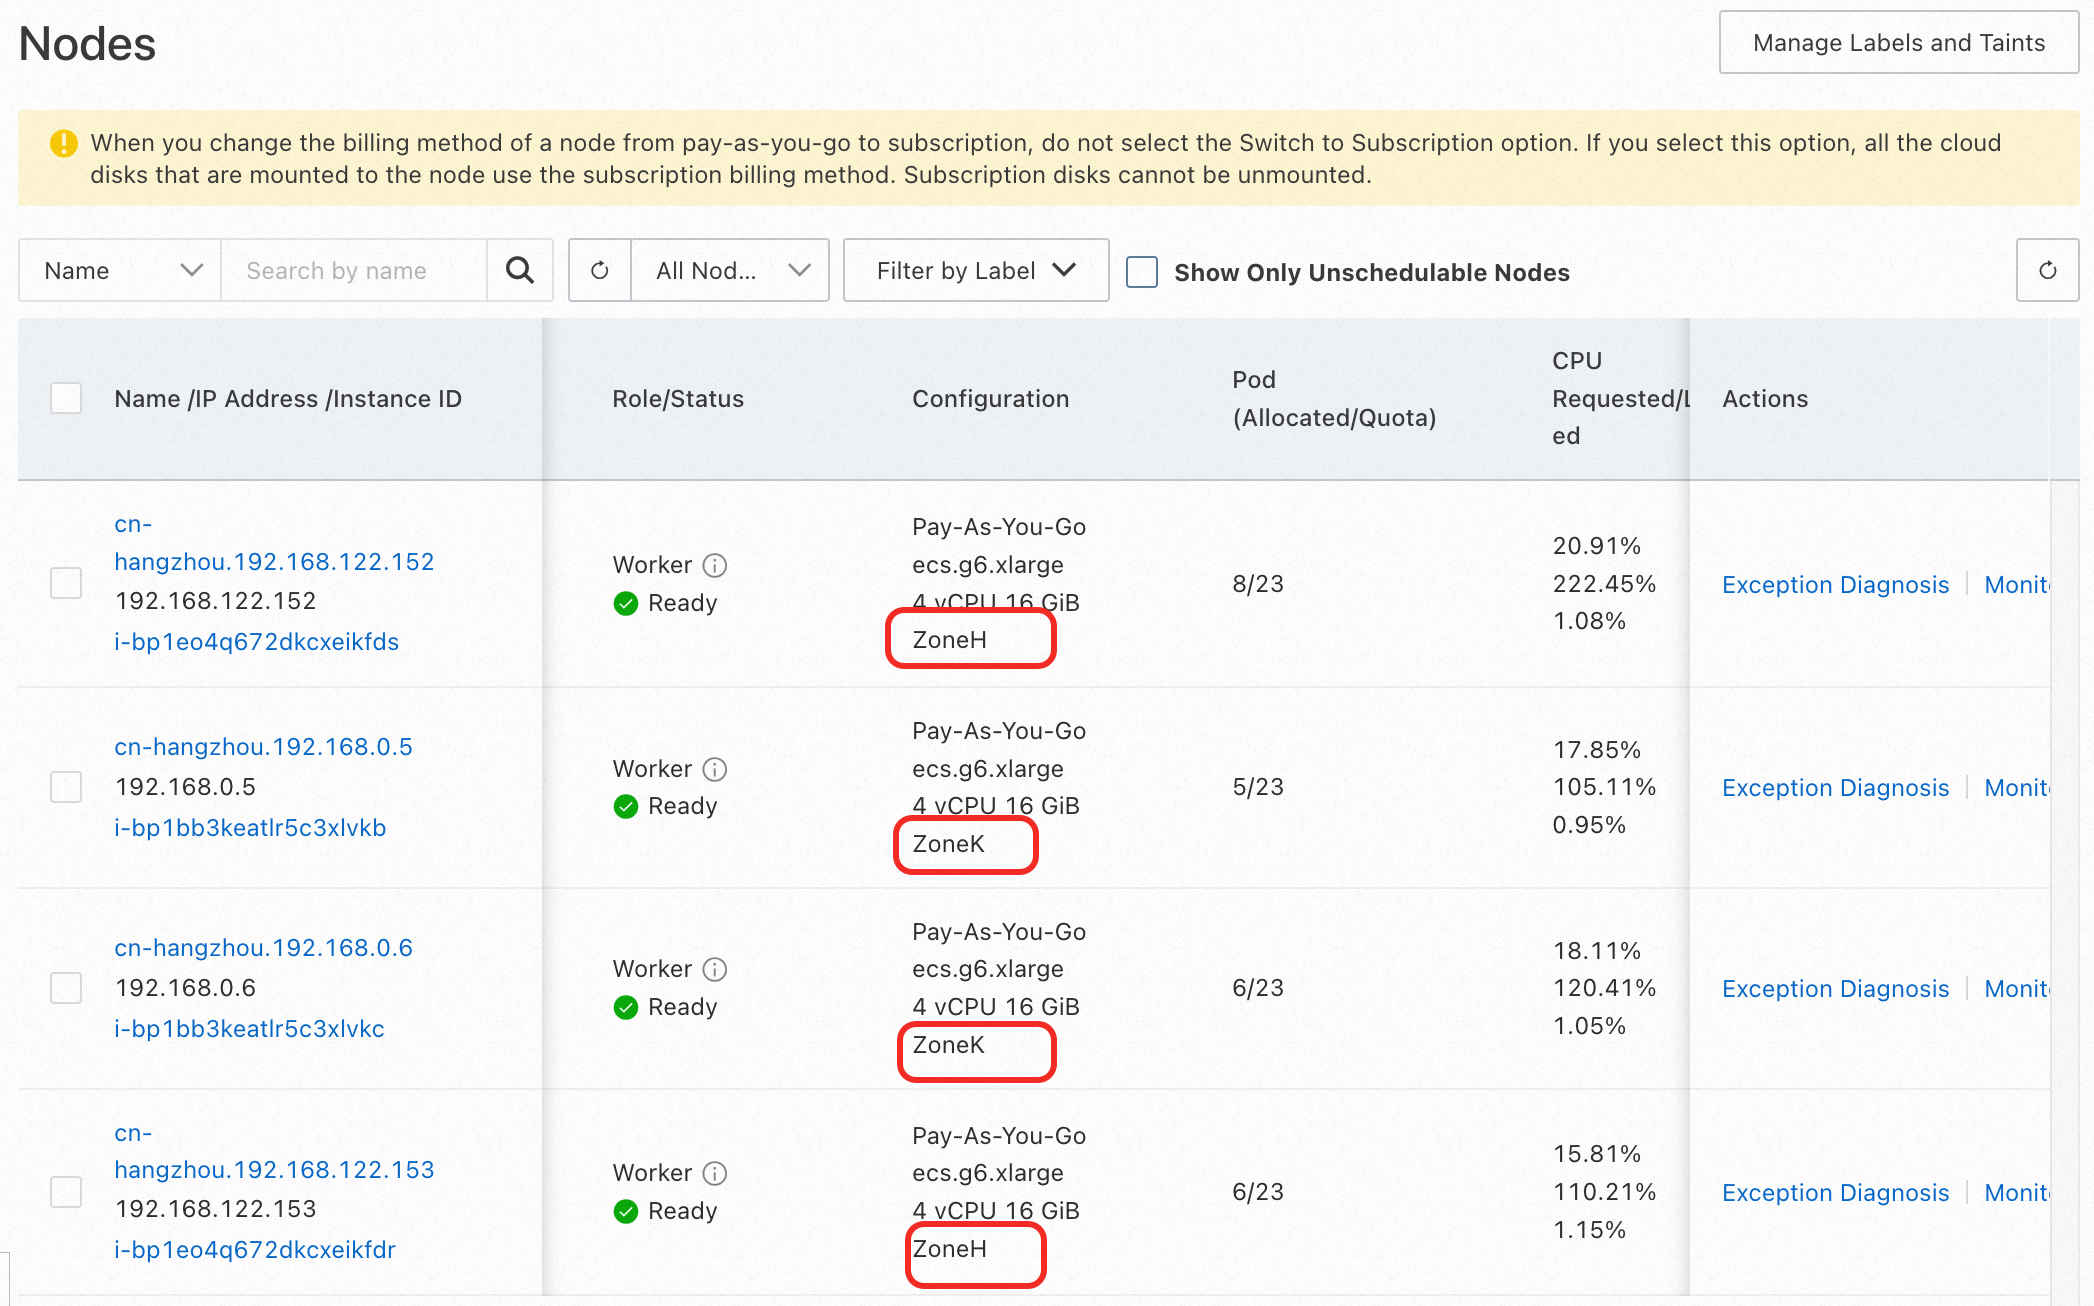
After the cluster is created, you can find that the newly added nodes are evenly distributed in the two selected zones:
Create an ASM instance in the service mesh console. When you create a cluster, select Add the newly created cluster from the Kubernetes cluster options. At the vSwitch, select two vSwitches in different zones.

Click Create service mesh and wait until the service mesh is created.
1) Refer to Associate an NLB instance with an ingress gateway to bind an ASM gateway with an NLB instance in the ASM instance. Select the same two zones as those of the ASM instance and the ACK cluster for the NLB instance (in this example, cn-hangzhou-k and cn-hangzhou-h).
In this example, the ASM gateway associated with the NLB instance is used as the traffic ingress. You can also use an ALB instance as the traffic ingress for your application. The ALB instance also provides multi-zone disaster recovery and DNS removal capabilities.
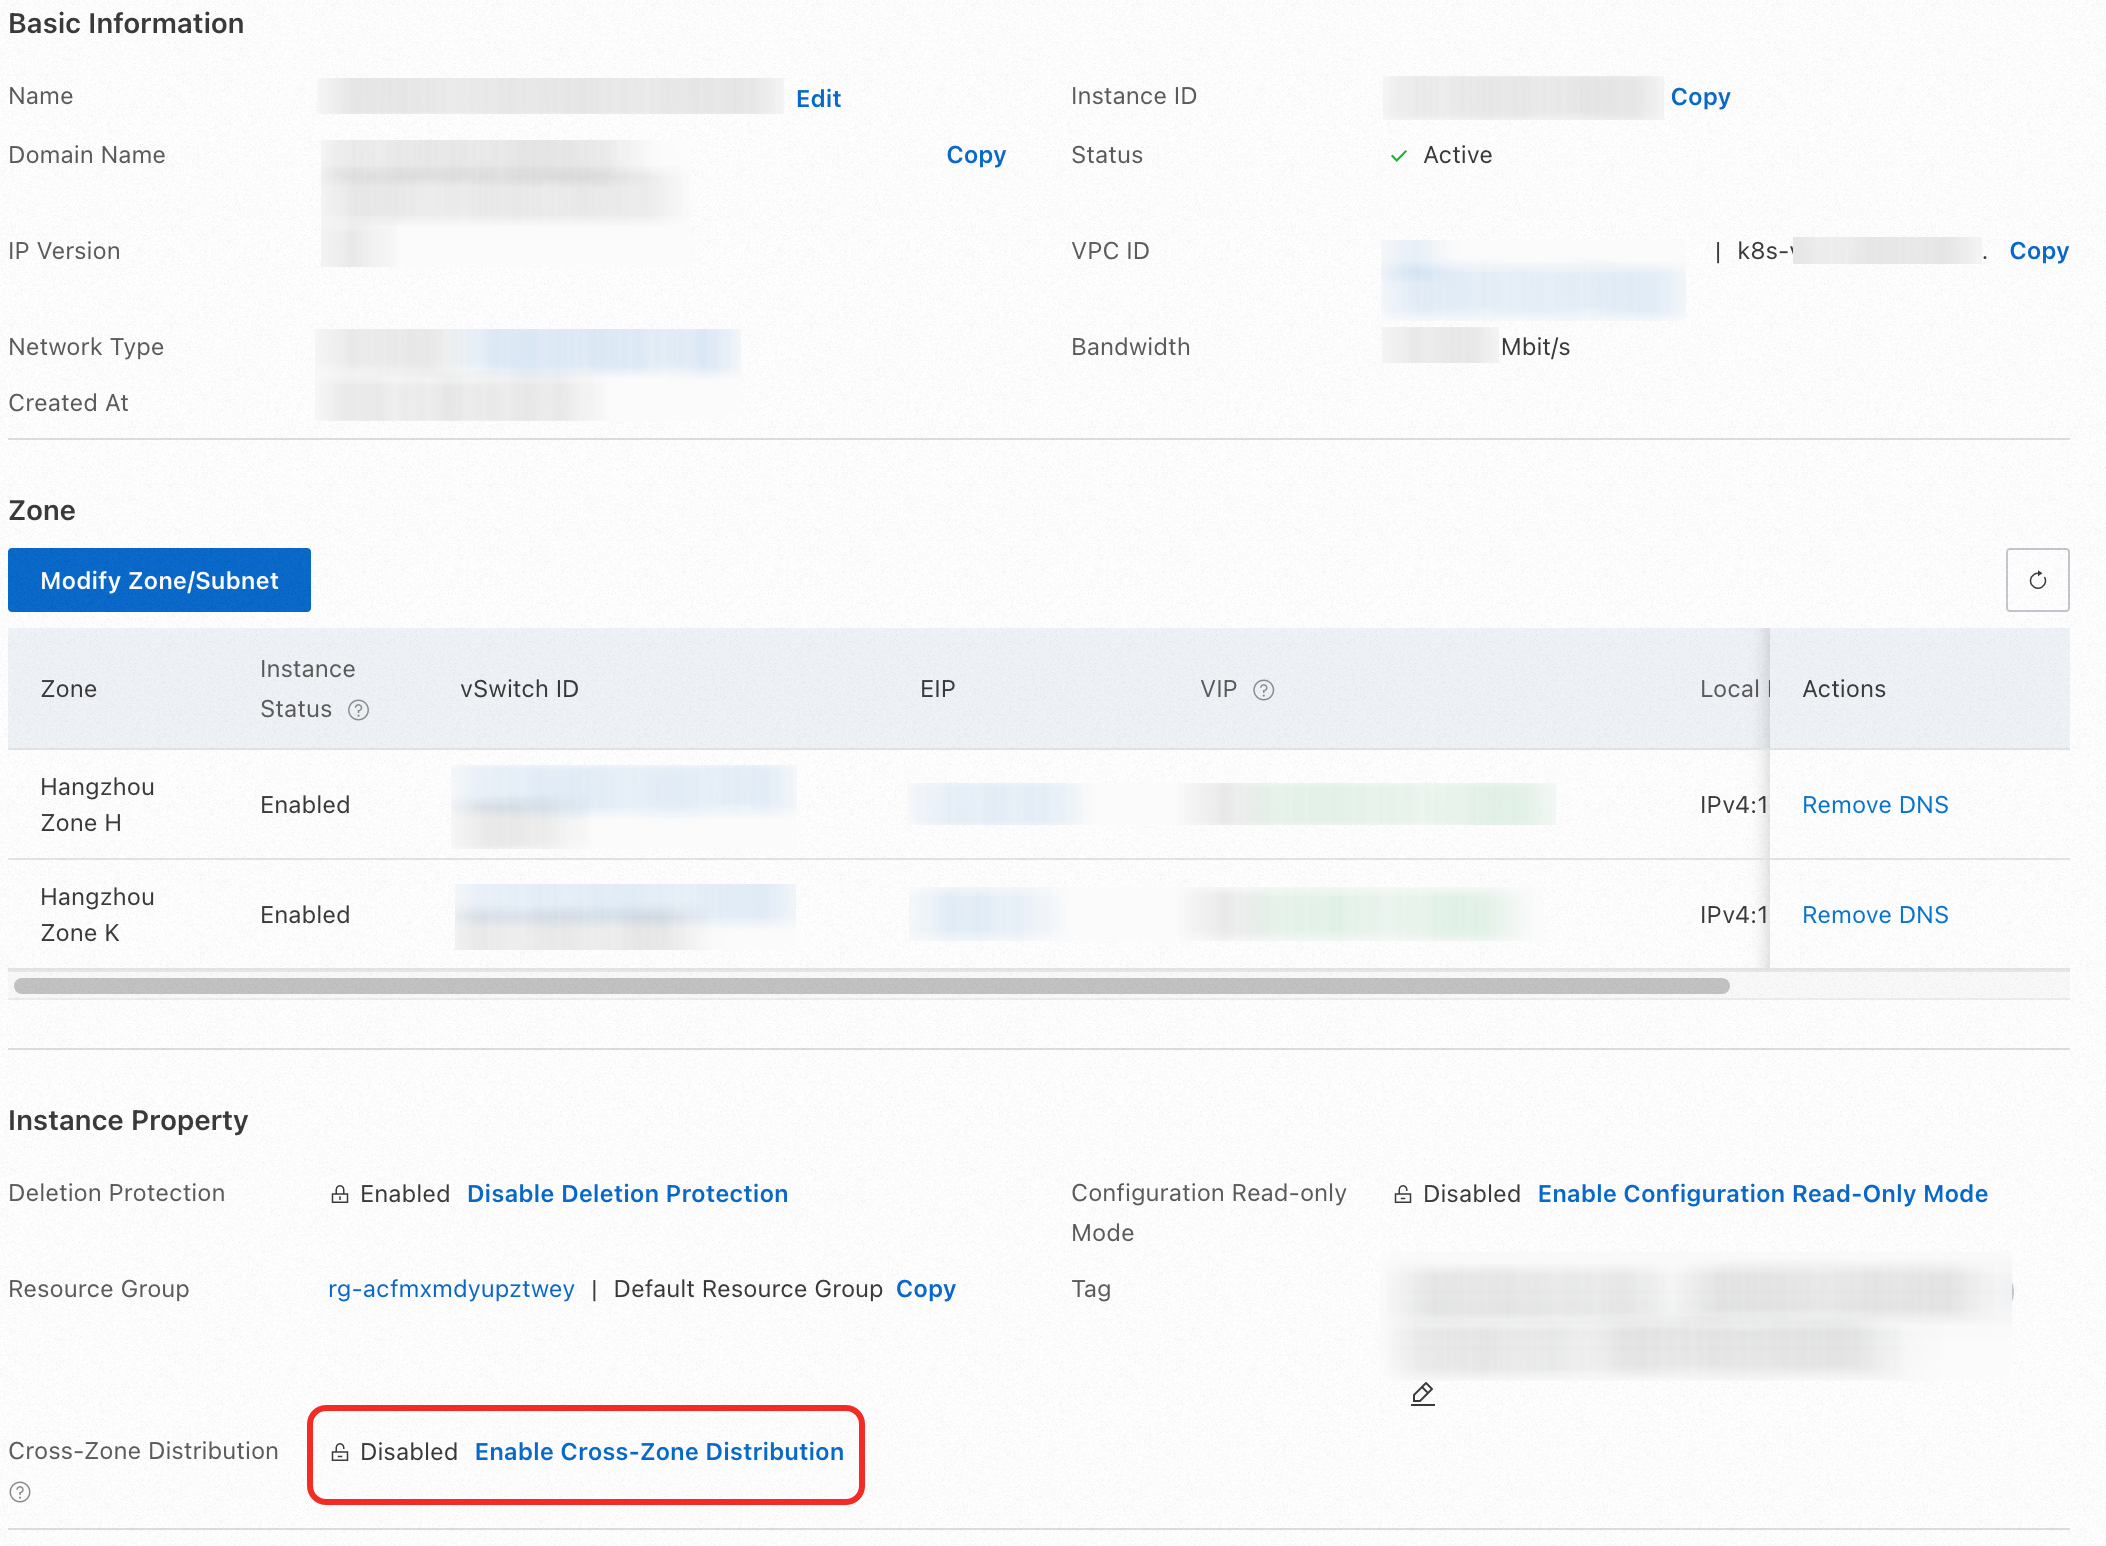
After you create an NLB instance, you should disable the cross-zone forwarding capability of the NLB instance so that the instance in each zone forwards traffic only to the backend in the zone. With this configuration, you can quickly redirect traffic at the traffic ingress when a zone-level fault occurs. Similarly, the ALB instance also supports the same intra-zone forwarding capability.
2) Enable automatic sidecar proxy injection for the namespace in the ASM instance by default. For more information, see Enable automatic sidecar proxy injection.
3) Use kubectl to connect to the ACK cluster. For more information, see Obtain the kubeconfig file of a cluster and use kubectl to connect to the cluster. Then, run the following command to deploy the sample application.
kubectl apply -f- <<EOF
apiVersion: v1
kind: Service
metadata:
  name: mocka
  labels:
    app: mocka
    service: mocka
spec:
  ports:
  - port: 8000
    name: http
  selector:
    app: mocka
---
apiVersion: apps/v1
kind: Deployment
metadata:
  name: mocka-cn-hangzhou-h
  labels:
    app: mocka
spec:
  replicas: 1
  selector:
    matchLabels:
      app: mocka
  template:
    metadata:
      labels:
        app: mocka
        locality: cn-hangzhou-h
    spec:
      nodeSelector:
        topology.kubernetes.io/zone: cn-hangzhou-h
      containers:
      - name: default
        image: registry-cn-hangzhou.ack.aliyuncs.com/ack-demo/go-http-sample:tracing
        imagePullPolicy: IfNotPresent
        env:
        - name: version
          value: cn-hangzhou-h
        - name: app
          value: mocka
        - name: upstream_url
          value: "http://mockb:8000/"
        ports:
        - containerPort: 8000
---
apiVersion: apps/v1
kind: Deployment
metadata:
  name: mocka-cn-hangzhou-k
  labels:
    app: mocka
spec:
  replicas: 1
  selector:
    matchLabels:
      app: mocka
  template:
    metadata:
      labels:
        app: mocka
        locality: cn-hangzhou-k
    spec:
      nodeSelector:
        topology.kubernetes.io/zone: cn-hangzhou-k
      containers:
      - name: default
        image: registry-cn-hangzhou.ack.aliyuncs.com/ack-demo/go-http-sample:tracing
        imagePullPolicy: IfNotPresent
        env:
        - name: version
          value: cn-hangzhou-k
        - name: app
          value: mocka
        - name: upstream_url
          value: "http://mockb:8000/"
        ports:
        - containerPort: 8000
---
apiVersion: v1
kind: Service
metadata:
  name: mockb
  labels:
    app: mockb
    service: mockb
spec:
  ports:
  - port: 8000
    name: http
  selector:
    app: mockb
---
apiVersion: apps/v1
kind: Deployment
metadata:
  name: mockb-cn-hangzhou-h
  labels:
    app: mockb
spec:
  replicas: 1
  selector:
    matchLabels:
      app: mockb
  template:
    metadata:
      labels:
        app: mockb
        locality: cn-hangzhou-h
    spec:
      nodeSelector:
        topology.kubernetes.io/zone: cn-hangzhou-h
      containers:
      - name: default
        image: registry-cn-hangzhou.ack.aliyuncs.com/ack-demo/go-http-sample:tracing
        imagePullPolicy: IfNotPresent
        env:
        - name: version
          value: cn-hangzhou-h
        - name: app
          value: mockb
        - name: upstream_url
          value: "http://mockc:8000/"
        ports:
        - containerPort: 8000
---
apiVersion: apps/v1
kind: Deployment
metadata:
  name: mockb-cn-hangzhou-k
  labels:
    app: mockb
spec:
  replicas: 1
  selector:
    matchLabels:
      app: mockb
  template:
    metadata:
      labels:
        app: mockb
        locality: cn-hangzhou-k
    spec:
      nodeSelector:
        topology.kubernetes.io/zone: cn-hangzhou-k
      containers:
      - name: default
        image: registry-cn-hangzhou.ack.aliyuncs.com/ack-demo/go-http-sample:tracing
        imagePullPolicy: IfNotPresent
        env:
        - name: version
          value: cn-hangzhou-k
        - name: app
          value: mockb
        - name: upstream_url
          value: "http://mockc:8000/"
        ports:
        - containerPort: 8000
---
apiVersion: v1
kind: Service
metadata:
  name: mockc
  labels:
    app: mockc
    service: mockc
spec:
  ports:
  - port: 8000
    name: http
  selector:
    app: mockc
---
apiVersion: apps/v1
kind: Deployment
metadata:
  name: mockc-cn-hangzhou-h
  labels:
    app: mockc
spec:
  replicas: 1
  selector:
    matchLabels:
      app: mockc
  template:
    metadata:
      labels:
        app: mockc
        locality: cn-hangzhou-h
    spec:
      nodeSelector:
        topology.kubernetes.io/zone: cn-hangzhou-h
      containers:
      - name: default
        image: registry-cn-hangzhou.ack.aliyuncs.com/ack-demo/go-http-sample:tracing
        imagePullPolicy: IfNotPresent
        env:
        - name: version
          value: cn-hangzhou-h
        - name: app
          value: mockc
        ports:
        - containerPort: 8000
---
apiVersion: apps/v1
kind: Deployment
metadata:
  name: mockc-cn-hangzhou-k
  labels:
    app: mockc
spec:
  replicas: 1
  selector:
    matchLabels:
      app: mockc
  template:
    metadata:
      labels:
        app: mockc
        locality: cn-hangzhou-k
    spec:
      nodeSelector:
        topology.kubernetes.io/zone: cn-hangzhou-k
      containers:
      - name: default
        image: registry-cn-hangzhou.ack.aliyuncs.com/ack-demo/go-http-sample:tracing
        imagePullPolicy: IfNotPresent
        env:
        - name: version
          value: cn-hangzhou-k
        - name: app
          value: mockc
        ports:
        - containerPort: 8000
---
apiVersion: networking.istio.io/v1beta1
kind: Gateway
metadata:
  name: mocka
  namespace: default
spec:
  selector:
    istio: ingressgateway
  servers:
    - hosts:
        - '*'
      port:
        name: test
        number: 80
        protocol: HTTP
---
apiVersion: networking.istio.io/v1beta1
kind: VirtualService
metadata:
  name: demoapp-vs
  namespace: default
spec:
  gateways:
    - mocka
  hosts:
    - '*'
  http:
    - name: test
      route:
        - destination:
            host: mocka
            port:
              number: 8000
EOF
This command deploys an application that includes services named mocka, mockb, and mockc. Each service contains two stateless deployments with only one replica. They are distributed to nodes in different zones through different nodeSelectors and return their own zones by configuring environment variables.
In this example, the nodeSelector field of the pod manually selects the zone where the pod is located. This is for the purpose of intuitive demonstration. In the actual construction of a high-availability environment, you should configure topology spread constraints to ensure that pods are distributed in different zones as much as possible.
For more information, see Workload HA configuration.
A sound observation system is an indispensable part of disaster recovery. When a fault occurs, observability information such as logs and metrics related to the workload and relevant alerts can help us detect the fault as soon as possible, determine the scope of the fault, and initially know about the impact and the cause of the fault.
The service mesh supports the continuous reporting of access logs and request metrics for all requests sent and received by services running in the cluster. It can summarize the information related to the request such as response code, latency, and request size. When a gray fault occurs in a zone, the request-related metrics and alert configurations provided by the service mesh can form a useful reference for determining the fault scope and fault symptoms. This example describes how to view service traffic-related metrics reported by the service mesh. For more information about cluster workload-related metrics and alert configurations, see Configure alert rules in Managed Service for Prometheus and view performance metrics, Alert management, and Event monitoring.
The service mesh proxy can automatically detect the zone where the workload is deployed and store it in the proxy metadata. You can edit the metric dimension to add the locality dimension to the service mesh metric and set the value to xds.node.locality.zone, which is the zone where the workload is located.
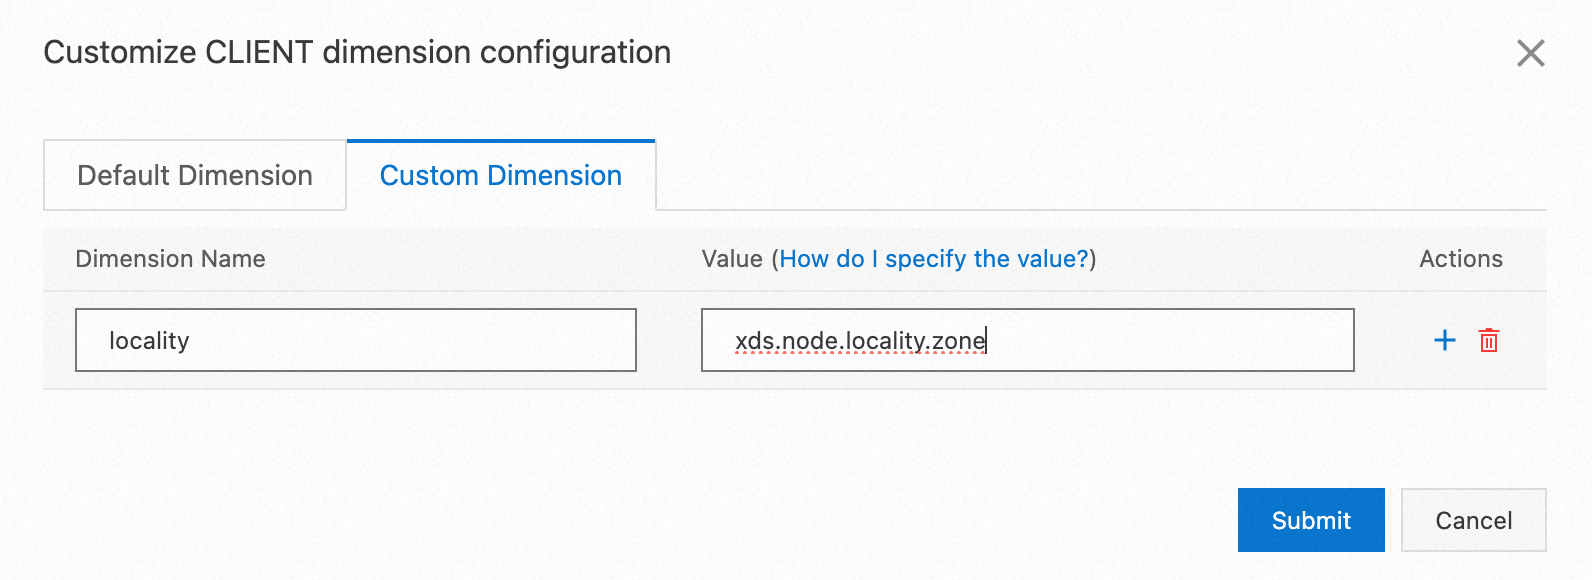
In this way, a new locality dimension representing the zone is added to the metrics reported by the service mesh to Prometheus without additional configuration of the application. For more information about editing a metric dimension, see Configure observability settings.
Continue to send requests to the sample application through the curl tool. Replace nlb-xxxxxxxxxxxxx.cn-xxxxxxx.nlb.aliyuncsslb.com with the domain name of the NLB instance associated with the gateway created in Step 1.
watch -n 0.1 curl nlb-xxxxxxxxxxxxx.cn-xxxxxxx.nlb.aliyuncsslb.com/mock -vExpected output:
> GET /mock HTTP/1.1
> Host: nlb-85h289ly4hz9qhaz58.cn-hangzhou.nlb.aliyuncsslb.com
> User-Agent: curl/8.7.1
> Accept: */*
>
* Request completely sent off
< HTTP/1.1 200 OK
< date: Sun, 08 Dec 2024 11:53:26 GMT
< content-length: 150
< content-type: text/plain; charset=utf-8
< x-envoy-upstream-service-time: 5
< server: istio-envoy
<
* Connection #0 to host nlb-85h289ly4hz9qhaz58.cn-hangzhou.nlb.aliyuncsslb.com left intact
-> mocka(version: cn-hangzhou-h, ip: 192.168.122.66)-> mockb(version: cn-hangzhou-k, ip: 192.168.0.47)-> mockc(version: cn-hangzhou-h, ip: 192.168.122.44)%
As you can see from the expected output, the requested pods are randomly distributed to two different zones. In this case, it means that the workloads in both zones are available.
The metrics generated by the service mesh can be collected to various observability systems. Together with cluster monitoring, the metrics visually observe various potential problems in zones. In this example, by collecting the metrics to the Alibaba Cloud Managed Service for Prometheus, you can view the key information about the requests received by workloads in the zone. For more information, see Collect metrics to Managed Service for Prometheus.
After continuously sending requests for a period of time, we can explore metrics in Managed Service for Prometheus. For more information, see Metric exploration.
In a Prometheus instance, you can use the following PromQL statement to query the rate at which requests are received by workloads in a specified zone. The requests are grouped by service name and response code.
sum by(app, response_code) (rate(istio_requests_total{locality="cn-hangzhou-h", reporter="destination"}[$__rate_interval]))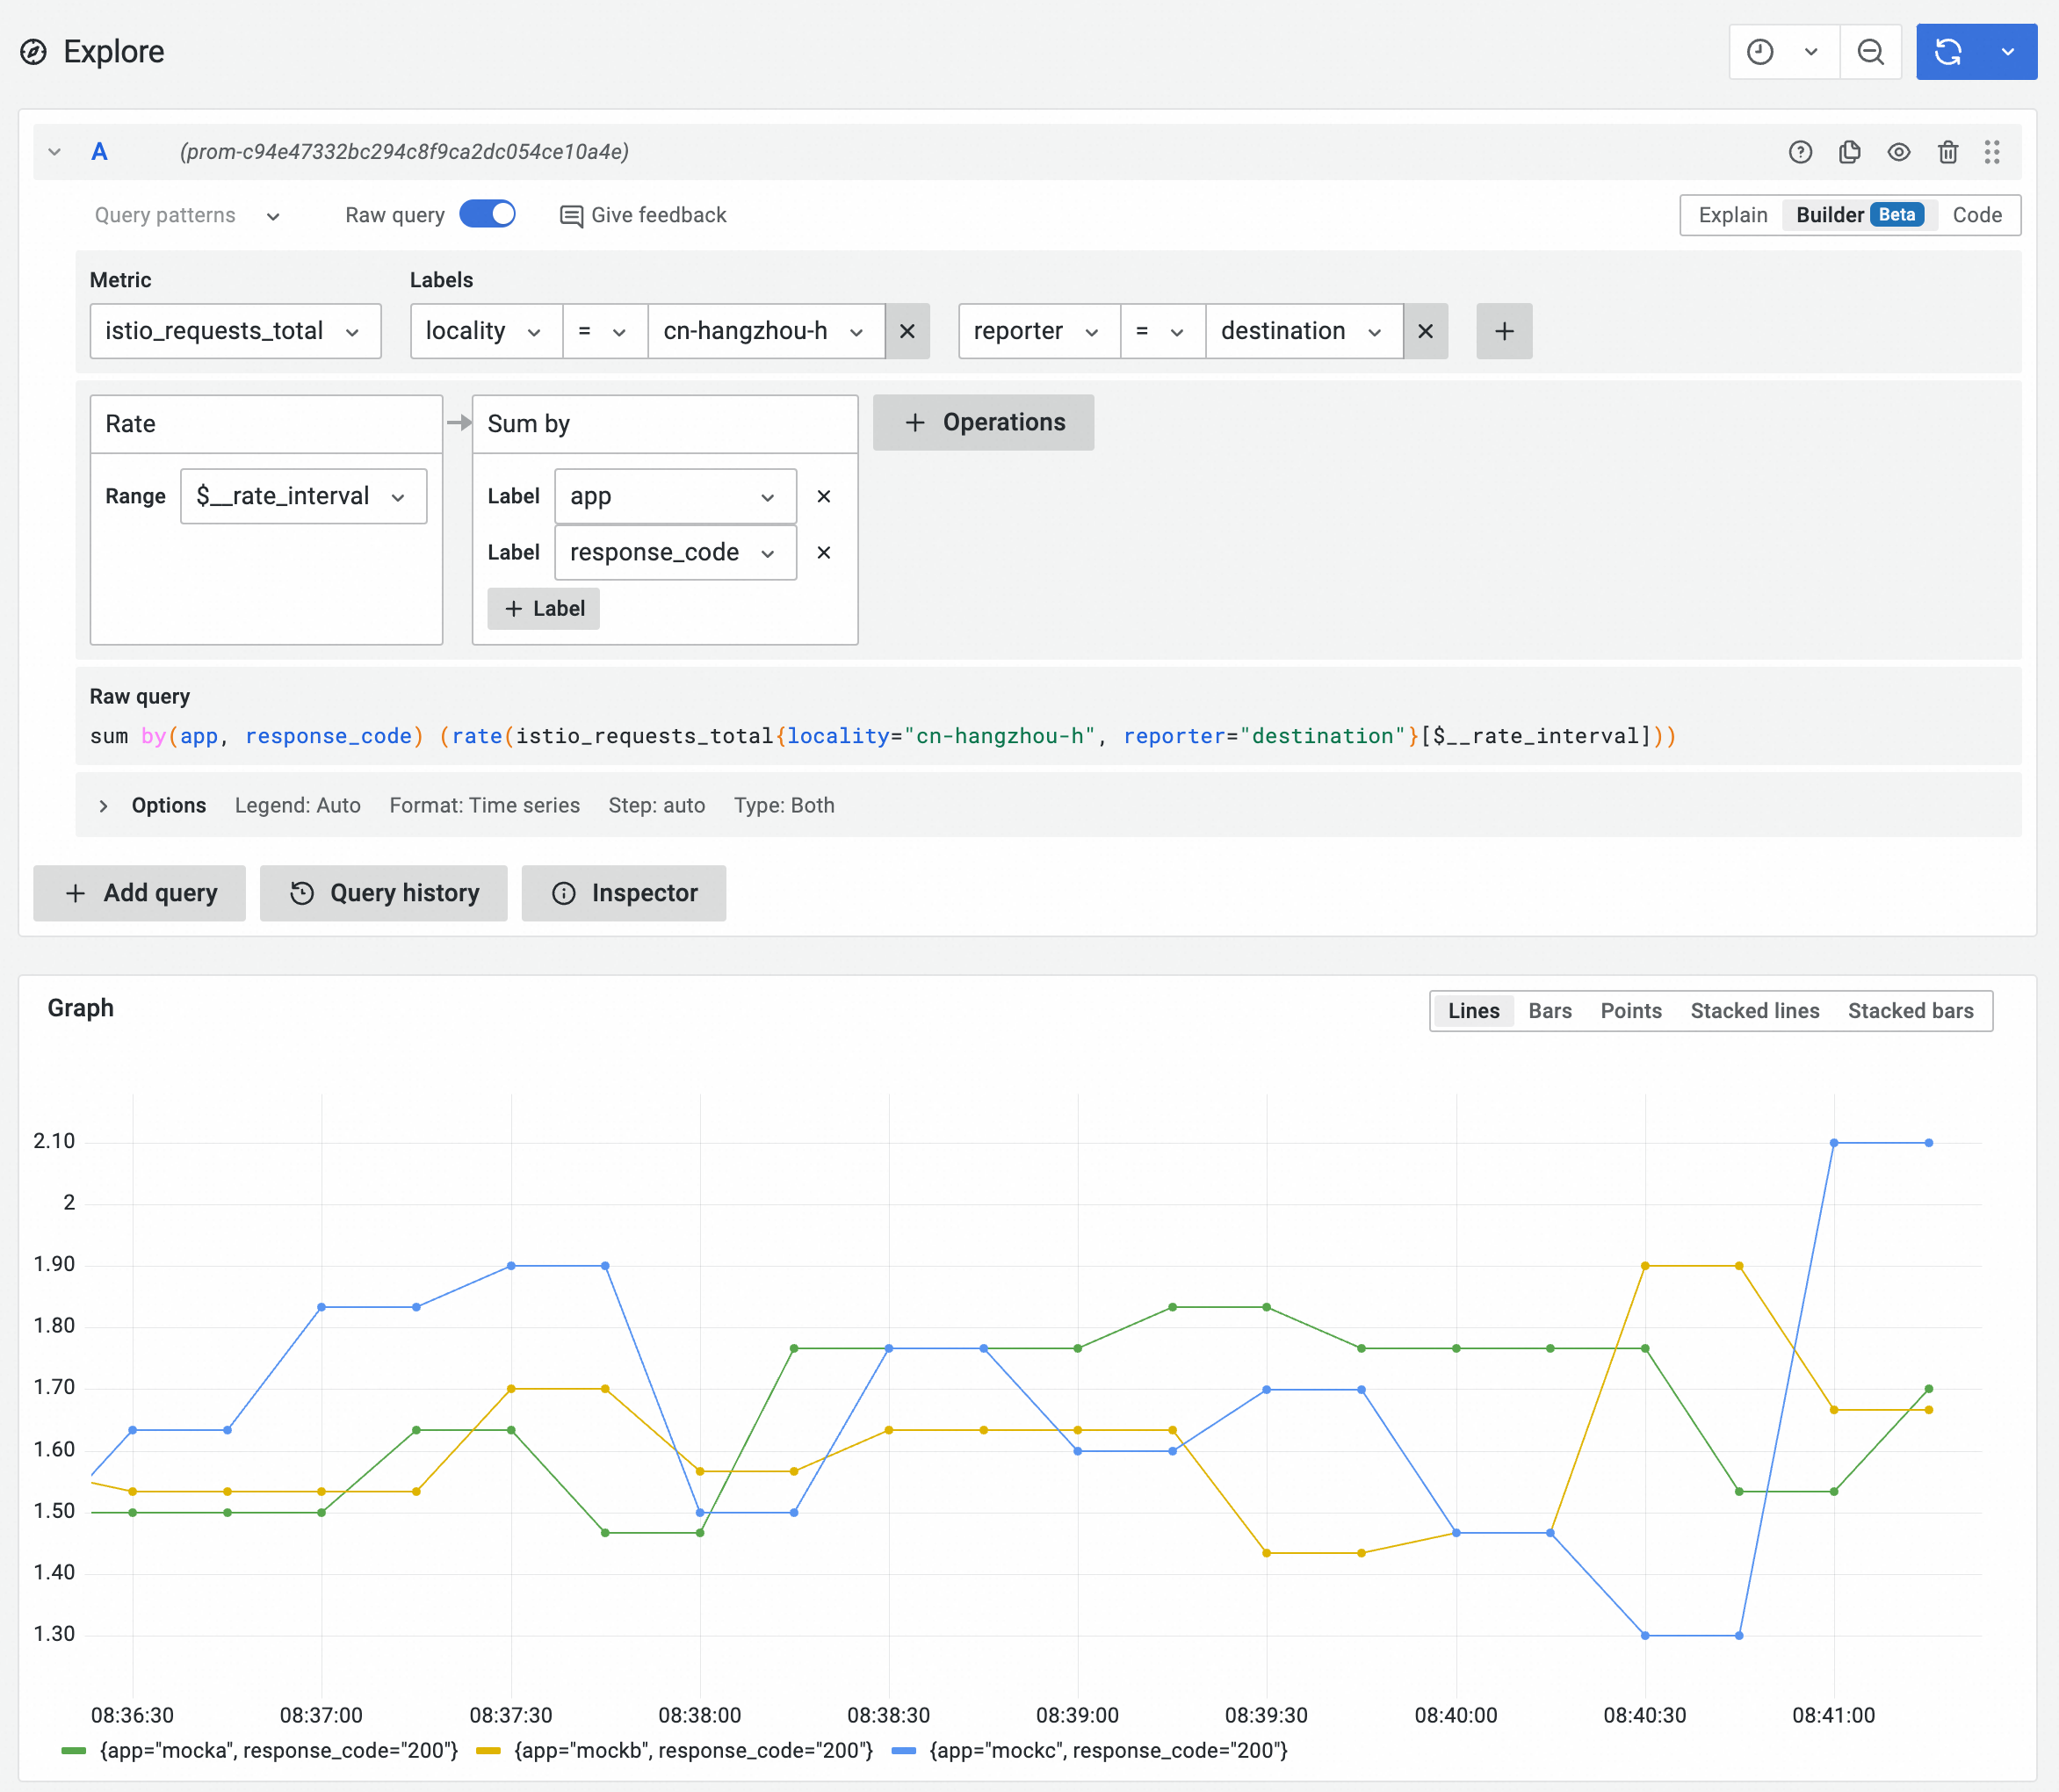
Based on the following metrics, you can see that the request rates received by the three services in the cn-hangzhou-h zone do not differ much, and most request response codes are 200.
Similarly, you can change the filter condition to locality="cn-hangzhou-k" to view the request rate and status code information in the cn-hangzhou-k zone.
sum by(app, response_code) (rate(istio_requests_total{locality="cn-hangzhou-k", reporter="destination"}[$__rate_interval]))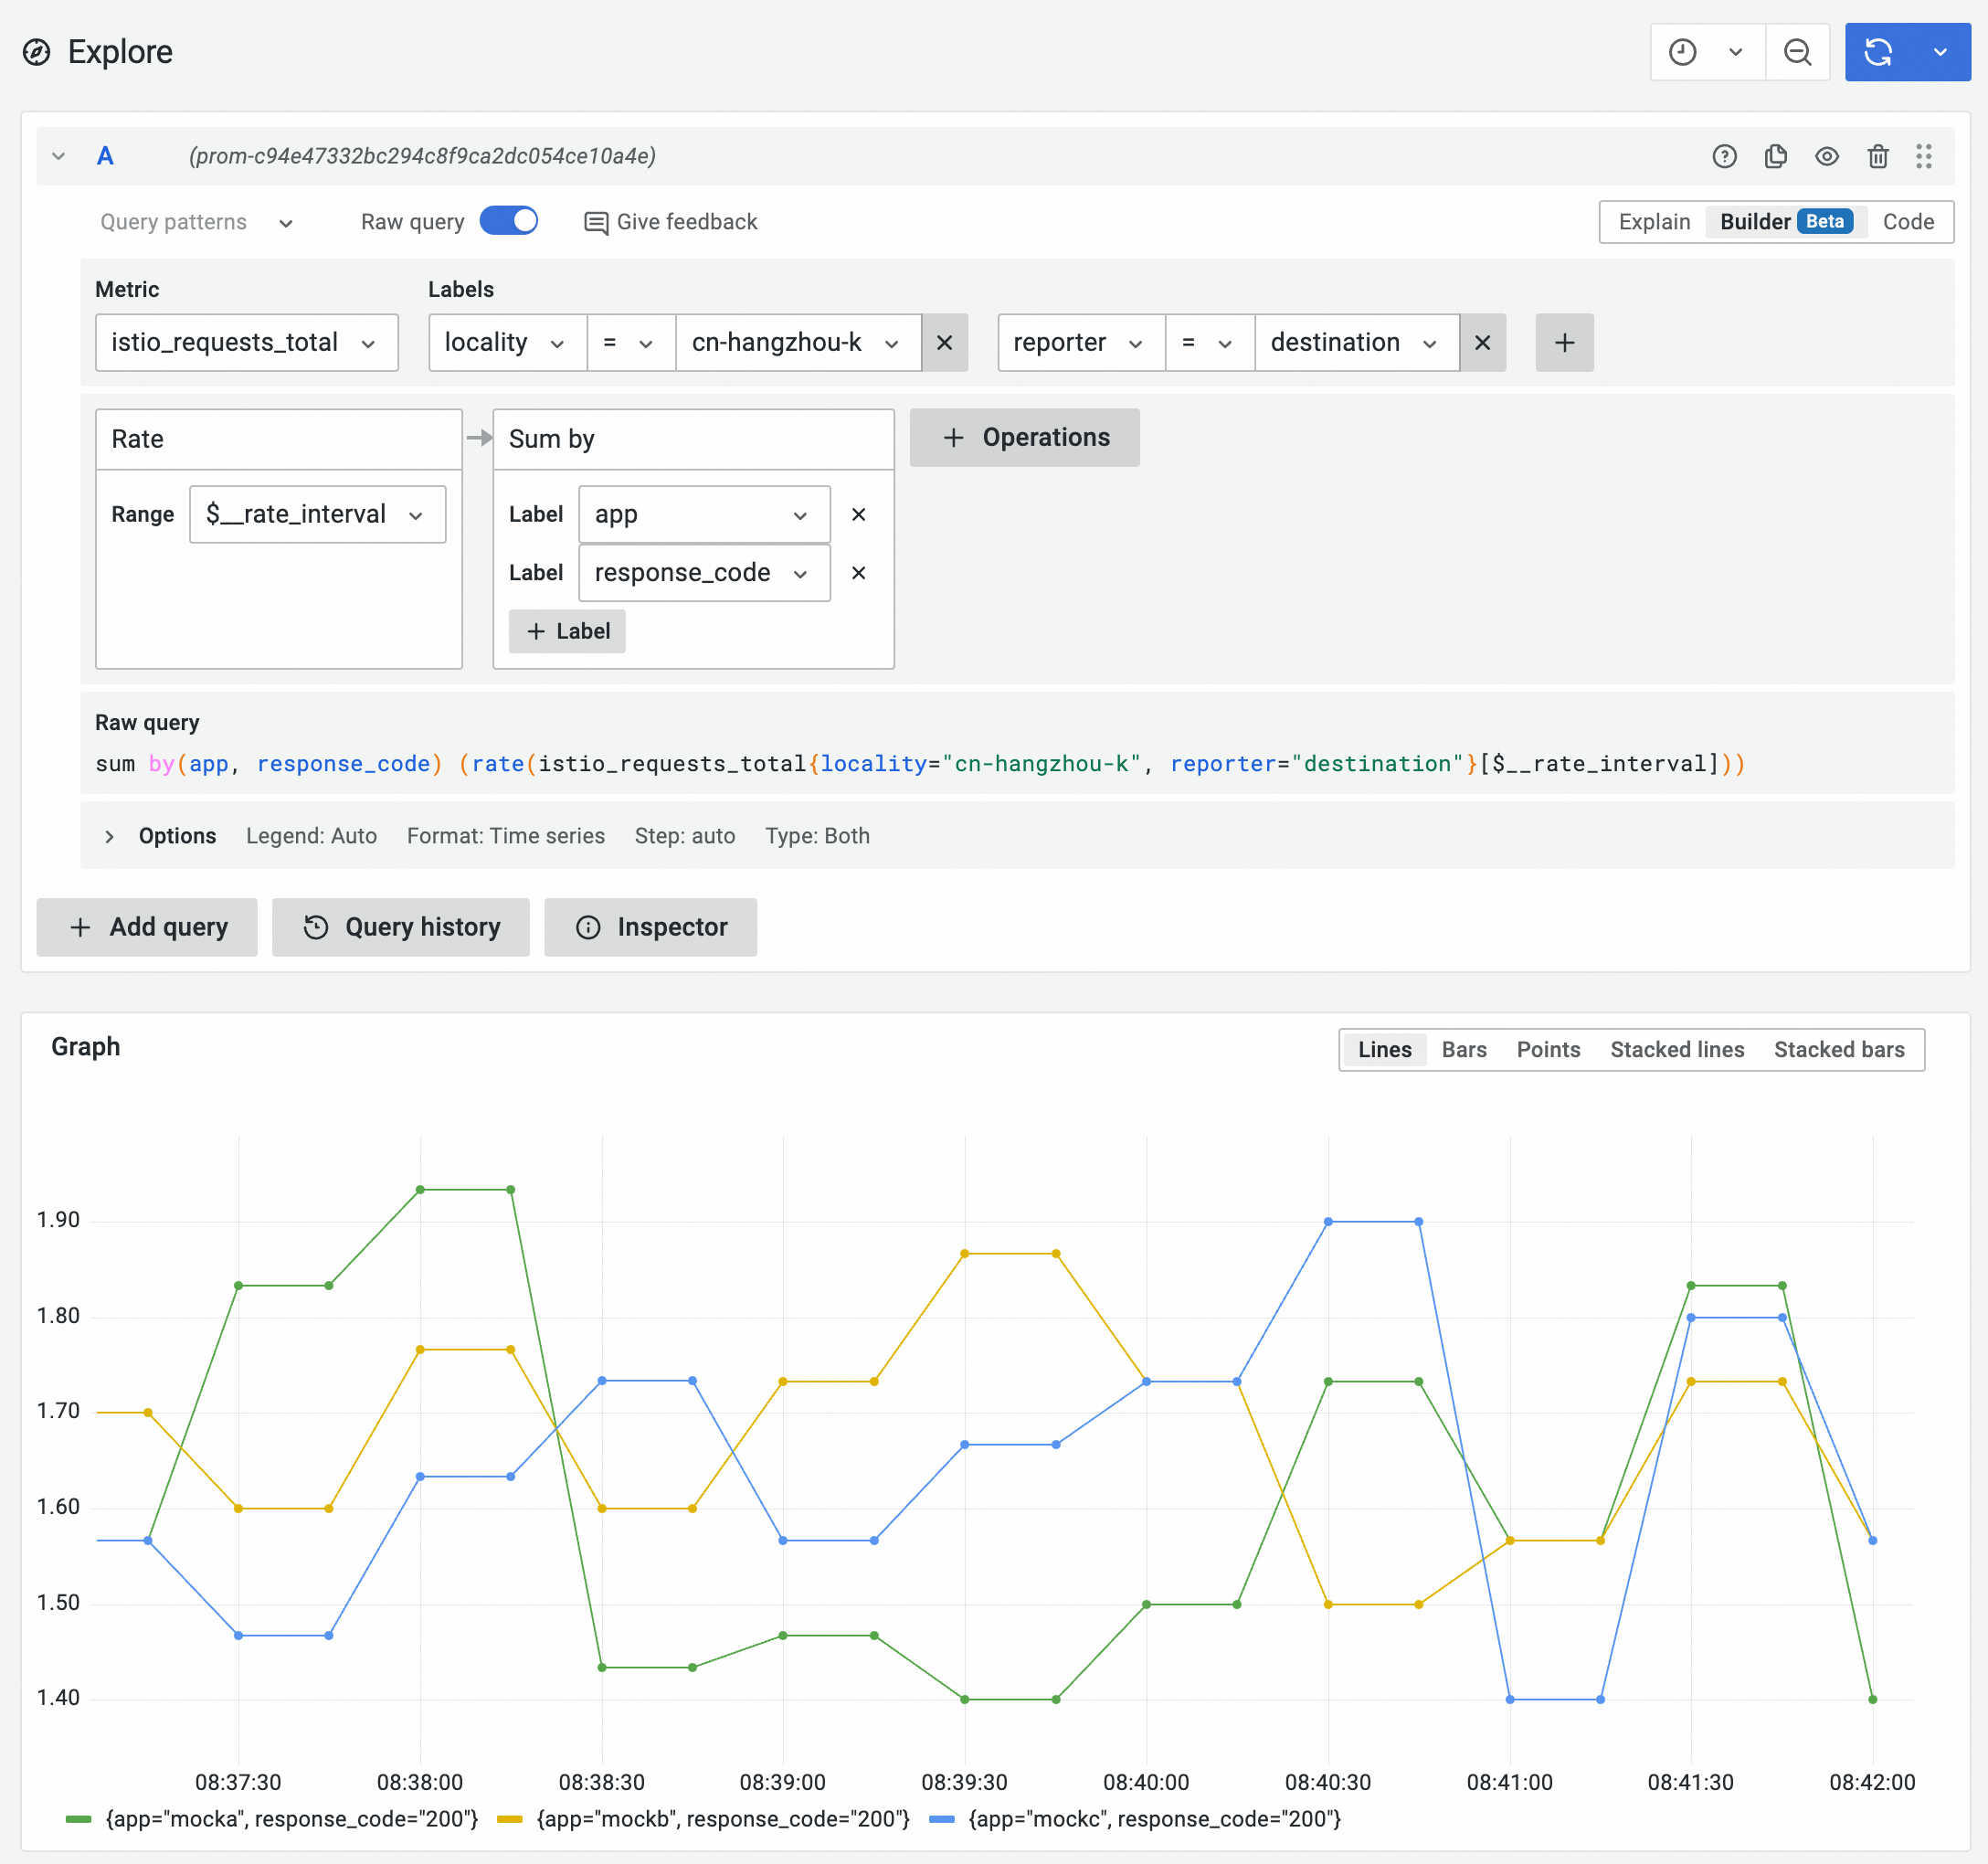
In the case of even deployment, the request rates received by the two zones are basically the same.
In a Prometheus instance, you can use the following PromQL statement to query the average latency of requests received by workloads in a specified zone and group them by service name and response code.
sum by(app, response_code) (rate(istio_request_duration_milliseconds_sum{locality="cn-hangzhou-h", reporter="destination"}[$__rate_interval]))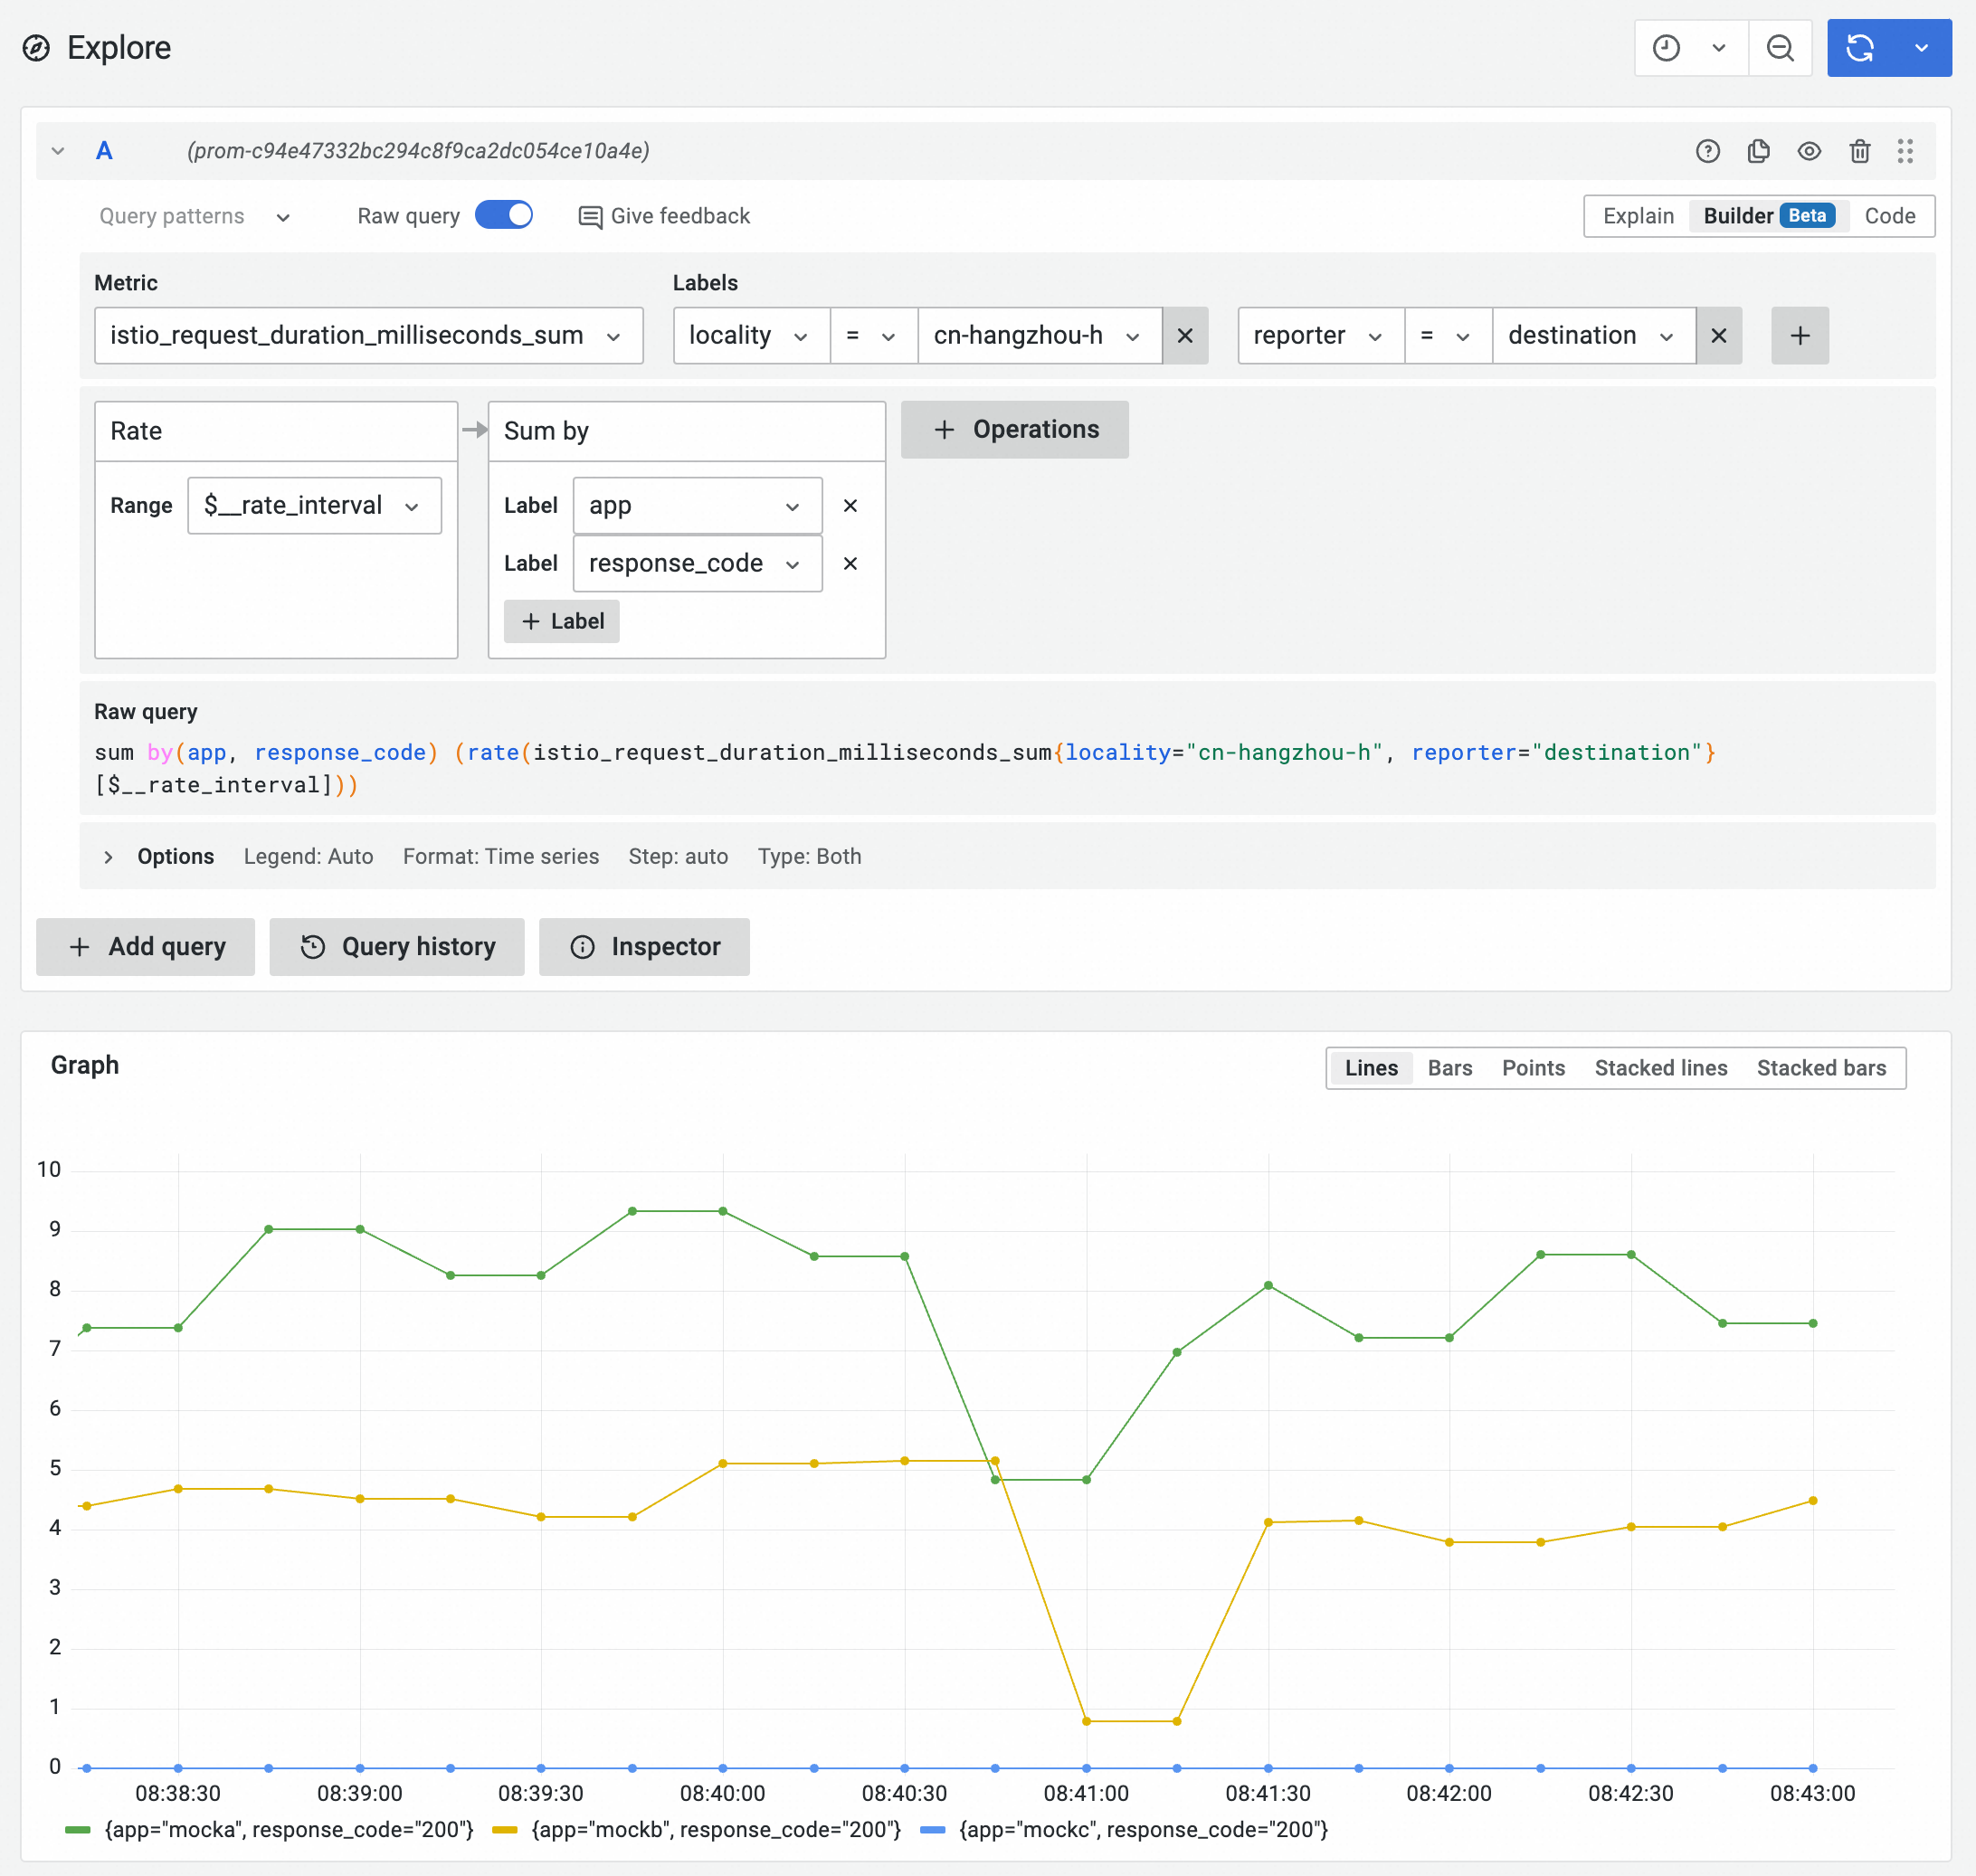
Similarly, you can change the filter condition to locality="cn-hangzhou-k" to view the average latency in the cn-hangzhou-k zone.
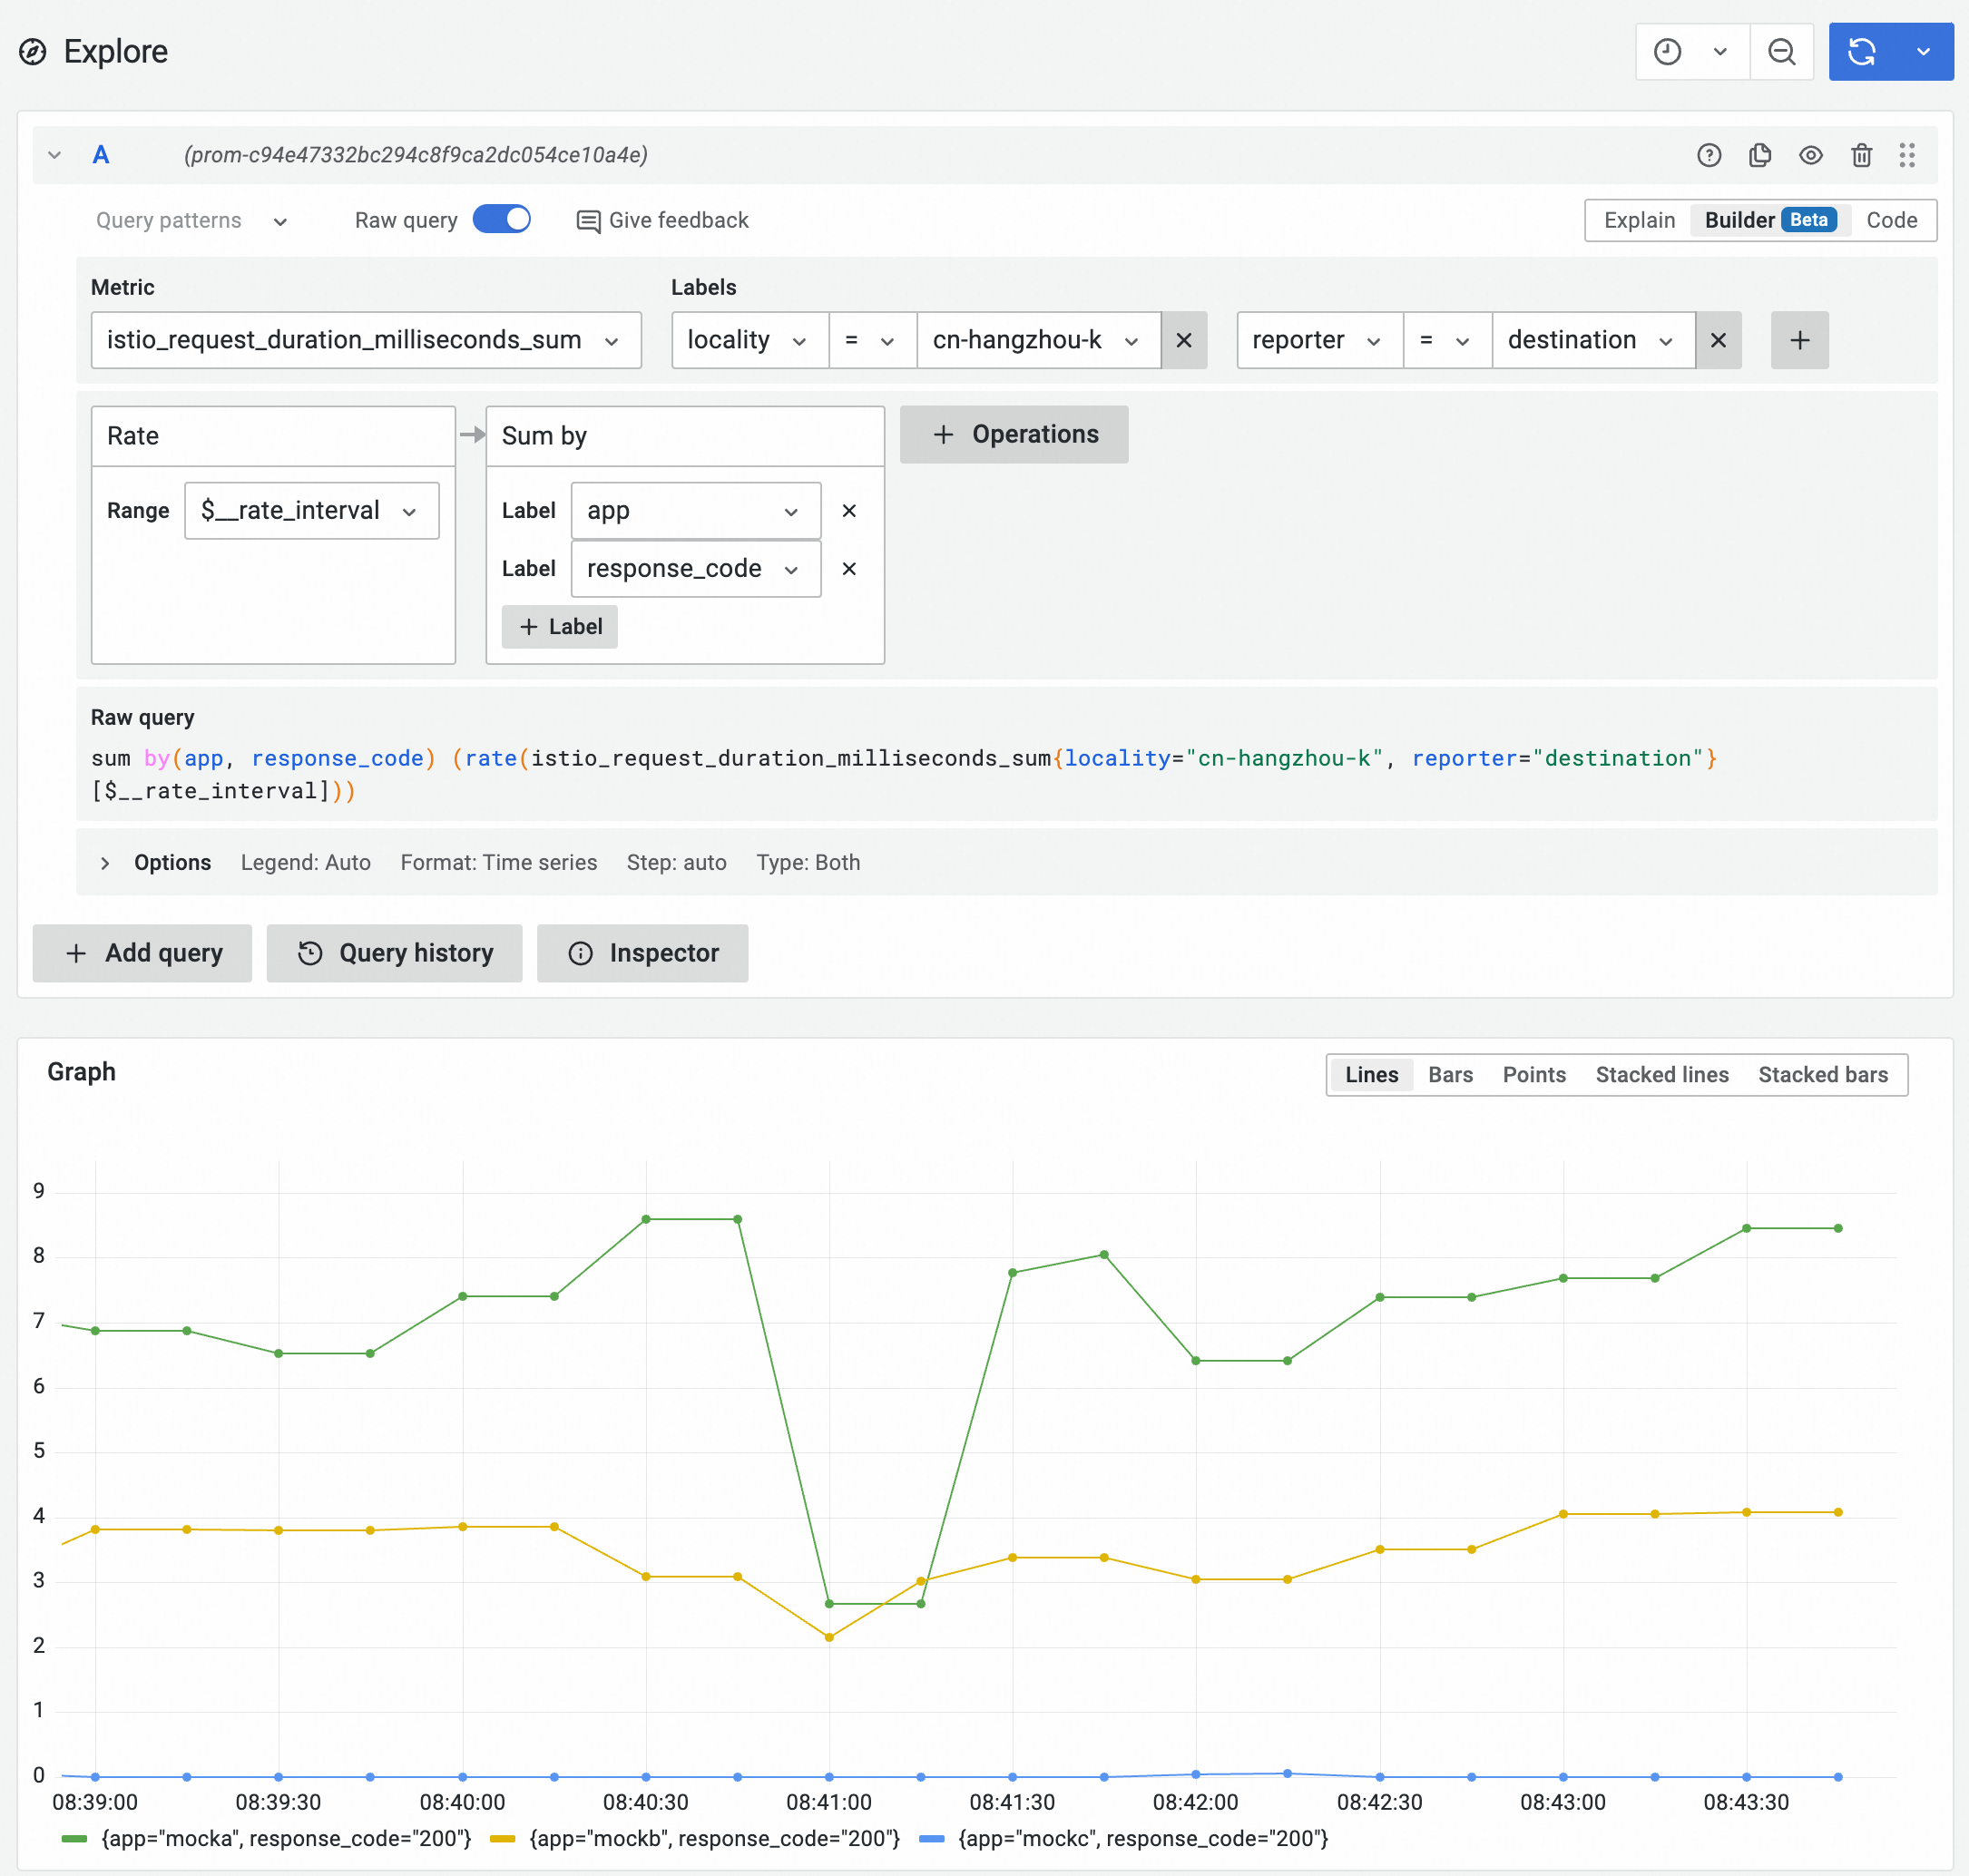
You can customize the PromQL statement to configure alert information based on the Prometheus metrics reported by the service mesh. When the service latency or status code is greater than the specified value, an alert message is sent to the specified contact. For more information, see Create an alert rule for a Prometheus instance.
Regarding the latency of actual business applications, static threshold alerts cannot be set in the same way as metrics such as CPU and memory usage of containers. You often need to adjust different applications based on actual business expectations. For example, the three services mocka, mockb, and mockc form a trace of mocka -> mockb -> mockc. Therefore, the latency is fixed to mocka > mockb > mockc. You can analyze the expected latency of key services in the business and set alert rules based on latency for the services to help discover gray fault information in the zone.
In the example, you can use the following PromQL statement to generate alerts for the mockb service.
sum by(response_code, locality) (rate(istio_request_duration_milliseconds_sum{app="mockb",reporter= "destination"}[1m])) > 3This PromQL statement indicates that an alert is issued when the average latency of the mockb service within 1 minute is more than 3 milliseconds. The alerts are grouped for status code and zone information.
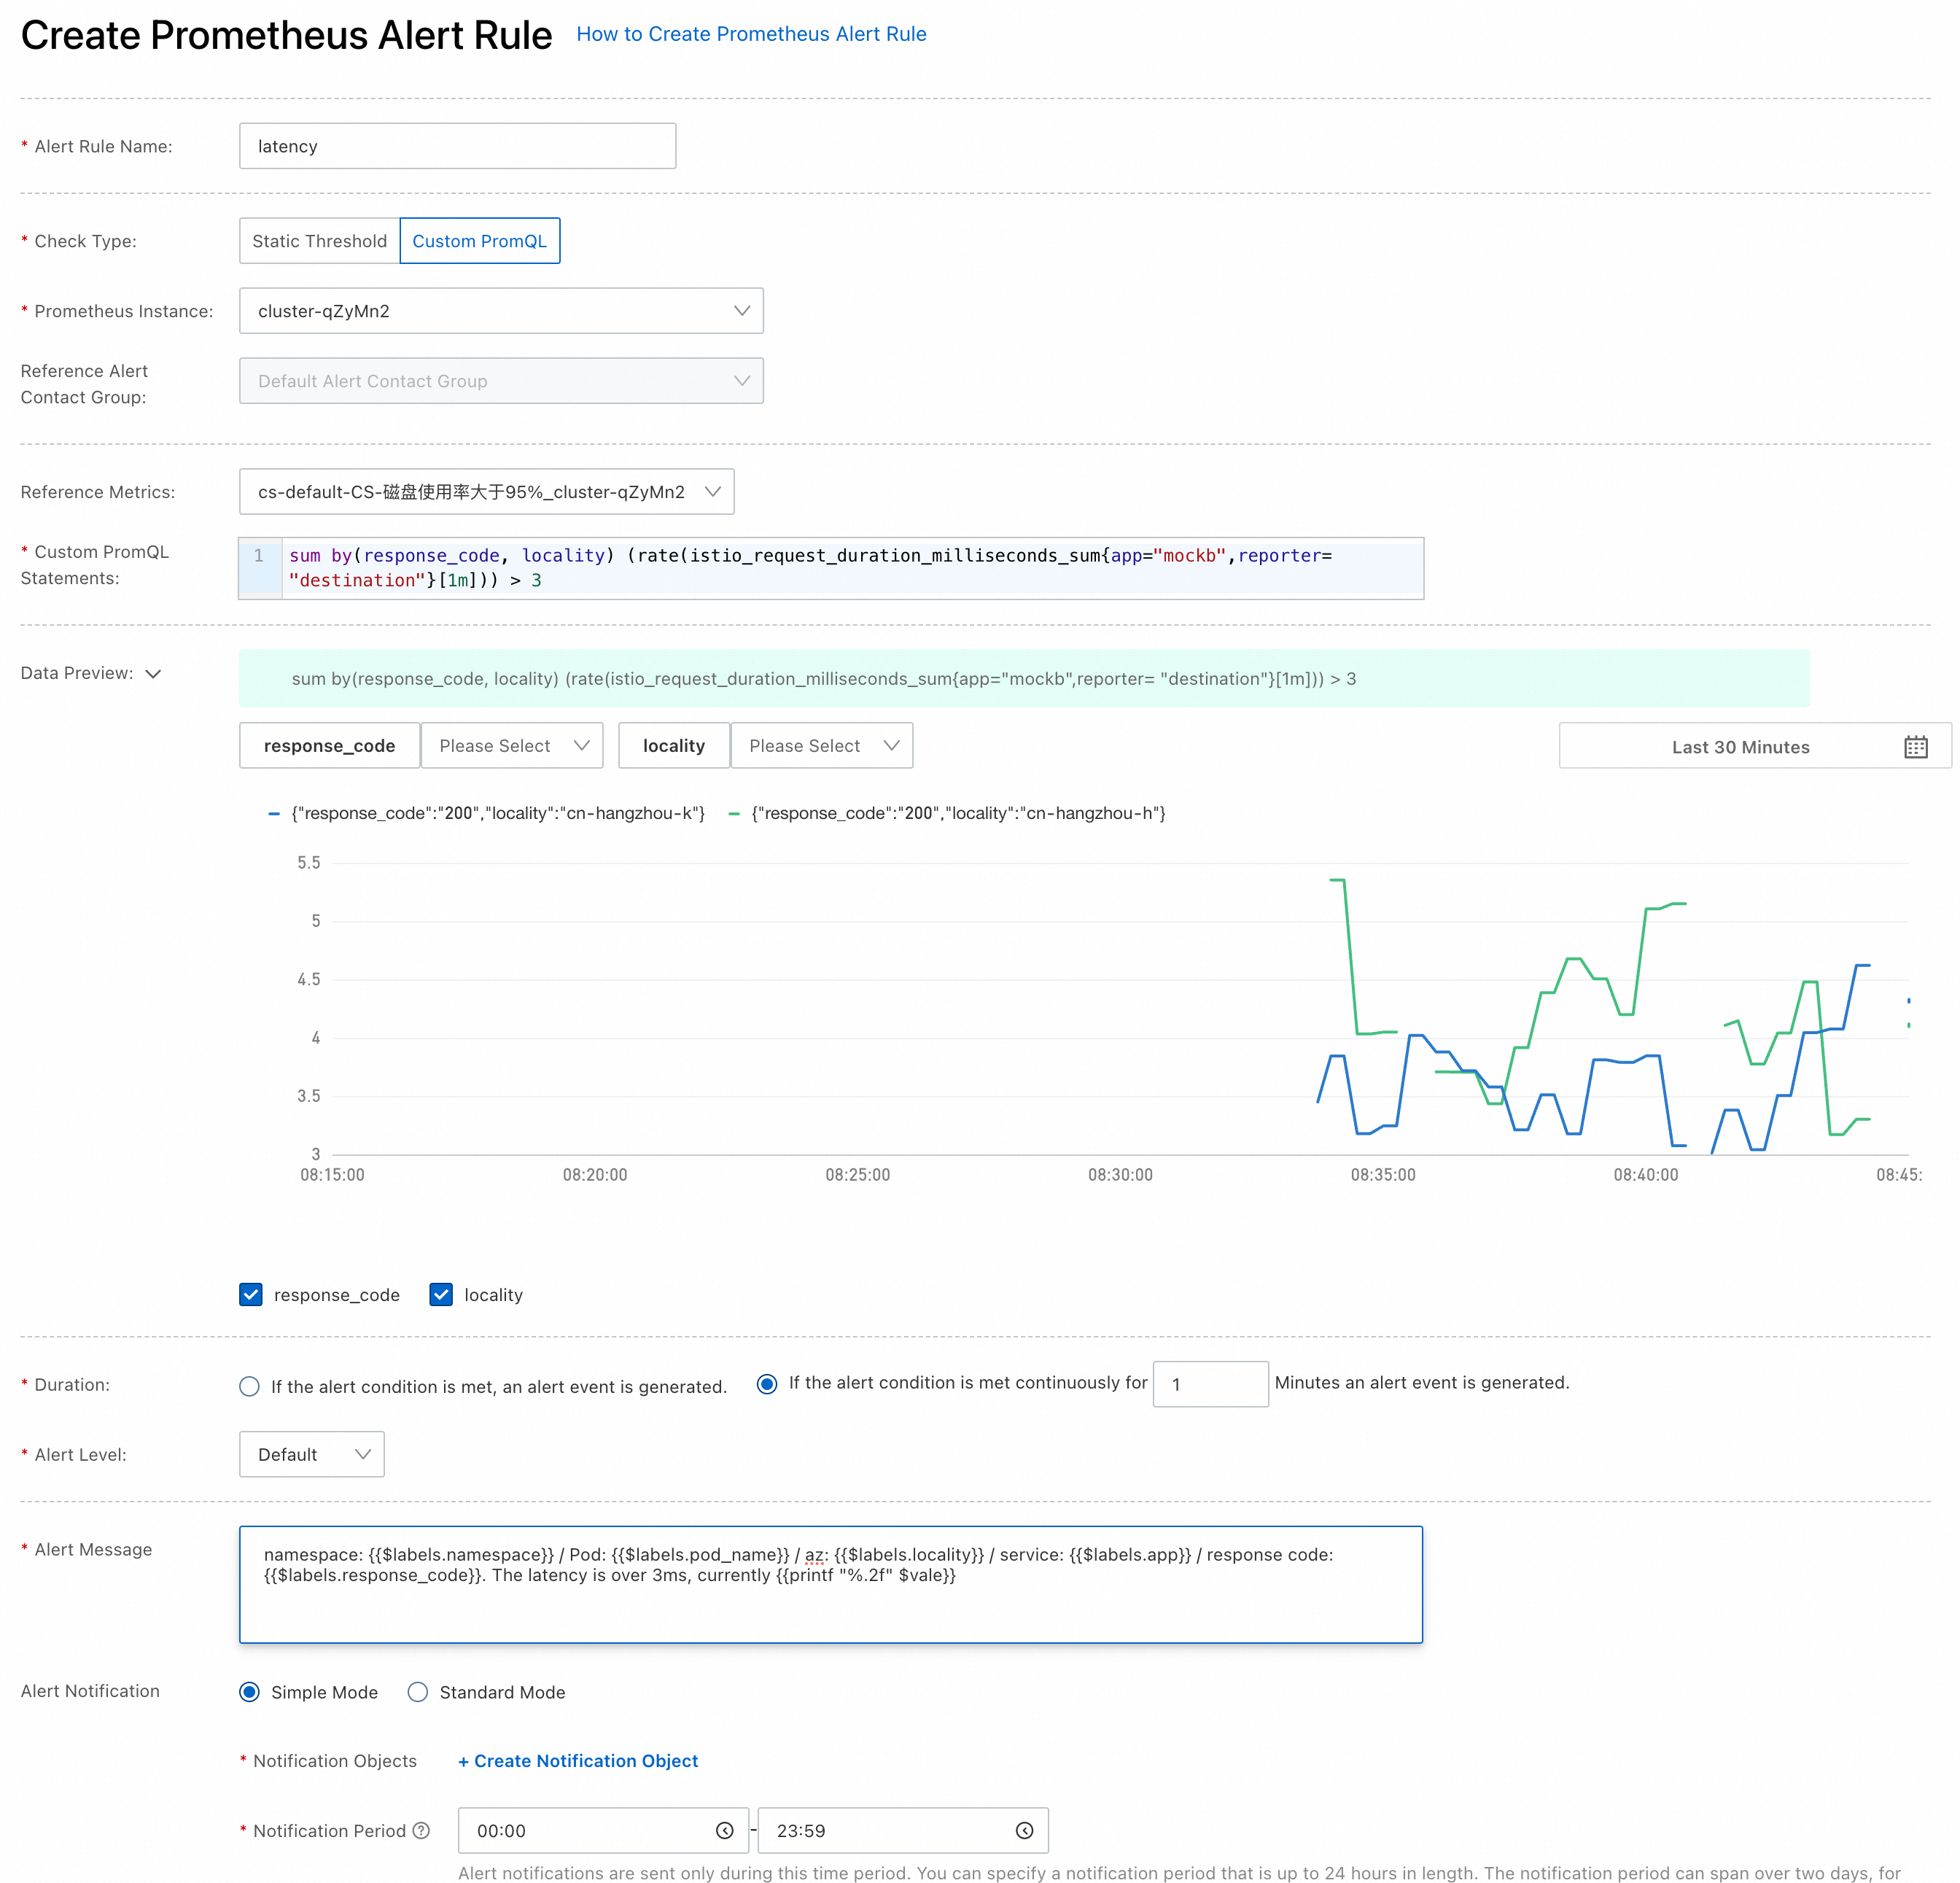
For the response code, the alert rules are set in the same way. You need to set exception status coded for specific services and issue an alert when the rate of exception status code exceeds a certain threshold.
In this example, the following PromQL statement is used to issue alerts for the mocka service.
sum by (locality, response_code) (rate(istio_requests_total{app="mocka",reporter="destination",response_code!="200"}[1m])) >= 0The PromQL statement indicates that an alert will be generated when requests with a response code other than 200 occur within 1 minute of the mocka service. The alerts are grouped for status code and zone information.
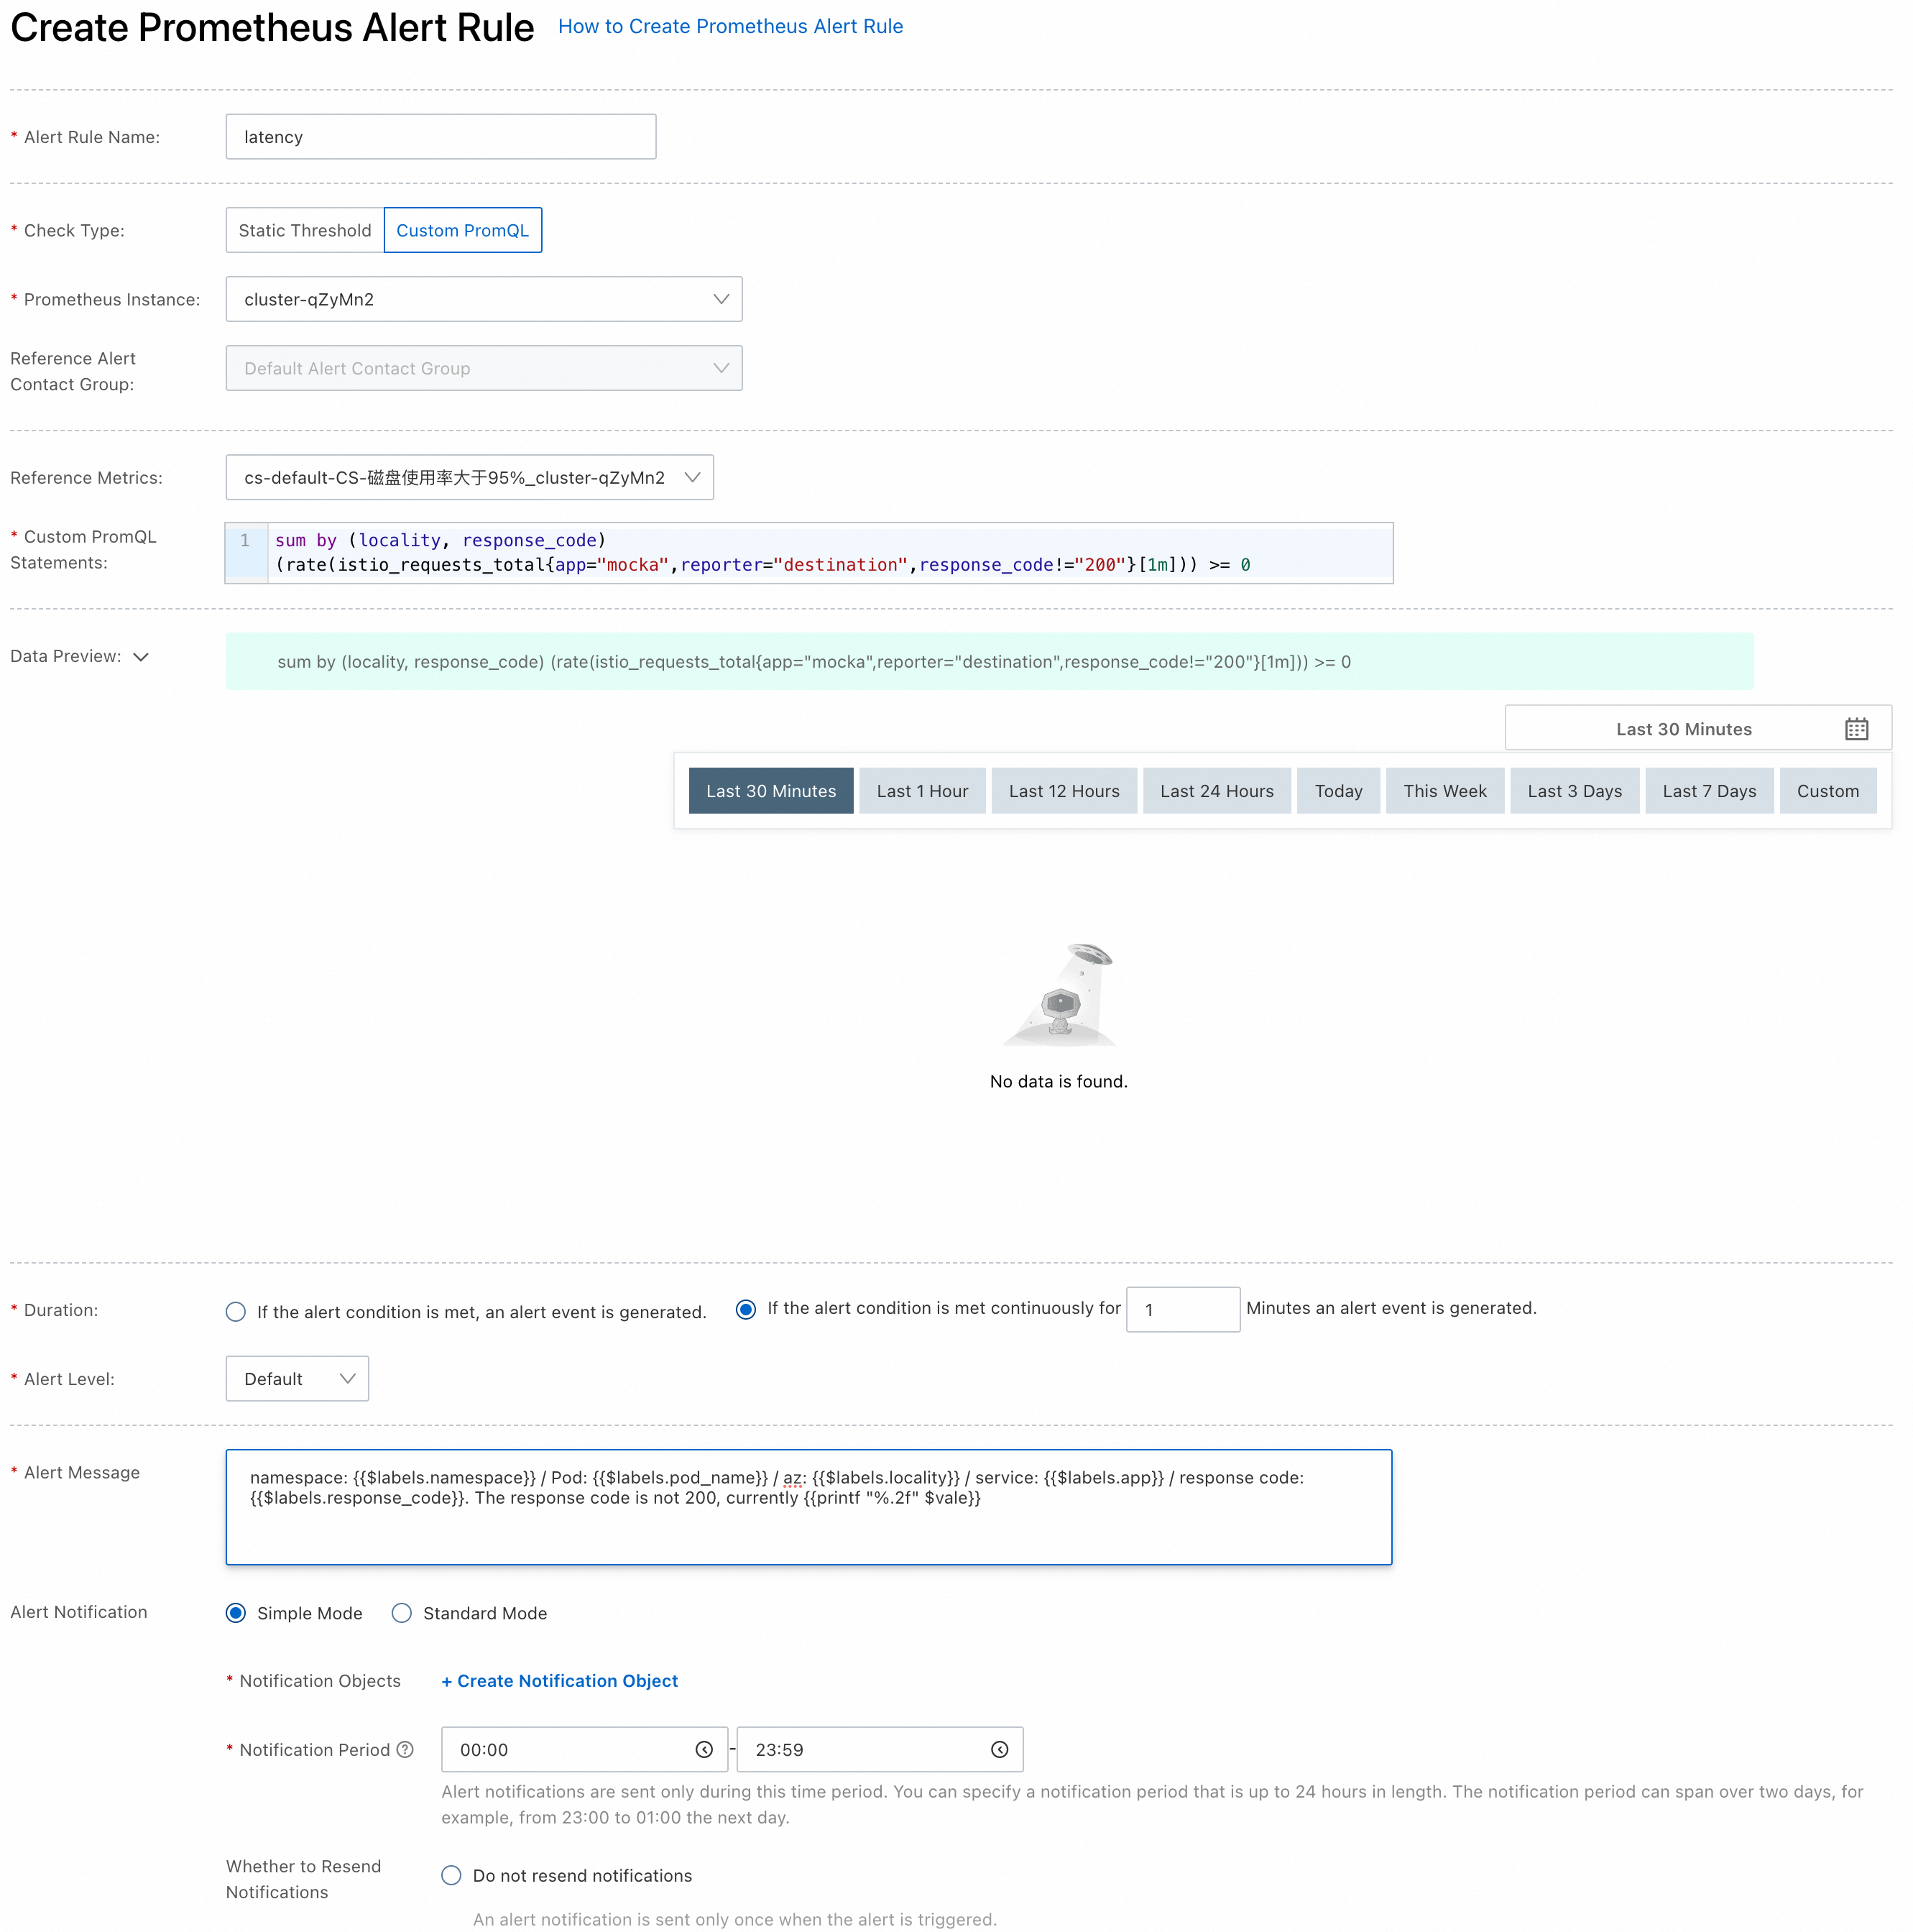
When a zone in an ACK cluster is unhealthy or damaged, we can isolate the service workloads deployed in the zone from those in other zones after receiving an alert, then investigate the cause of the fault in detail while keeping the business running normally, and redirect traffic to the zone with full capacity once the failure recovers.

Specifically, we can perform the following operations to isolate workloads within a zone from other zones.
You can change the node schedulability settings in the affected zone by adding taints to prohibit new pods from scheduling nodes in the zone. After changing the setting, the node enters an unschedulable state. While existing pods remain on the node, new pods will not be scheduled within this zone. For more information, see Set the node to the unschedulable state.
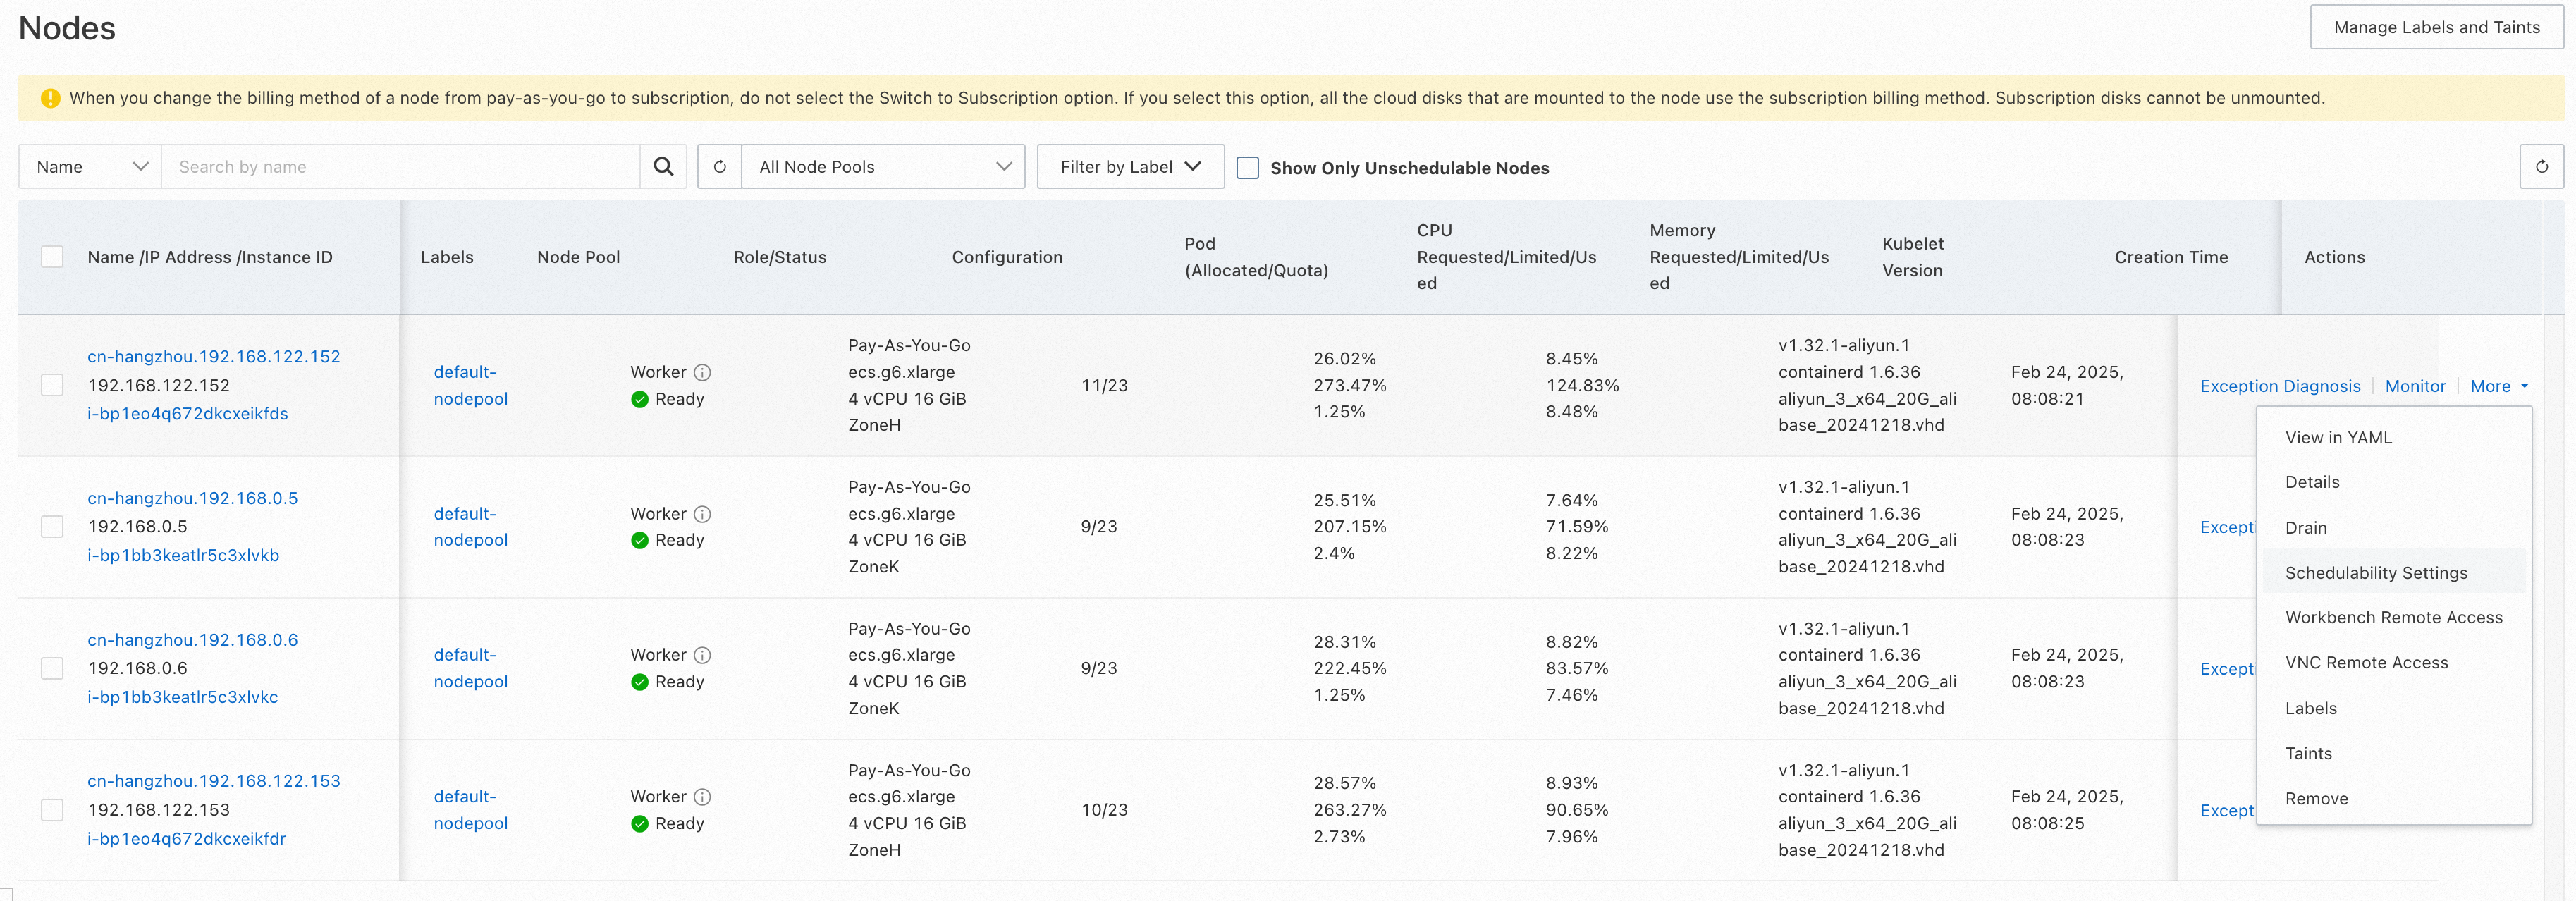
In this example, the cn-hangzhou-h zone is isolated and nodes in the cn-hangzhou-h zone are identified as unschedulable.
In Step 1, since the intra-zone forwarding capability of NLB is configured, when a fault occurs, you only need to use the DNS removal capability of NLB (or ALB) to quickly switch traffic at the north-south ingress traffic level, preventing external traffic from continuing to flow into the failed zone.
1) Log on to the NLB console, and click the NLB instance that is associated with the ASM gateway.
2) On the Instance Details page of the NLB instance, find the affected zone on the Zone tab, and click DNS Removal in the Actions column. In the dialog box that appears, click OK. In this example, the cn-hangzhou-h zone is removed. After DNS removal, the public IP addresses of NLB instances in the affected zones no longer appear in the DNS records, preventing traffic from further flowing into the affected zones.
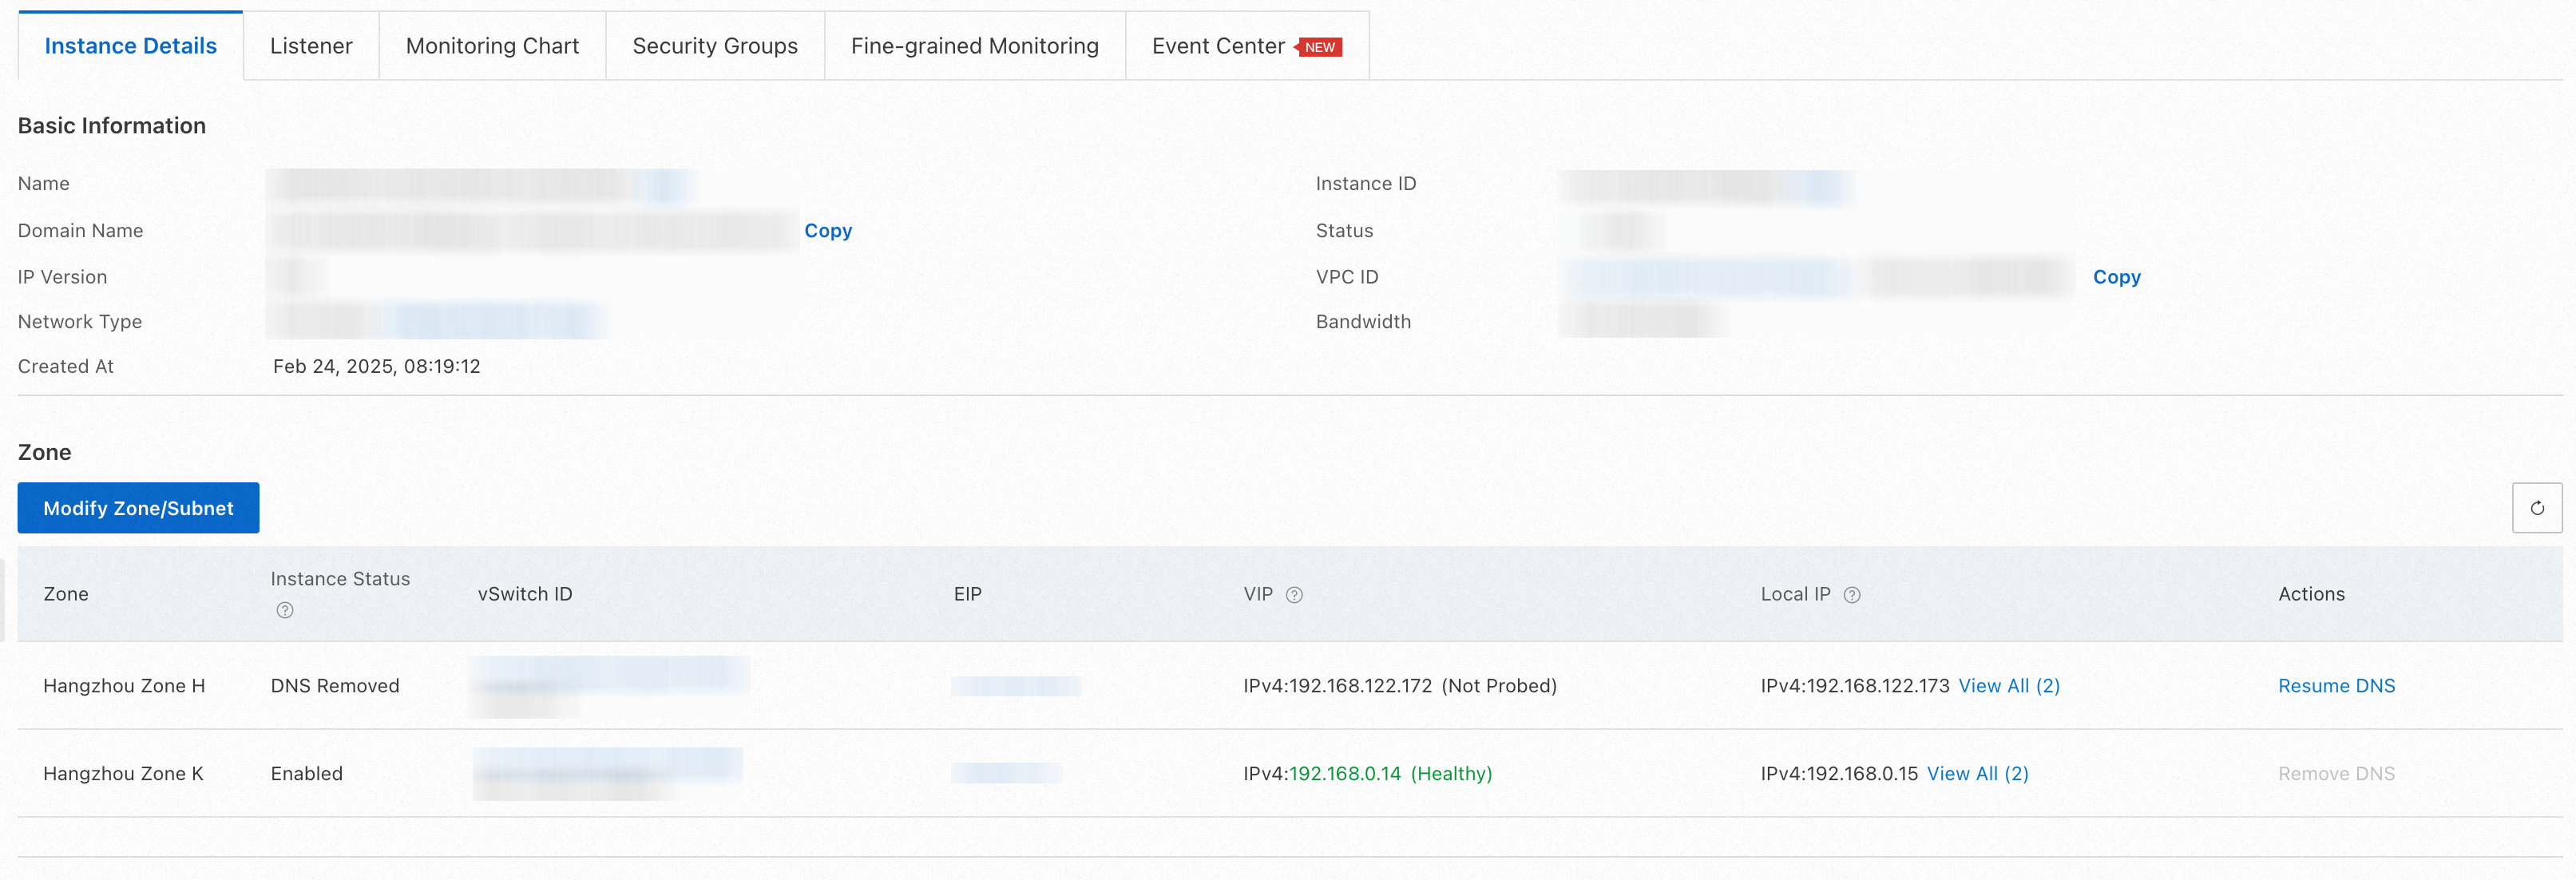
By using the zone transfer capability of ASM, you can quickly redirect east-west traffic in the cluster to prevent traffic from being sent to endpoints in specified zones.
1) Log on to the service mesh console and click Manage Cluster Service Mesh Instances.
2) On the Mesh Details page, click Service Discovery Selectors. Find Advanced Options, fill in the region and zone information of the pod, and click OK.
The service mesh enters the update state for a short period of time. After the update is completed, the endpoints in the specified zone will be excluded from the service discovery selectors, which will quickly switch the traffic in the zone.
If you continue to access the sample application, you can find that the services that respond are all from the cn-hangzhou-k services, indicating that the traffic has been completely switched away from the cn-hangzhou-h zone.
curl nlb-xxxxxxxxxxxxxxxxxxx8.cn-hangzhou.nlb.aliyuncsslb.com/mock -v
  % Total    % Received % Xferd  Average Speed   Time    Time     Time  Current
                                 Dload  Upload   Total   Spent    Left  Speed
   0     0    0     0    0     0      0      0 --:--:-- --:--:-- --:--:--     0* Host nlb-xxxxxxxxxxxxxxxxxxx8.cn-hangzhou.nlb.aliyuncsslb.com:80 was resolved.
* IPv6: (none)
* IPv4: 121.41.175.51
*   Trying 121.41.175.51:80...
* Connected to nlb-xxxxxxxxxxxxxxxxxxx8.cn-hangzhou.nlb.aliyuncsslb.com (121.41.175.51) port 80
>  0     0    0     0    0     0      0      0 --:--:-- --:--:-- --:--:--     0> GET /mock HTTP/1.1
> Host: nlb-xxxxxxxxxxxxxxxxxxx8.cn-hangzhou.nlb.aliyuncsslb.com
> User-Agent: curl/8.7.1q
> Accept: */*
> A
* Request completely sent off
< HTTP/1.1 200 OKe
< date: Tue, 10 Dec 2024 04:03:26 GMT
< content-length: 1500
< content-type: text/plain; charset=utf-8
< x-envoy-upstream-service-time: 30
< server: istio-envoyr
< s
{ [150 bytes data]
{100   150  100   150    0     0   2262      0 --:--:-- --:--:-- --:--:--  2238
* Connection #0 to host nlb-xxxxxxxxxxxxxxxxxxx8.cn-hangzhou.nlb.aliyuncsslb.com left intact
-> mocka(version: cn-hangzhou-k, ip: 192.168.0.44)-> mockb(version: cn-hangzhou-k, ip: 192.168.0.47)-> mockc(version: cn-hangzhou-k, ip: 192.168.0.46)
In the Prometheus instance, use the following PromQL statement to query the rate at which requests are received by workloads in the cluster. The requests are grouped by zone, service name, and response code. For more information, see Step 2.
sum by(app, response_code, locality) (rate(istio_requests_total{reporter="destination"}[$__rate_interval]))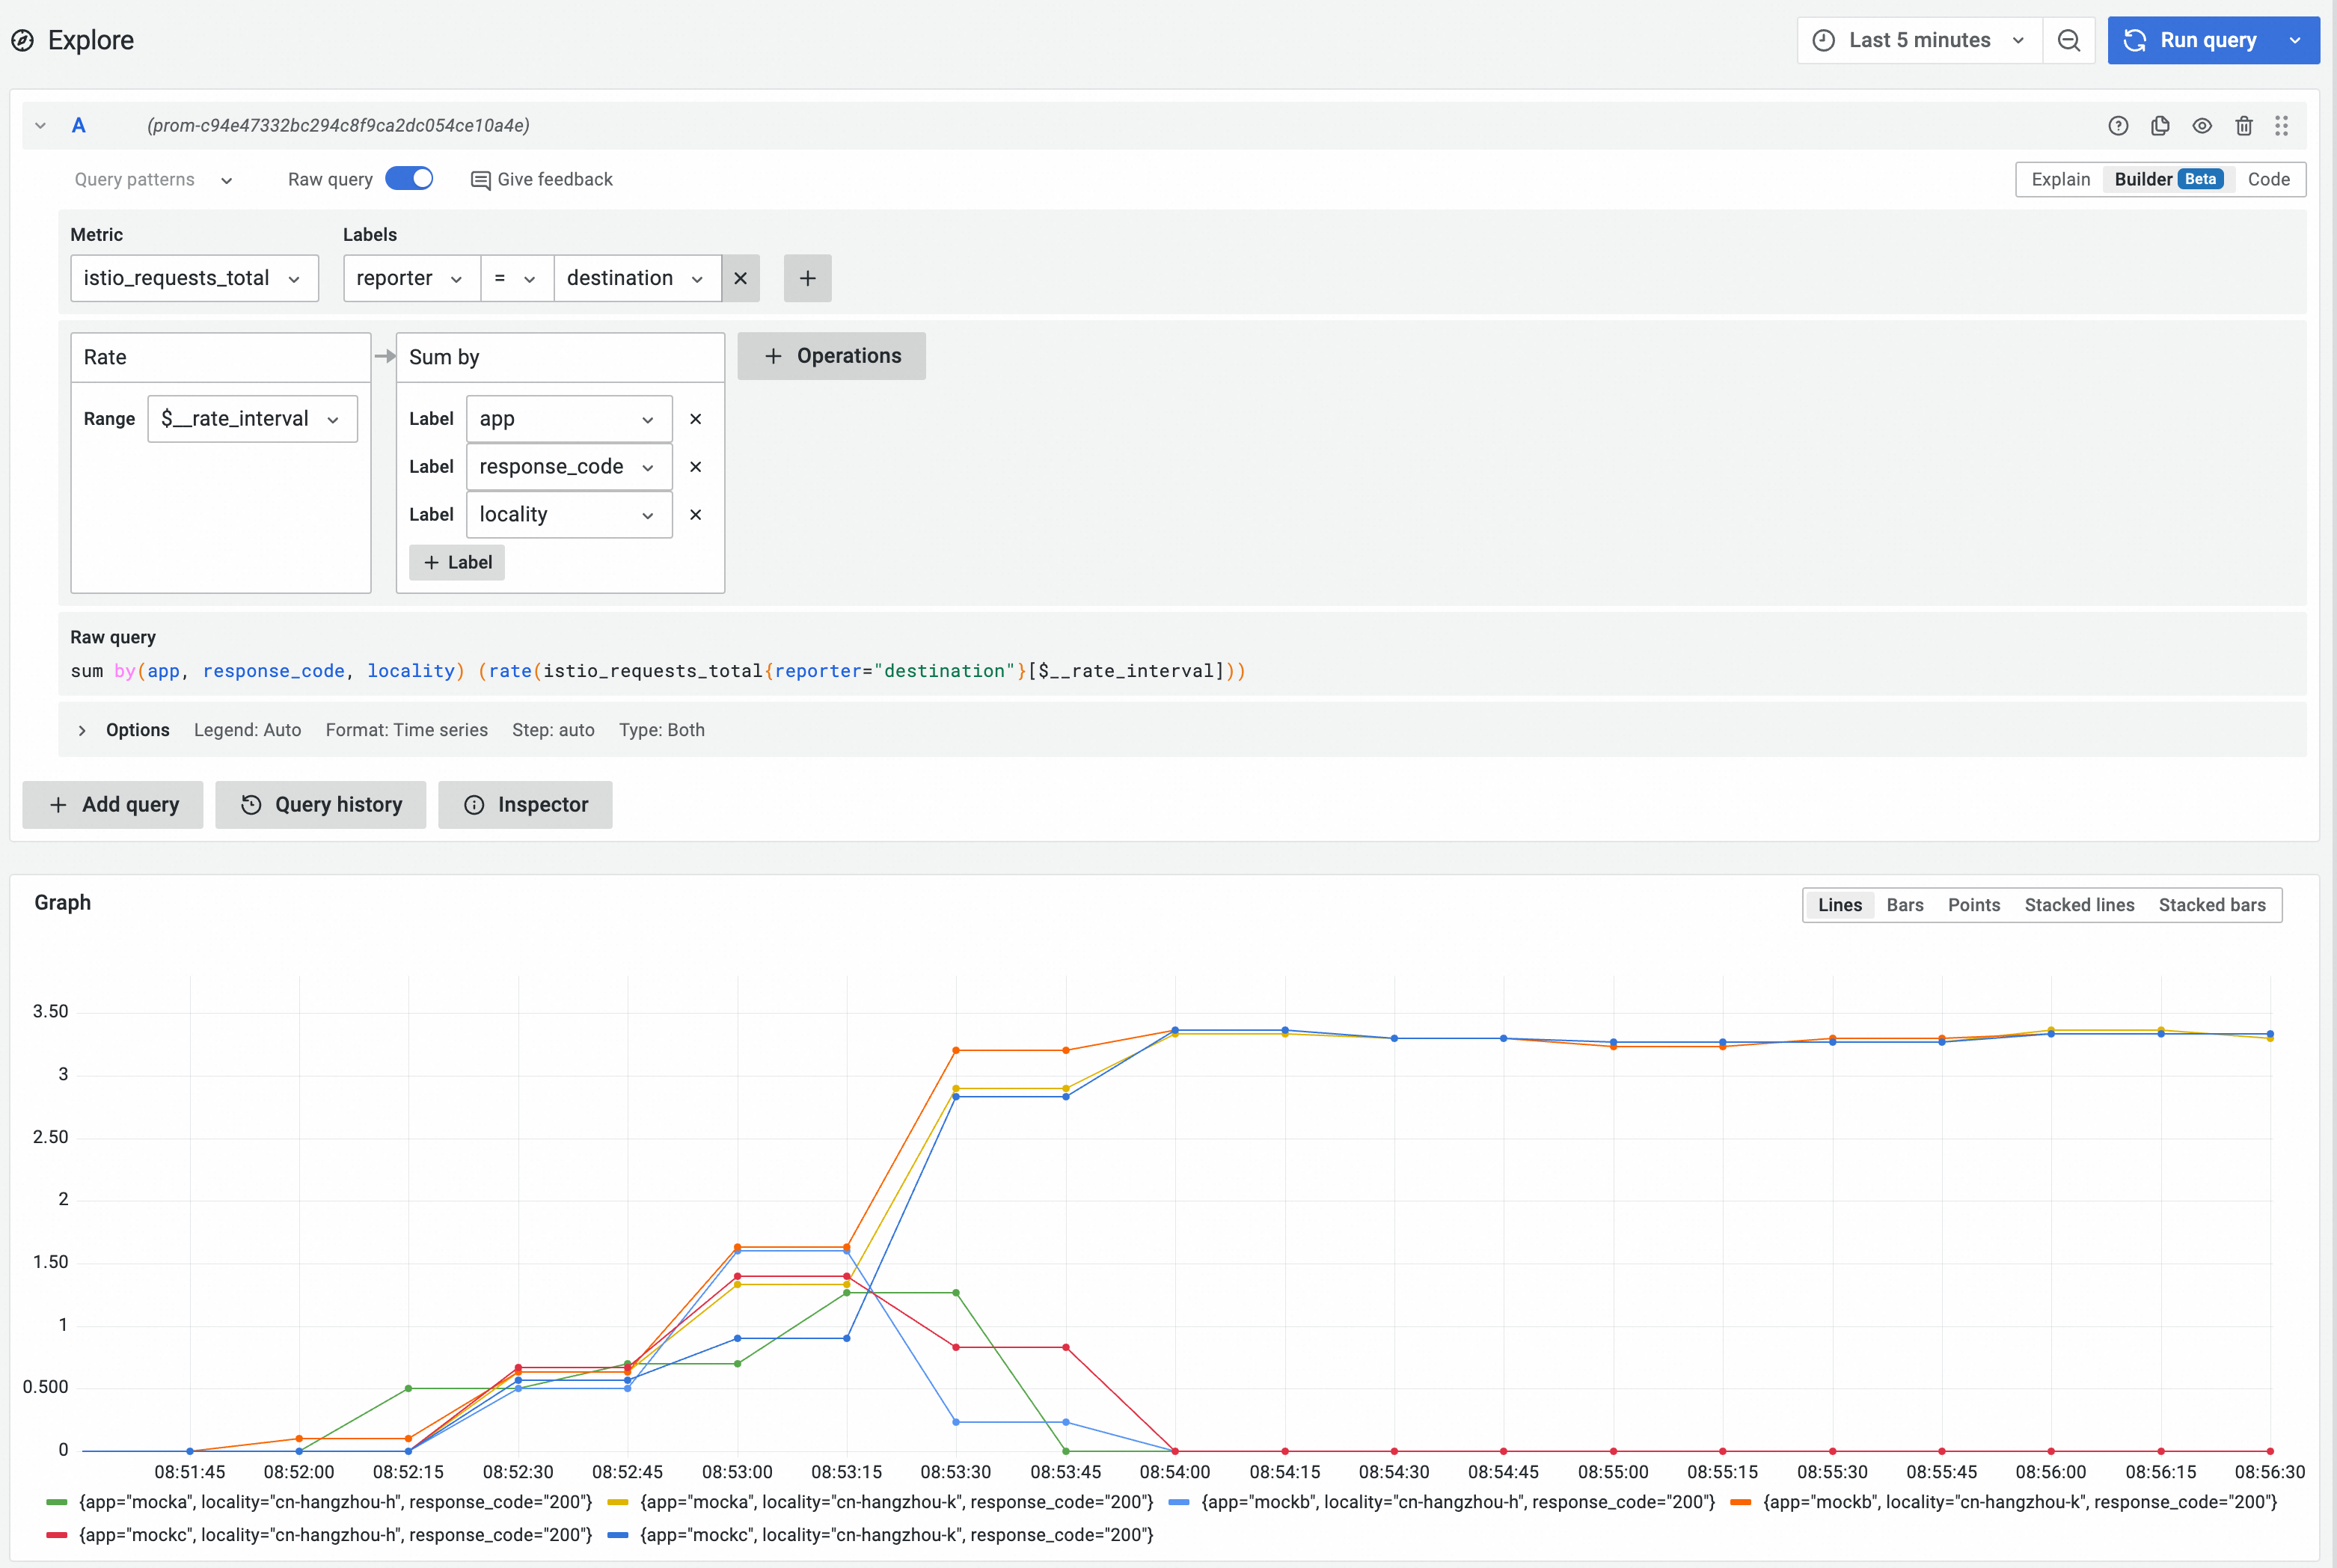
It can be observed that the traffic received by all services in the cn-hangzhou-h zone quickly drops to 0 after the traffic in the zone is redirected. In addition, the cn-hangzhou-h zone is already in a traffic isolation environment, and operations such as fault checking can be performed safely.
When it is necessary to recover from the fault state, you need to release the unschedulable state of the nodes in the cluster (remove taints), delete the configured service discovery selector, and restore the DNS resolution of the NLB instance.

229 posts | 33 followers
FollowAlibaba Container Service - May 23, 2025
Alibaba Container Service - March 12, 2025
Alibaba Container Service - May 23, 2025
Alibaba Cloud Community - October 9, 2022
Alibaba Developer - August 24, 2021
Alibaba Container Service - November 21, 2024

229 posts | 33 followers
Follow Container Service for Kubernetes
Alibaba Cloud Container Service for Kubernetes is a fully managed cloud container management service that supports native Kubernetes and integrates with other Alibaba Cloud products.
Learn More Container Compute Service (ACS)
A cloud computing service that provides container compute resources that comply with the container specifications of Kubernetes
Learn More ACK One
Provides a control plane to allow users to manage Kubernetes clusters that run based on different infrastructure resources
Learn More Cloud-Native Applications Management Solution
Accelerate and secure the development, deployment, and management of containerized applications cost-effectively.
Learn MoreMore Posts by Alibaba Container Service