Throughout the history of technology, every paradigm shift has fundamentally reshaped its corresponding domain. Just as the cloud-native era evolved "monitoring" into "observability," the advent of the large model era is now driving the next disruptive transformation in this space. We see AI reshaping software development, giving rise to an entirely new paradigm of AI-assisted coding. It follows, then, that Artificial Intelligence for IT Operations (AIOps)—the practice of leveraging AI to simplify operational complexity—is an inevitable trend.
AIOps is by no means a new concept. As early as 2017, Gartner outlined its vision for autonomous IT operations. However, the widespread adoption of AIOps was long hampered by three major bottlenecks: rigid rule engines, severe data silos, and prohibitive customization costs. Now, the emergence of large models provides the key to overcoming these barriers, bringing AIOps to the tipping point of a true breakthrough.
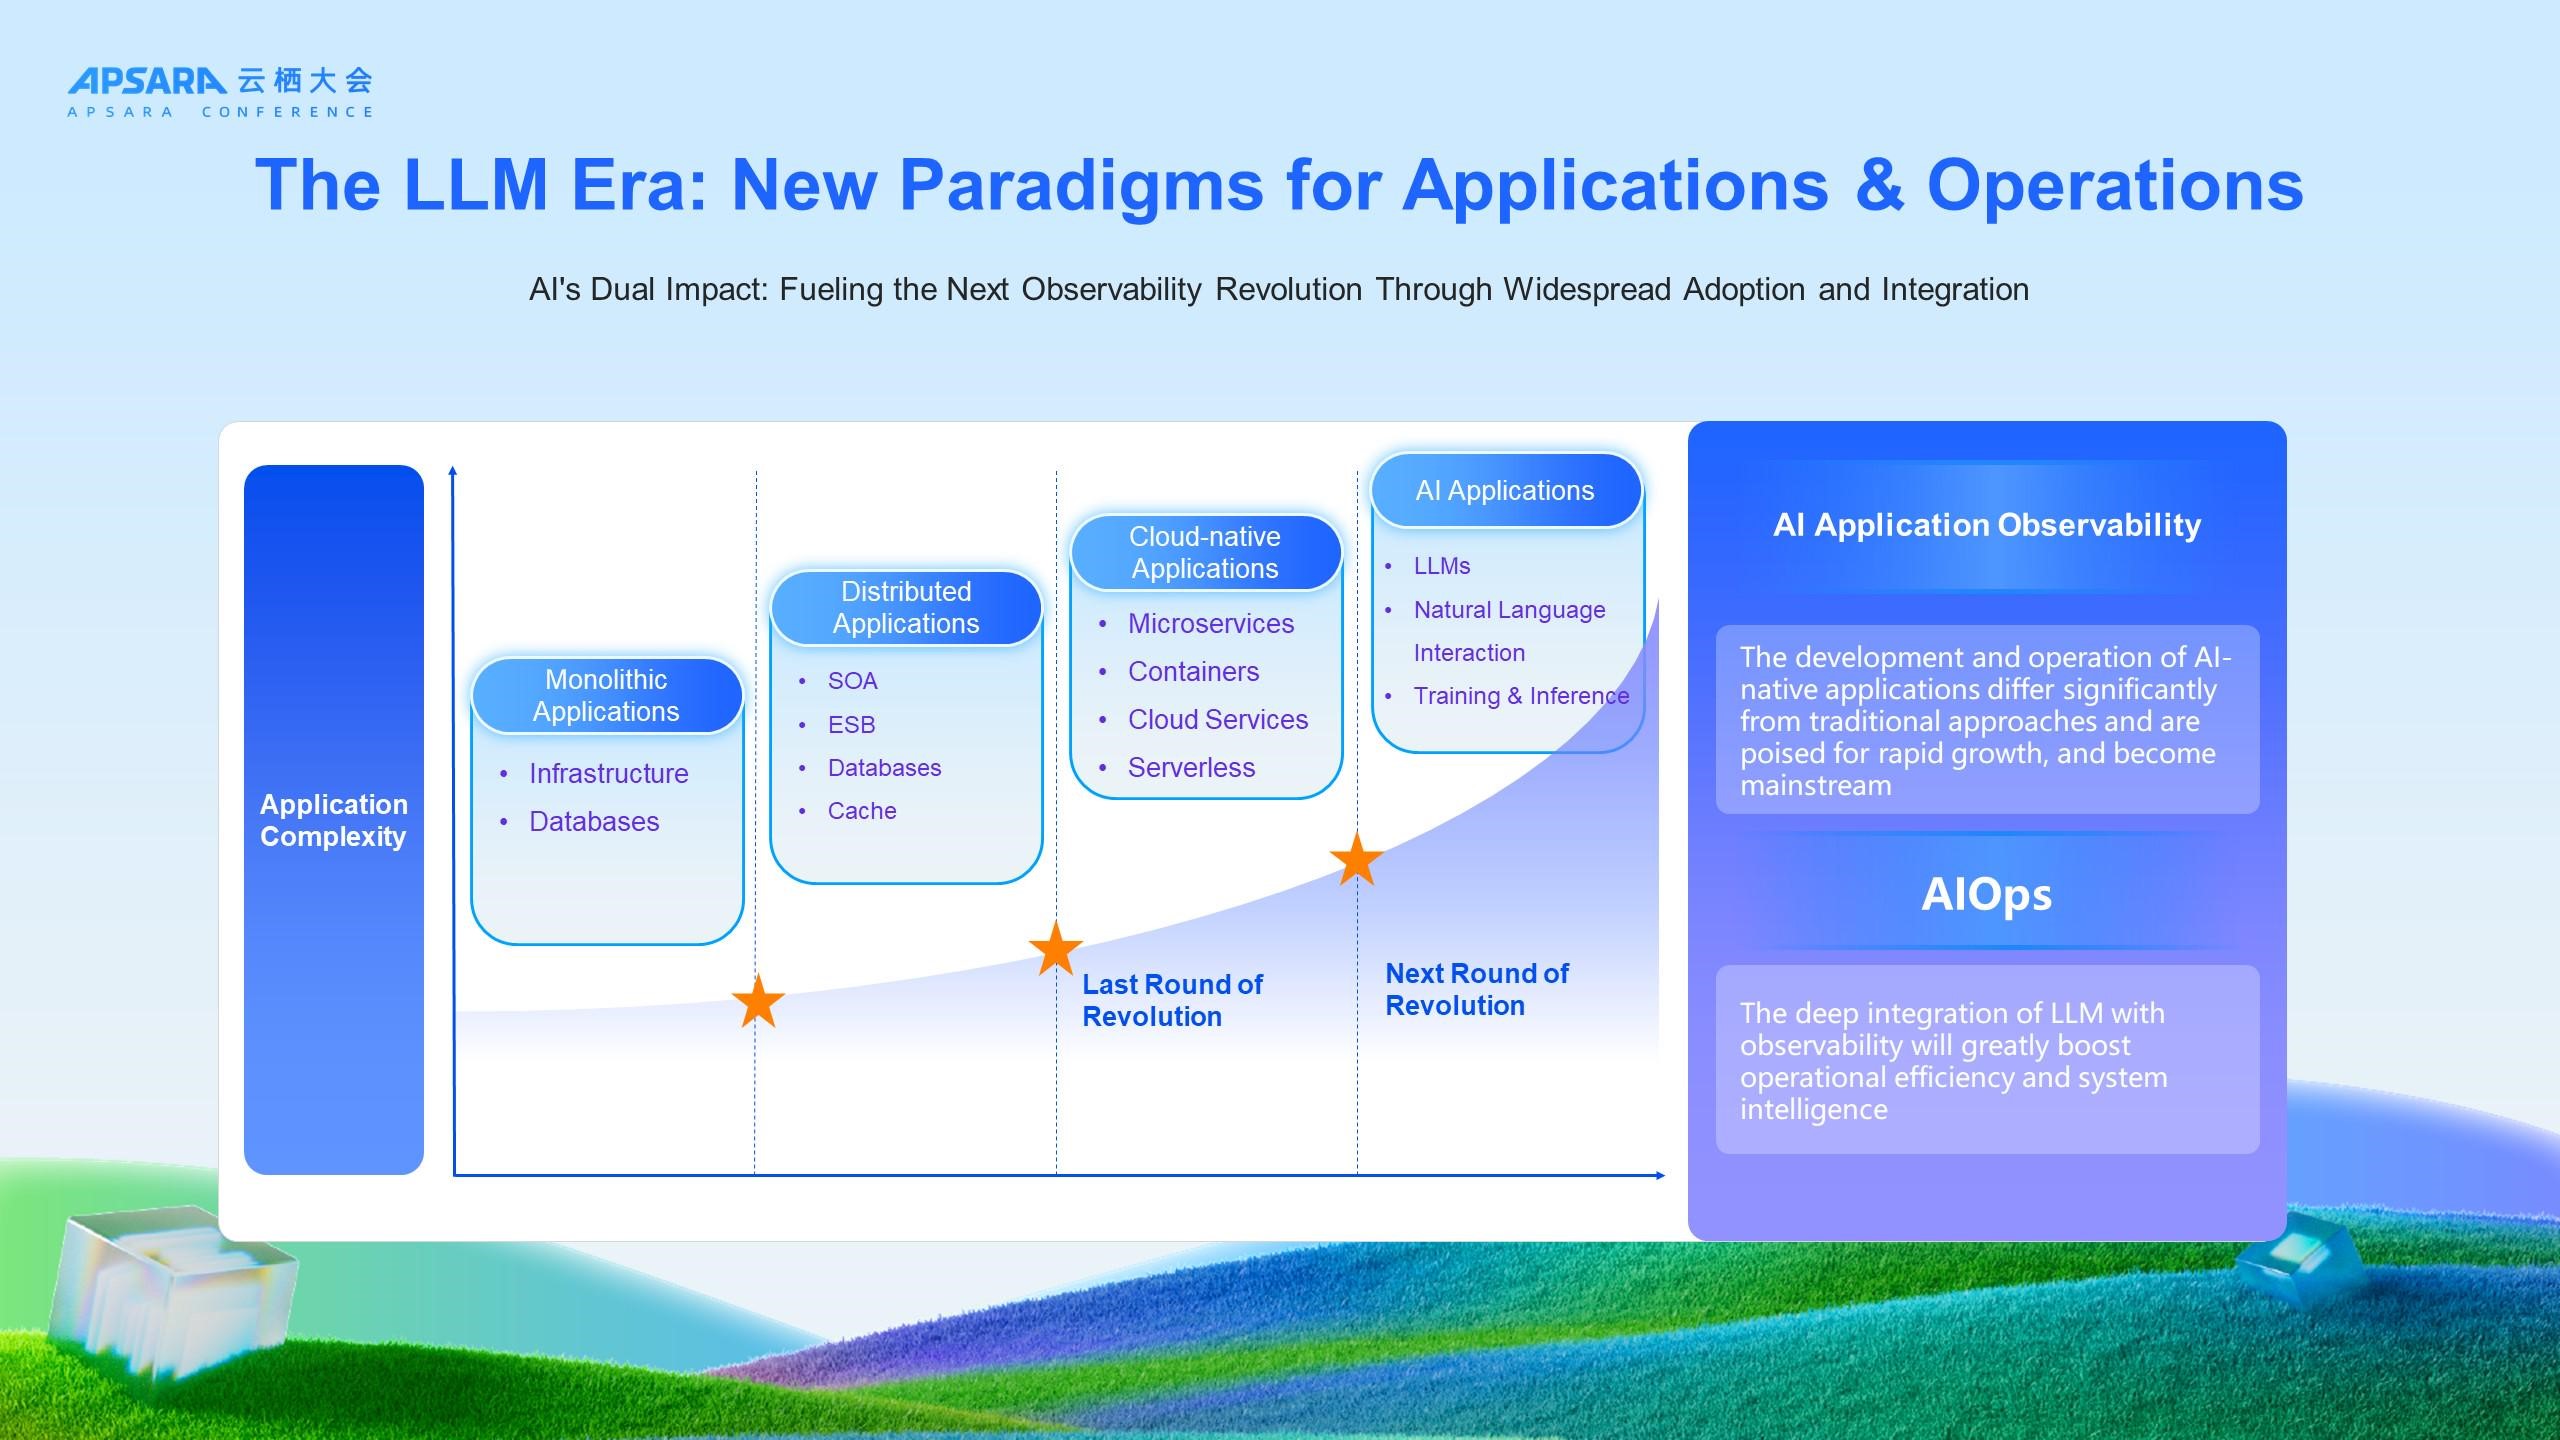
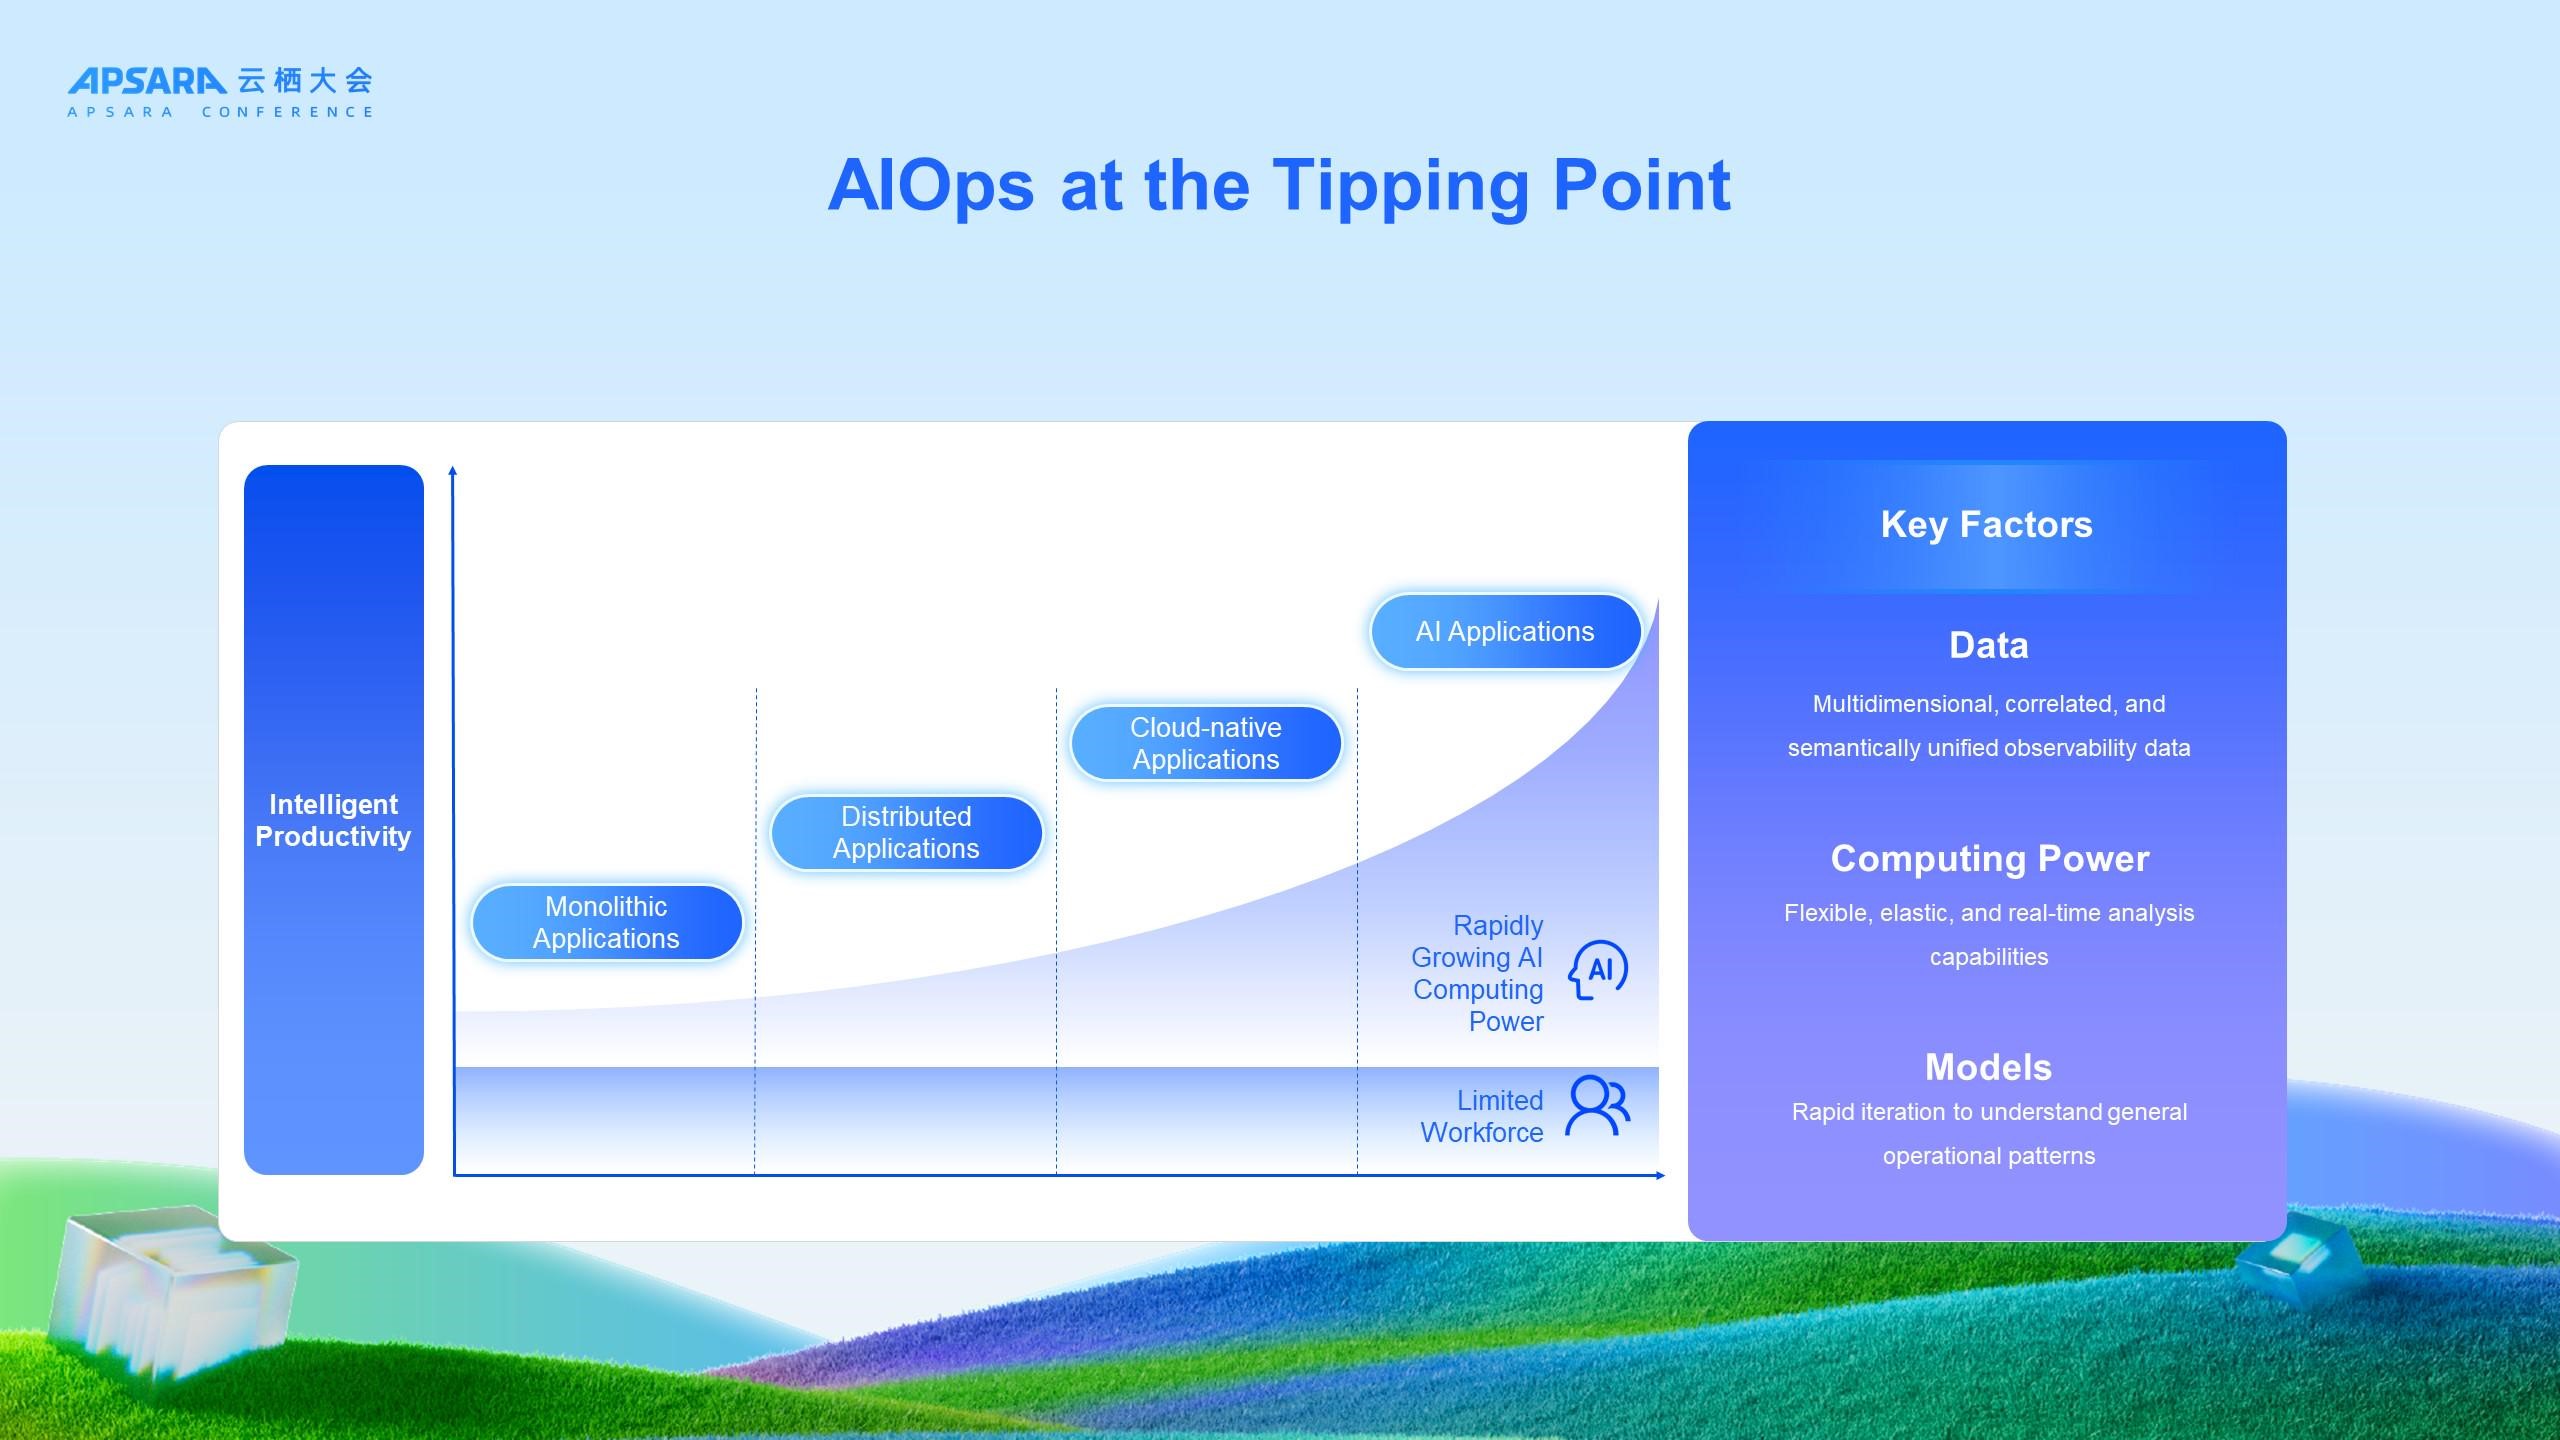
Why do we believe AIOps is approaching a tipping point? This conviction is based on the maturation of three key factors, which together form the foundation for this breakthrough:
First, high-quality data, which is the first principle of AIOps. For AI to effectively interpret and reason with it, data must be accurate, multi-dimensional, semantically unified, and interconnected. Otherwise, the axiom of "garbage in, garbage out" applies.
Second, elastic computing power. A robust, on-demand, and scalable compute and storage platform is essential for everything from processing massive volumes of real-time data to performing deep analysis for issue diagnosis. This is a core advantage of the cloud era and a challenge that has now been largely solved.
Finally, and most critically, large models. Unlike the "small models" of the past, which required extensive labeling and training, today's large models exhibit emergent capabilities in general knowledge and reasoning. This enables them to possess a genuine, generalized understanding of operational scenarios.
In the era of large models, truly satisfying these three key factors first requires addressing two daunting challenges:
● Data mastery: As observability data scales from terabytes to petabytes and even exabytes, how do we effectively harness this heterogeneous, real-time ocean of data and put it to practical use?
● Cognitive alignment: How do we bridge the gap between the general intelligence of large models and the domain-specific expertise of IT operations, enabling AI to truly "understand" our systems?
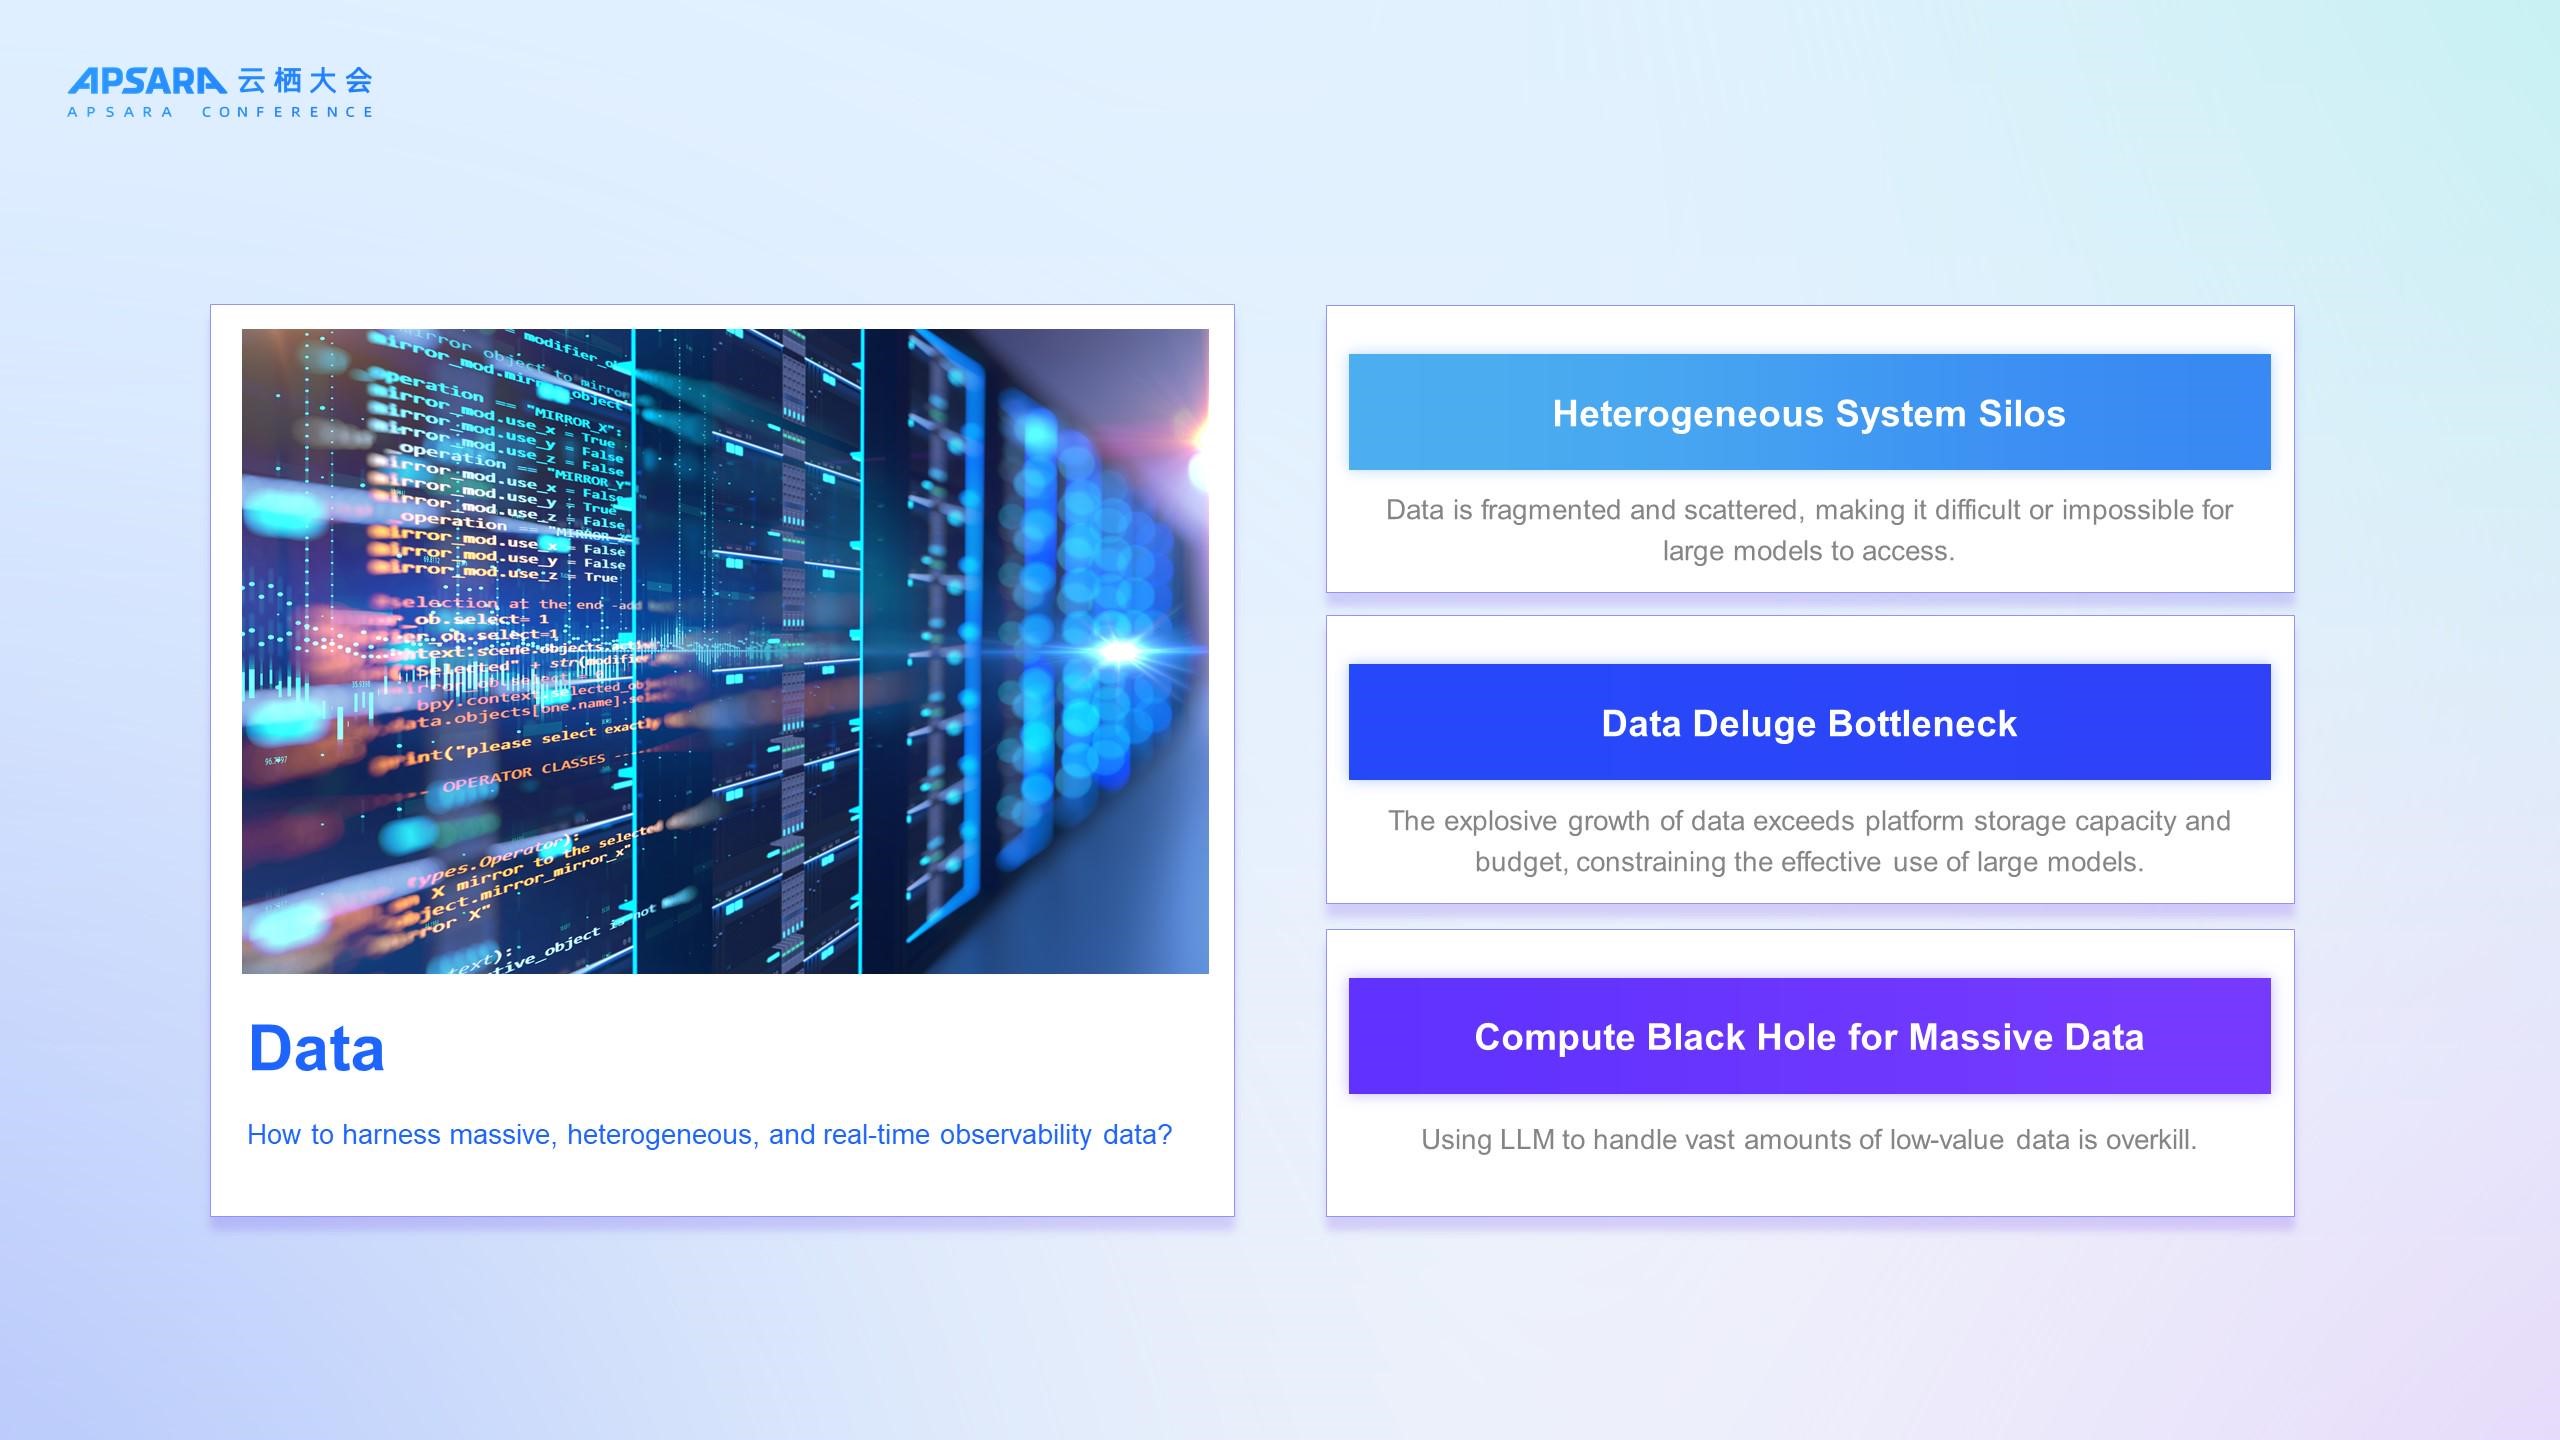
When applying AIOps to observability data, its massive, heterogeneous, and real-time nature presents three primary challenges:
● Siloed heterogeneous systems: Enterprises often operate multiple monitoring systems, each with its own distinct interfaces and access permissions. This makes it difficult for large models to perform effective cross-domain analysis. Without a complete context, root cause analysis is limited to partial information, making a successful diagnosis highly unlikely.
● Data deluge bottleneck: The explosive growth of observability data places immense pressure on platforms, creating bottlenecks for data ingestion, storage costs, and computing resources. This forces a choice: either compromise data integrity (e.g., through sampling and discarding data) or incur prohibitive costs. This "can't store, can't compute" dilemma severely limits the use of AIOps during issue analysis.
● Compute black hole for massive data: This is a classic case of a mismatched technical approach. Some attempts involve feeding raw, high-volume data of inconsistent value directly to large models (e.g., tasking a model to analyze massive system logs). This not only consumes an exorbitant amount of GPU compute but is also highly inefficient, leading to a fundamentally poor return on investment.
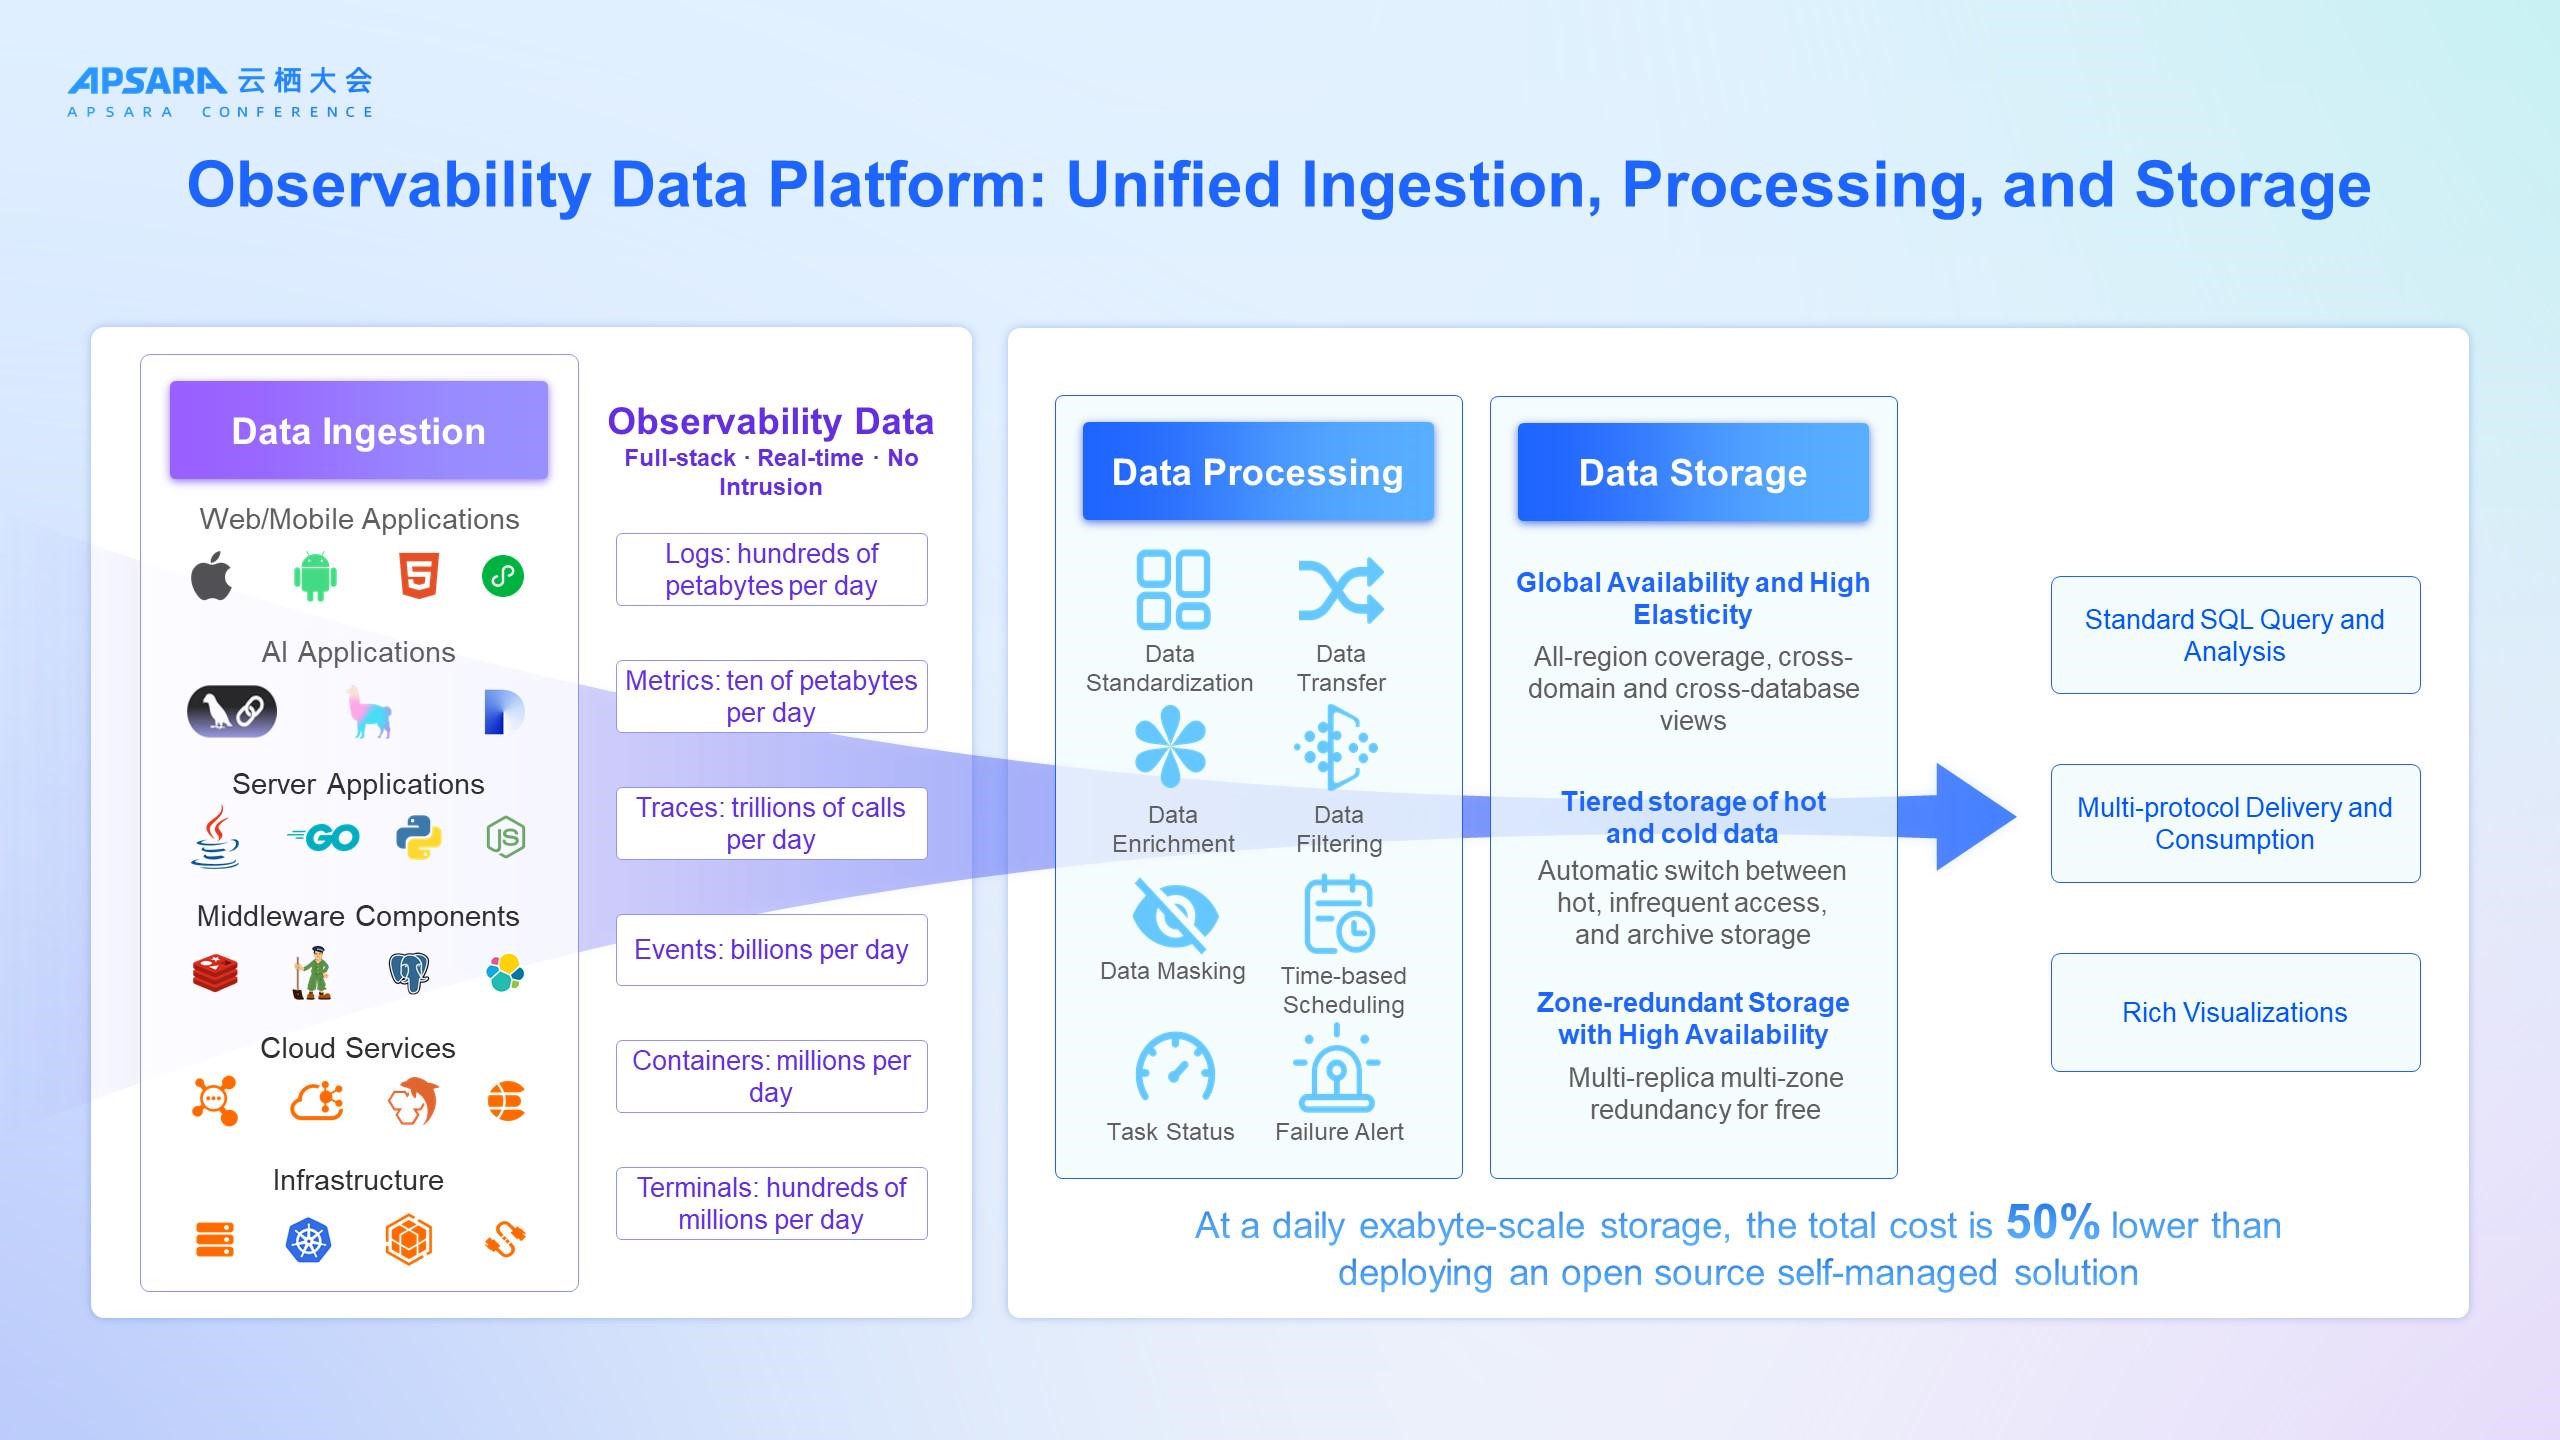
To solve the data challenge, a robust, unified observability data platform that fully supports AIOps scenarios is essential. We have built this platform with Simple Log Service (SLS) as its core engine, providing centralized management for logs, metrics, traces, events, and performance profiles. This comprehensively solves the data challenge:
● On the collection side, unified data ingestion breaks down silos. We provide full-stack, real-time, non-intrusive data collection from over 200 components, spanning mobile devices to infrastructure and traditional applications to the latest AI frameworks. This allows hundreds of petabytes of data, including logs, metrics, and traces, to be ingested into a single platform daily, providing the complete global context needed for subsequent AI analysis.
● On the server side, unified data processing and storage handle the data deluge. SLS features a globally available, highly elastic, and reliable architecture that supports exabyte-scale storage. It can execute queries across hundreds of billions of rows in seconds, perform analytics on tens of billions of rows, and handle millions of time-series computations. With rich, flexible data processing and tiered storage of hot and cold data, it ensures data integrity while reducing overall costs by more than 50% compared to self-managed solutions.
Furthermore, we adhere to open data principles, ensuring all data conforms to standard open source protocols: metrics comply with Prometheus standards, traces with OpenTelemetry, and events with CloudEvents, while all tabular models support SQL queries. Data is stored within the customer's own SLS project, granting them the freedom to perform custom analysis or export it as needed. By default, data is stored with three replicas, and in eligible regions, complimentary triple-zone redundancy is enabled, offering a level of storage reliability that is unmatched in the industry. The continuous development of this unified data platform ensures that data remains storable, highly reliable, and cost-effective.
With a unified platform in place, how do we solve the "compute black hole" problem?
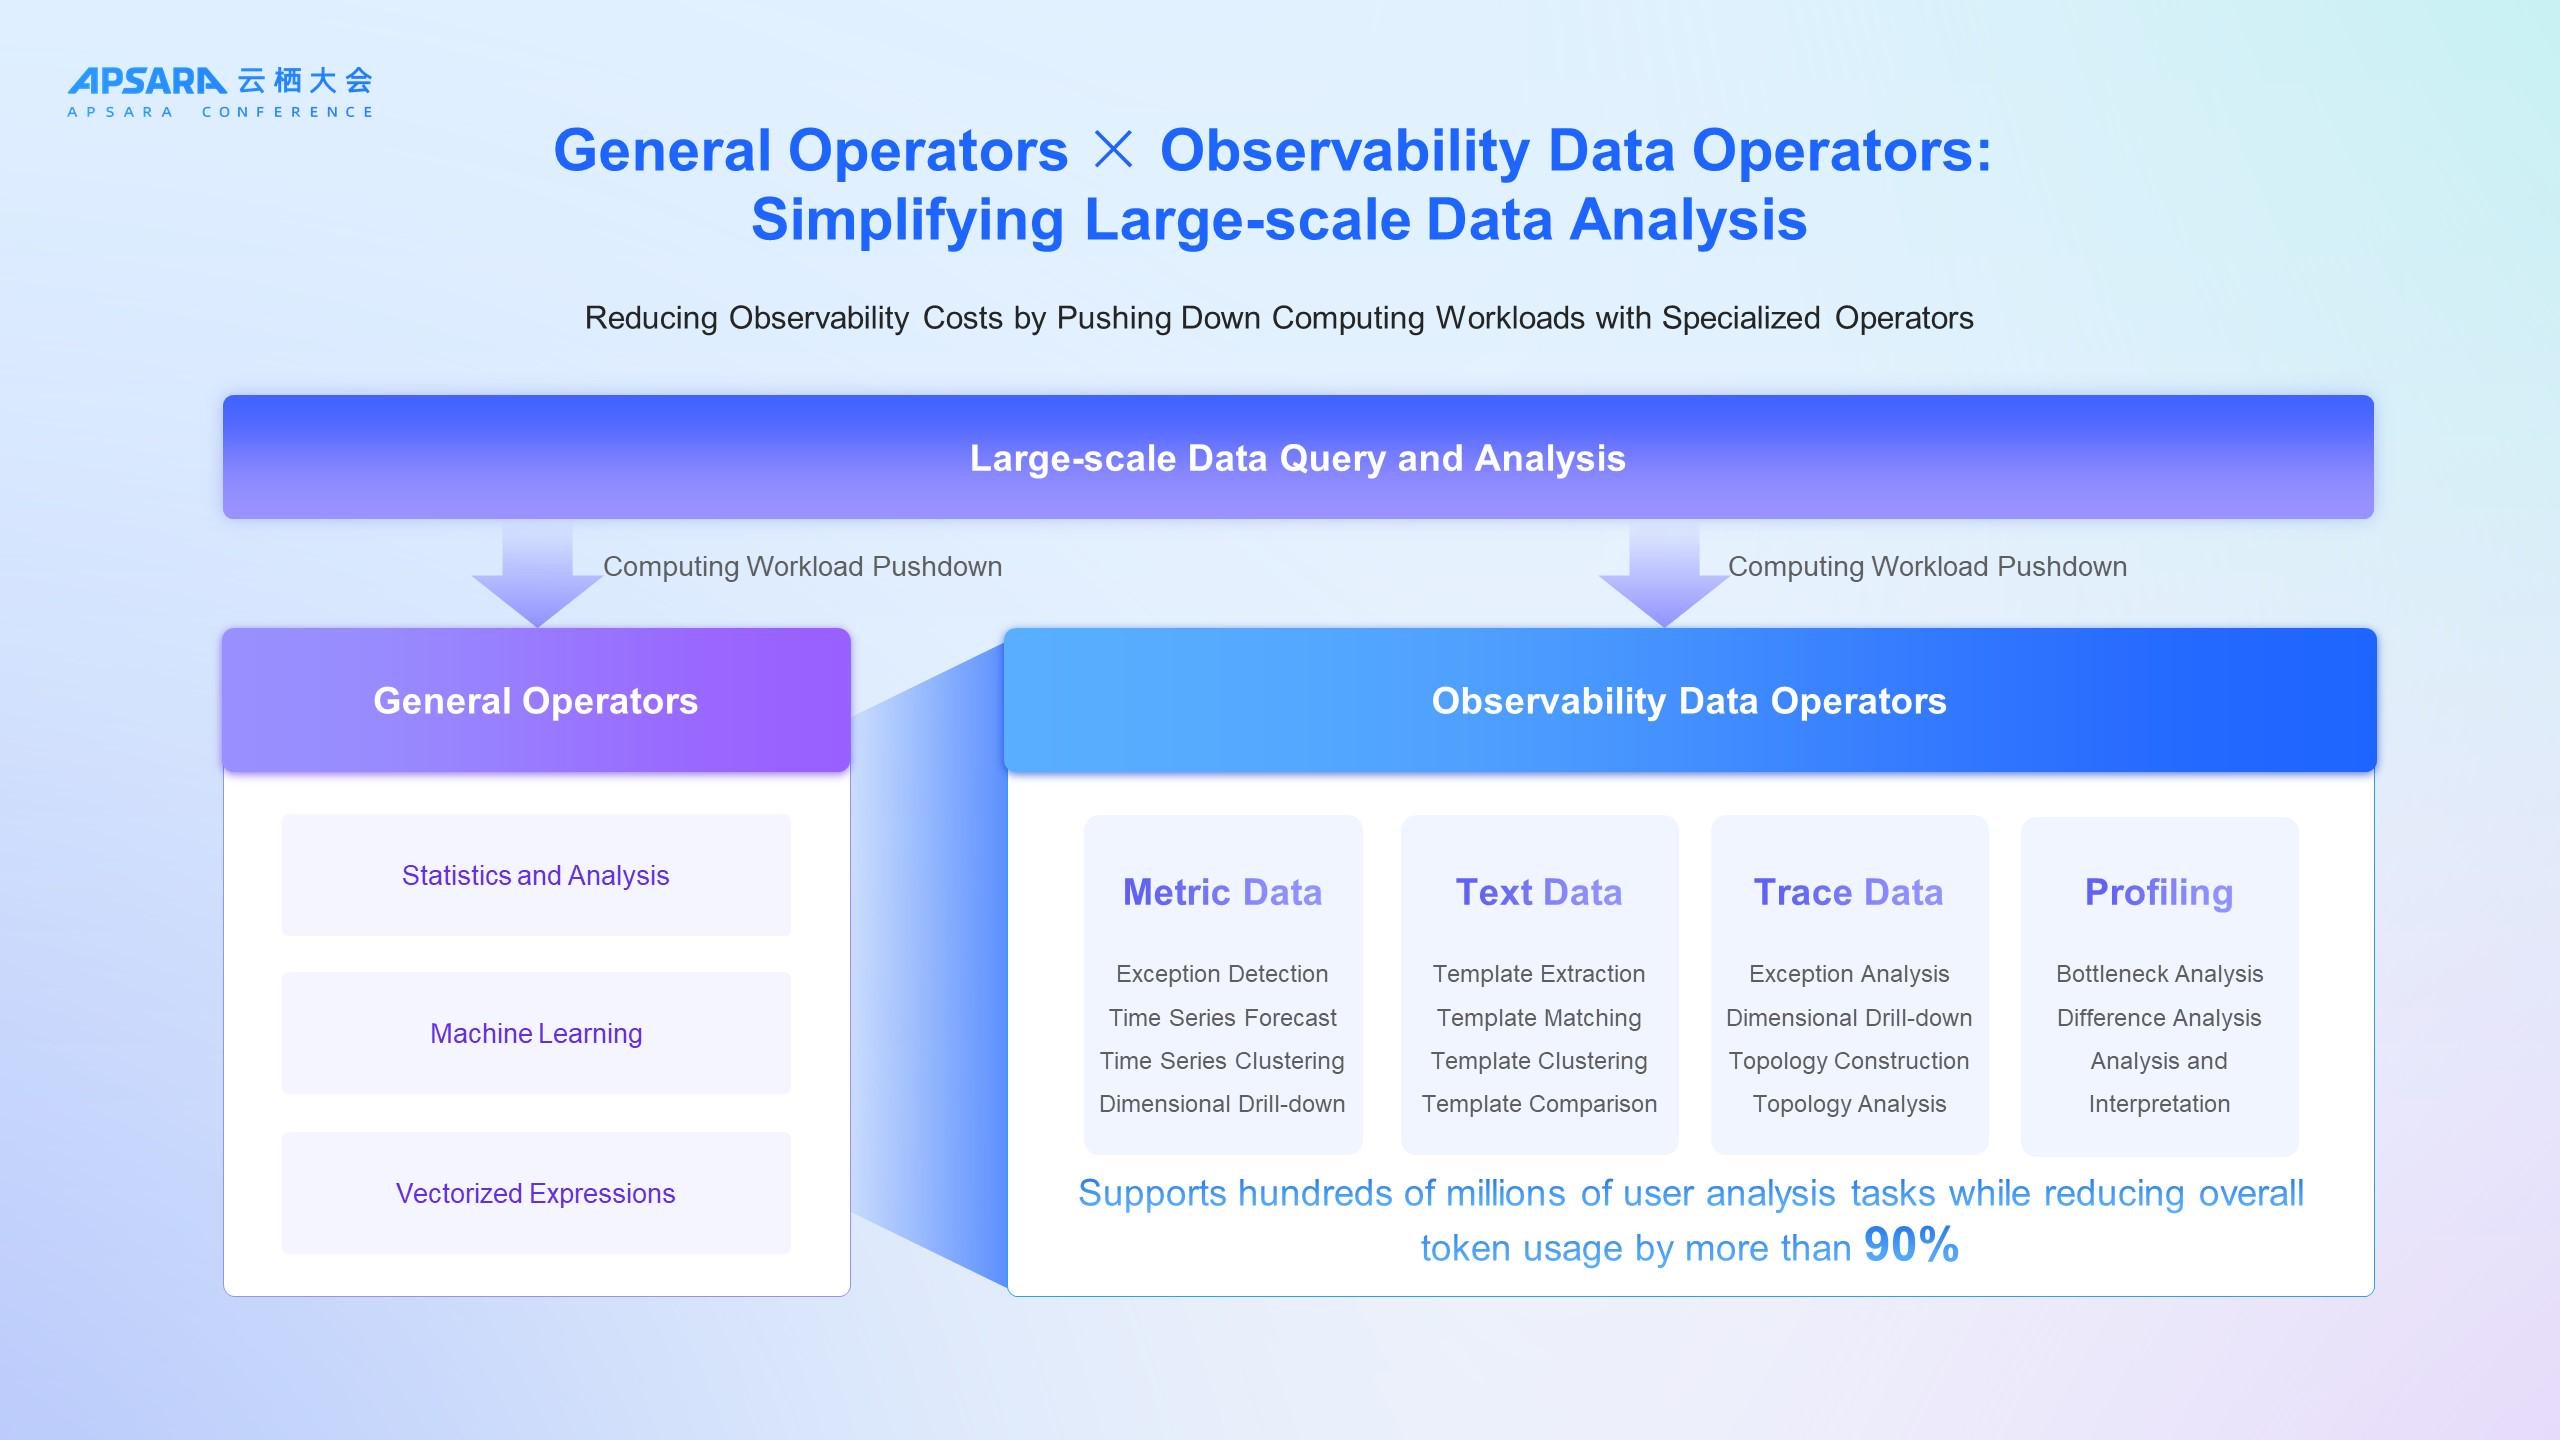
Our core principle is computing pushdown. Instead of feeding massive volumes of raw data directly to a large model, we push the model's analytical intent down to the underlying data engine for execution. To achieve this, we have built an extensive library of highly efficient, general-purpose operators and specialized observability operators. These observability operators act like surgical scalpels, each designed for a specific data scenario. For example, for metric data, we provide a rich set of operators for anomaly detection, forecasting, clustering, and dimensional drill-down; for trace data, we provide specialized operators for anomaly analysis, dimensional drill-down, and for constructing and comparing topologies across multiple call chains. Consequently, in practice, the large model acts as an intelligent orchestrator. Upon receiving a task, it invokes these powerful operators to preprocess data and extract key features directly at the source. Only this high-value, preprocessed information is then submitted to the large model for final inference and decision-making.
This approach perfectly combines the reasoning power of large models with the platform's robust data processing capabilities, dramatically reducing token consumption by over 90% and making AIOps both highly efficient and economically viable.
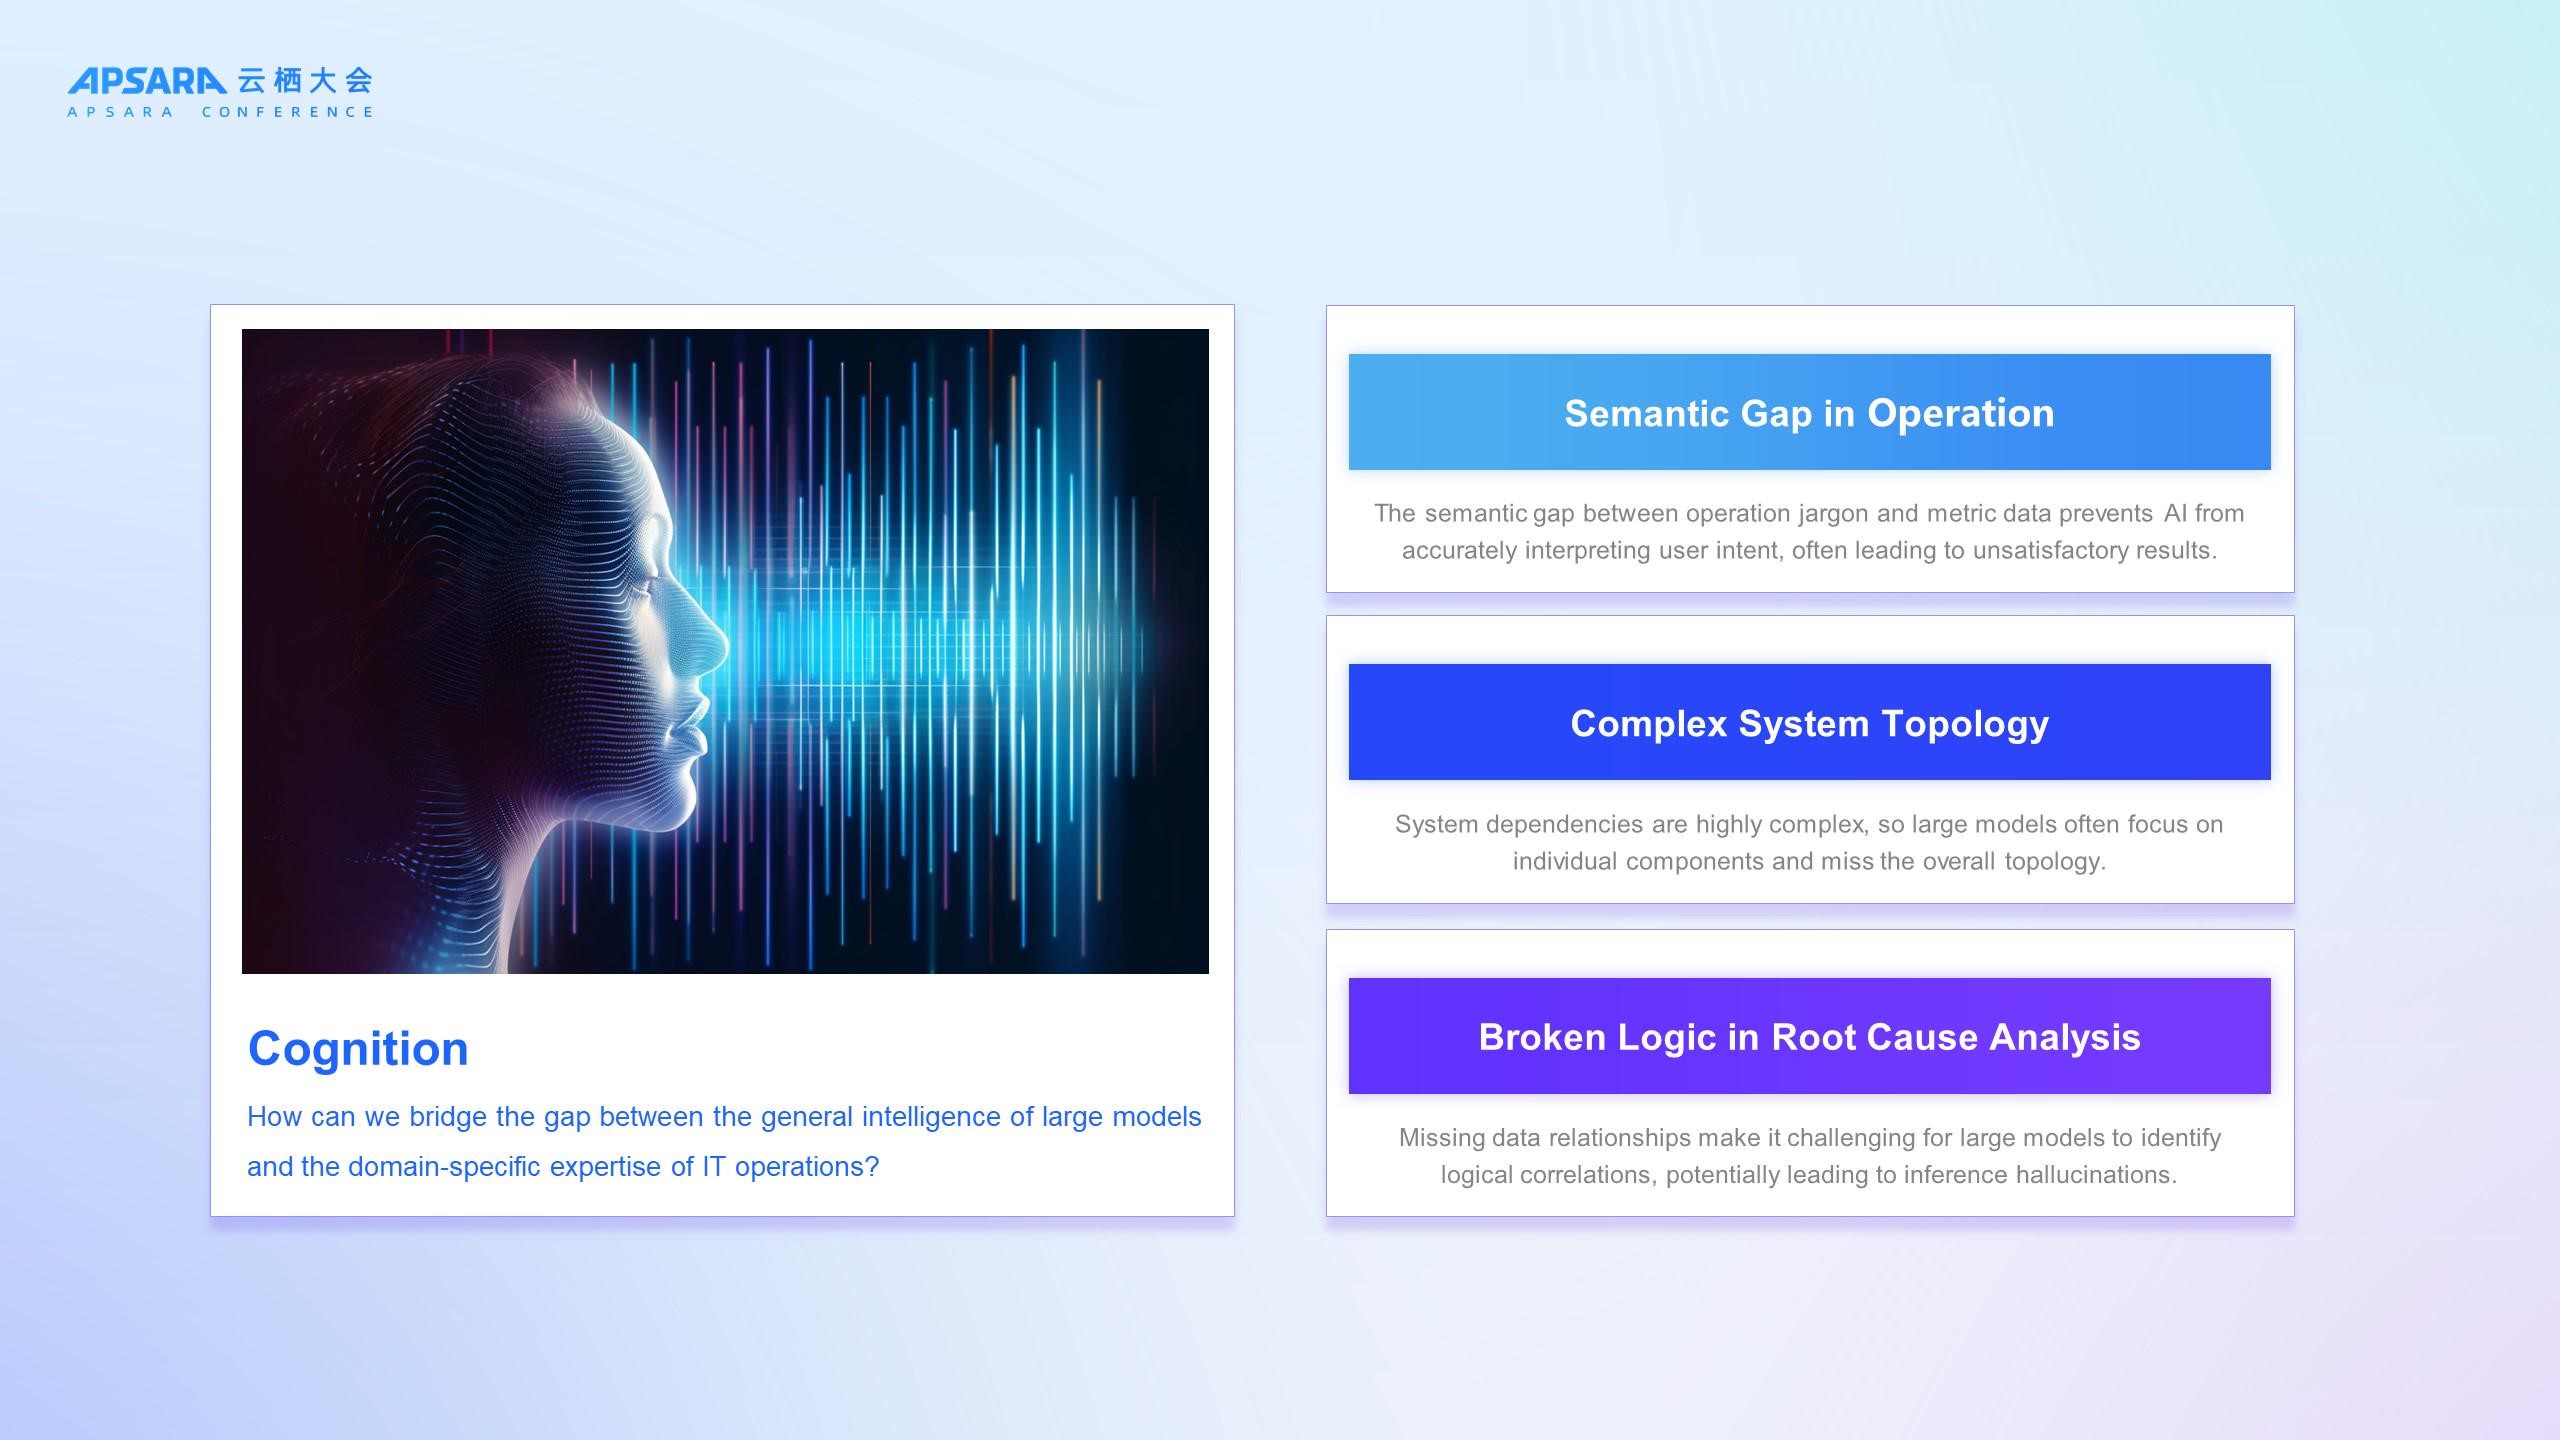
Having addressed the data challenge, we now confront the second and deeper hurdle for AIOps: the problem of cognition. This is fundamentally about how to bridge the gap between the general intelligence of large models and the domain-specific expertise of IT operations. Specifically, this manifests as three primary challenges:
● Semantic gap in IT operations: A user might ask, "Is the service experiencing jitter? Is the database healthy? Are there any CPU spikes?" A large model, however, does not understand the operational meaning of "jitter," the definition of "healthy," or the threshold for a "spike." This semantic gap between operational jargon and raw metric data prevents the AI from accurately interpreting user intent, leading to unsatisfactory results.
● Complex system topology: Modern IT systems are defined by their intricate interdependencies. Lacking an awareness of this topology, a large model perceives each data point in isolation, failing to discern the critical relationships between connected data and nodes.
● Fragmented logic in root cause analysis: Effective root cause analysis hinges on establishing a complete chain of causal logic. When faced with discrete or fragmented data, however, large models are prone to inference errors and "hallucinations," preventing them from arriving at reliable diagnostic conclusions.
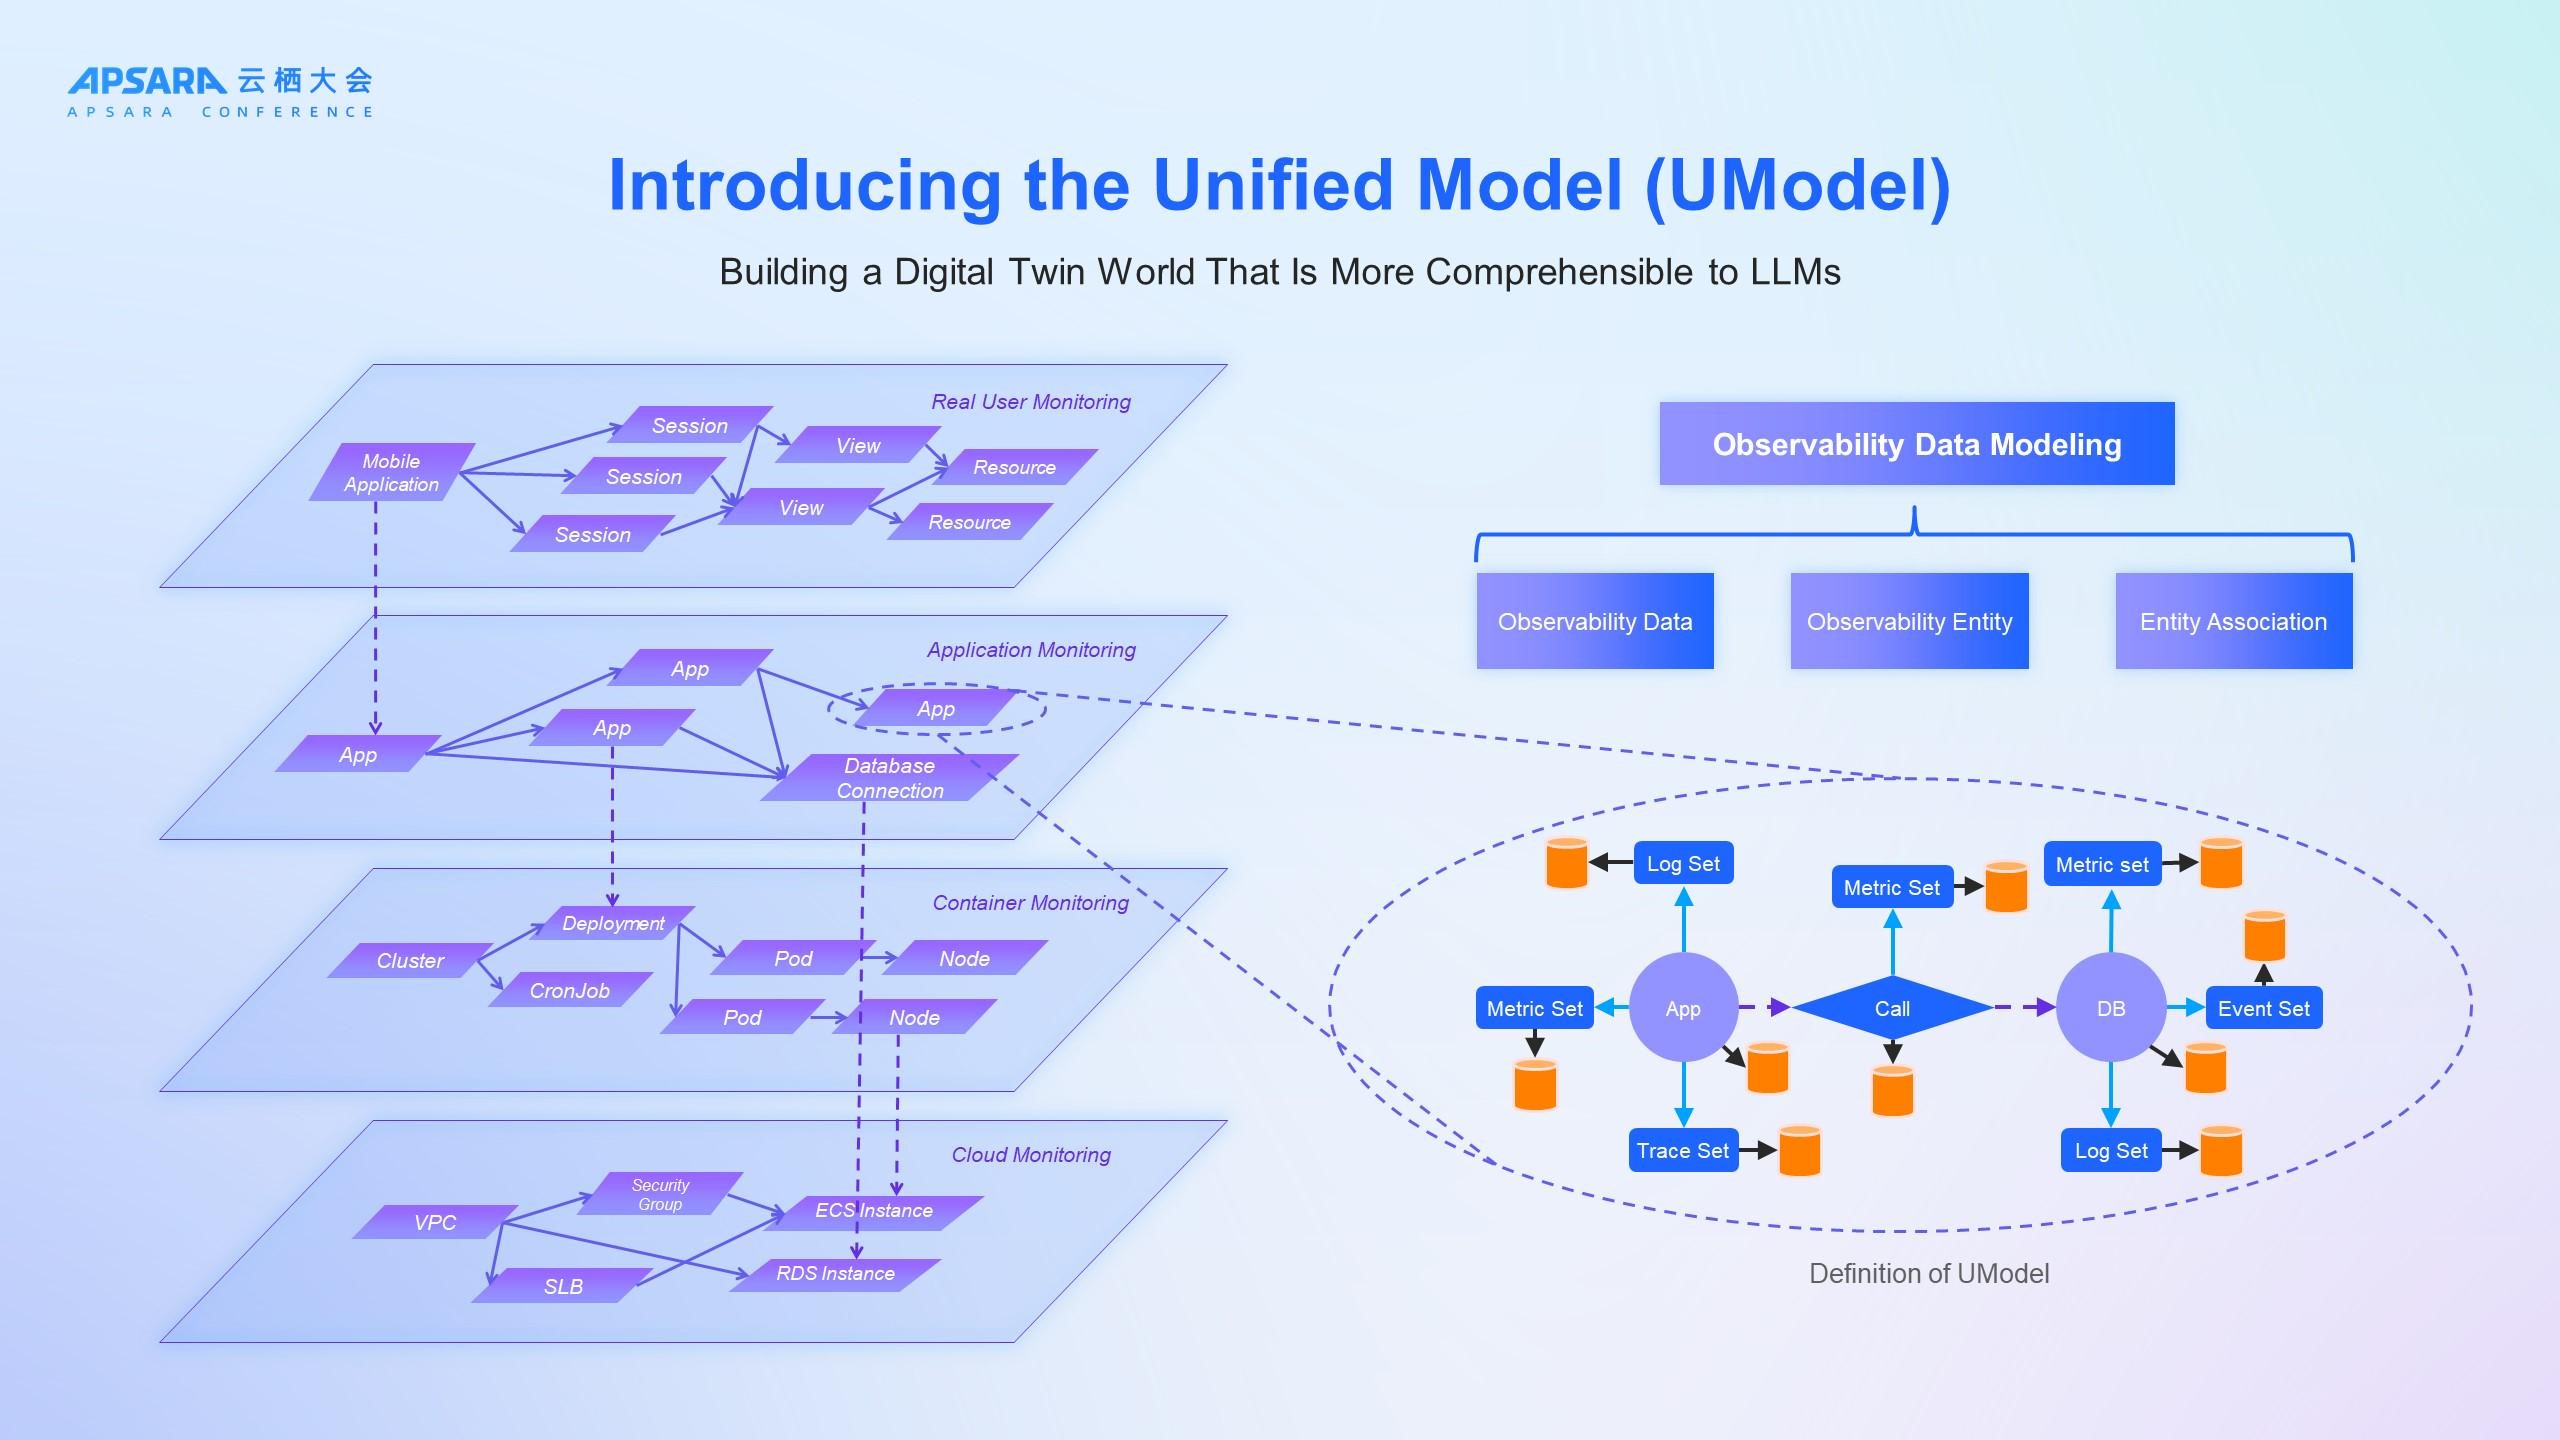
How do we solve these cognitive challenges? Our answer lies not in endlessly training ever-larger operational models, but in building for them a more interpretable digital twin of their IT environment. At the core of this twin is UModel, the Unified Model. It provides a standard definition for observability entities and their relationships, enabling us to construct a digital twin of the entire IT stack—from user experience and application services down to containers and underlying infrastructure. With this dynamic topology, troubleshooting is transformed. For example, when an application reports an error, we can drill down from the application to the slow SQL statement causing the problem and then to the specific database instance, or pivot to the related Kubernetes pod and node. Tasks that once required tedious manual hops and cross-system correlation can now be completed seamlessly within a single, unified view.
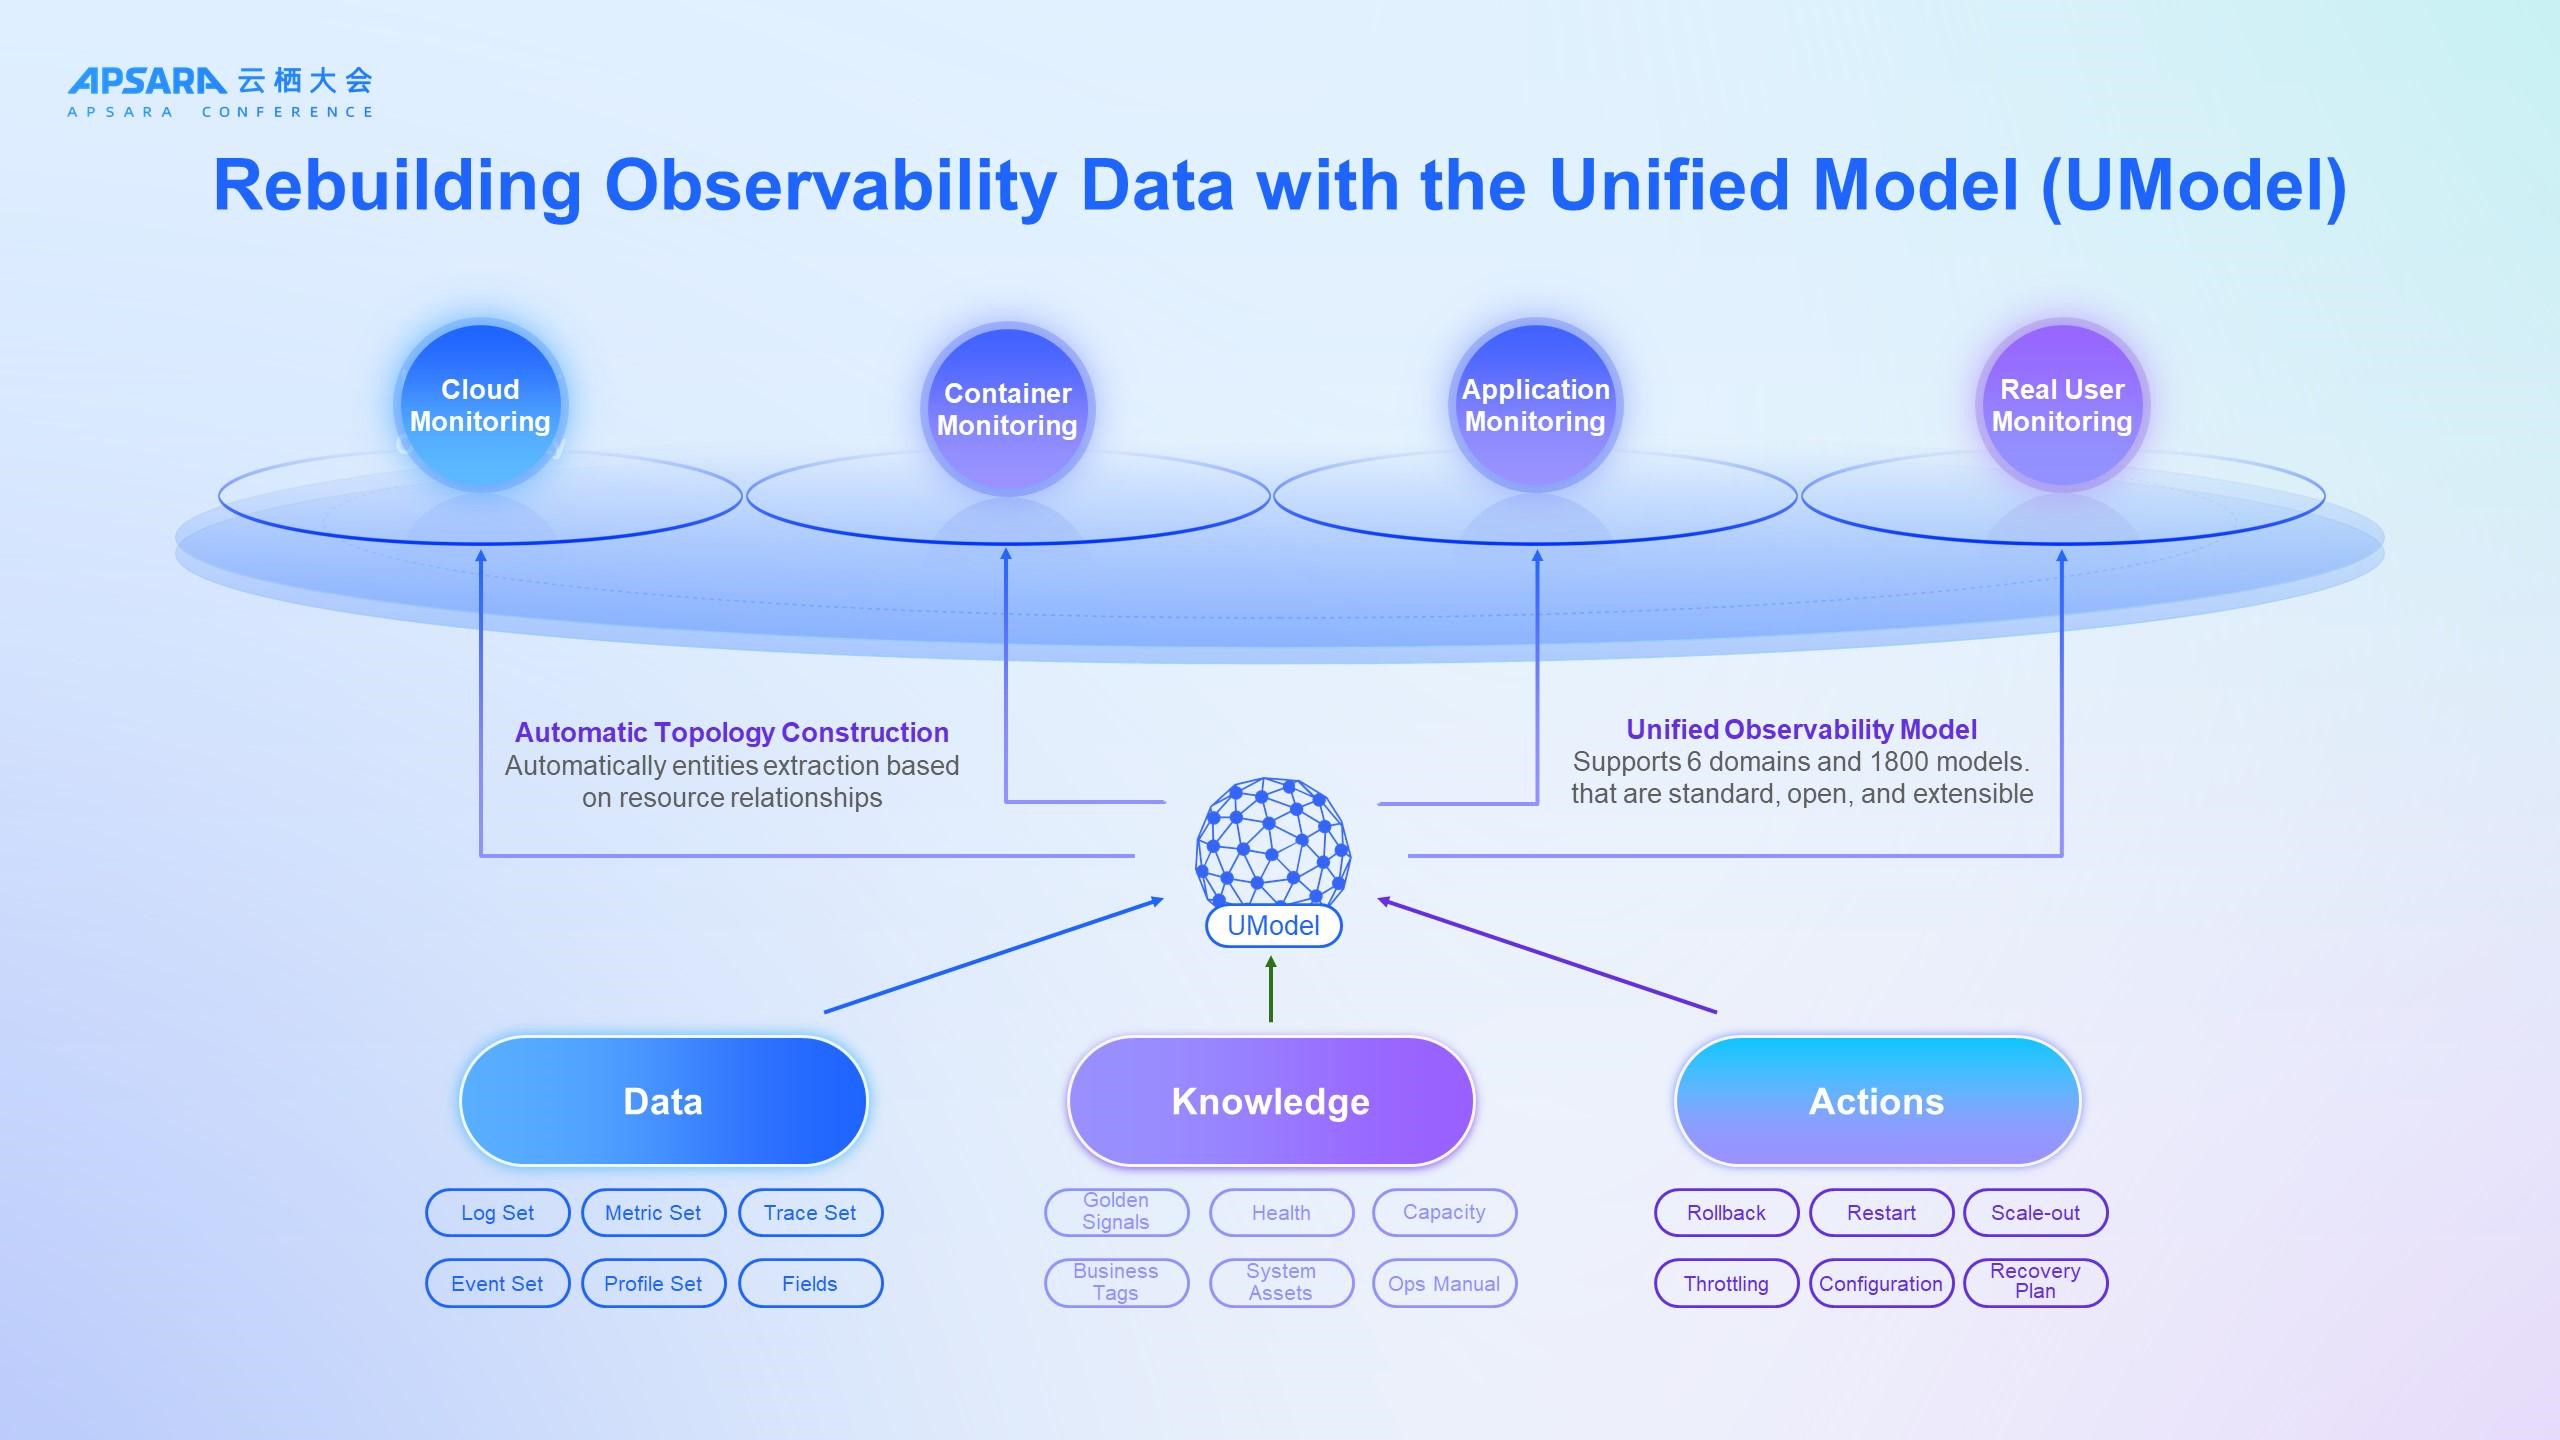
Based on UModel, we now cover six core domains with over 1,800 models, all of which are fully open and extensible. Its true revolutionary impact lies in how it redefines the observability paradigm by binding together the three core elements of data, knowledge, and action:
● Data: It defines the entities themselves ("what") and the relationships that connect them ("how").
● Knowledge: It embeds domain expertise—such as golden metrics, health status, usage levels, and operational runbooks—directly onto each entity. This bridges the semantic gap, enabling the AI to understand what "service jitter" truly means.
● Action: It associates executable operations, such as rollbacks, restarts, or scaling actions, with entities, effectively giving the AI a toolkit to use when responding to problems.
This way, UModel becomes far more than a simple topology map. It provides the large model with complete context, empowering it to evolve into a "digital site reliability engineer (SRE)" that can understand, reason, and act. This marks a pivotal step in rebuilding observability and unlocking a new paradigm for AIOps.
Before the demo, let's begin with a core concept: entity. If UModel is analogous to a class in object-oriented programming, then an entity is its instantiated instance—a specific Elastic Compute Service (ECS) instance, a particular ApsaraDB RDS database, or a running application. In essence, an entity is the fundamental, real-world unit within our observable universe.
Now, this demo showcases three core topology views built upon UModel and its entities:
● UModel exploration: This is the design blueprint for the entire observability domain. It defines entities like "Applications," "Kubernetes clusters," and "ECS instances," specifying their attributes, their relationships, and the metrics, logs, and traces attached to them. This serves as the foundation for unified observability in v2.0.
● Global entity topology: This view acts as a global IT asset map, aggregating all entities by type. It provides technical leaders with a comprehensive, top-level view of all resources and their observability coverage, making it the ideal perspective for strategic oversight and inventory.
● Application entity topology: This is a "traffic topology" map designed for solution architects and application SREs. It lays out each application entity, clearly revealing all dependencies and traffic flows, enabling them to analyze cross-application impact and troubleshoot issues with a bird's-eye view.
This demo illustrates a typical real-world incident investigation, conducted entirely within the Cloud Monitor 2.0 console. Let's quickly walk through the diagnostic process.The investigation began with an alert: a sudden spike in the gateway application's API latency. Instead of manually combing through massive logs or metrics, we leveraged the entity topology automatically constructed by Cloud Monitor 2.0, which provided an immediate bird's-eye view of the system. The diagnostic path was clear: starting from the gateway application, we followed the topology's call relationships to the order application, then to the database client, and finally crossed the application boundary to the database server. There, by inspecting the slow SQL logs, we pinpointed the root cause: an unoptimized SQL statement in a recent application release had caused an index failure, creating a database bottleneck with CPU usage near 100%. One detail is worth noting: while the database listed hundreds of slow SQL queries, our log clustering algorithm revealed that they all boiled down to just three distinct patterns, greatly simplifying the diagnosis. The next step was to determine when this issue was introduced and by which version. Leveraging the topology's powerful linkage capabilities, we drilled down from the application into its Kubernetes environment—following the path from Deployment to Namespace to Kubernetes cluster—and successfully located the corresponding release audit logs, pinpointing the exact image version that caused the problem. This is a classic example of a business service incident. At last year's Apsara Conference, I demonstrated a similar scenario where my primary weapon for investigation was tracing. While tracing is undoubtedly an invaluable tool for tracking issues that follow a request path, its effectiveness is largely confined to the "world of traffic." It falls short when an issue's root cause crosses the boundary between the application and its underlying infrastructure, such as a Kubernetes deployment.
In contrast, the core capability demonstrated here is the unified entity topology generated by UModel. Its greatest value is its ability to break down these silos, connecting applications, middleware, and databases not only to each other but also to ApsaraDB RDS instances, and even down to the underlying Kubernetes resources and ECS instances—all within a single, unified graph. With this, our investigation is no longer confined to tracing. Instead, it becomes a global, multi-dimensional exploration, allowing us to freely navigate and drill down across the entire system.
Finally, I want to share the deeper thinking behind this demo. Every click and drill-down you see in the console is designed to simulate the very reasoning process our AIOps uses for root cause analysis.
Our goal for AIOps is clear and unwavering: if an engineer can clearly diagnose a problem within our console, then the AI, driven by UModel and a large model, should be able to resolve it automatically and intelligently. This is the principle we adhere to. In other words, the design philosophy of Cloud Monitor 2.0 is to enable the large model to see what we see and do what we do. Rebuilding the product is about creating a shared interface or layer where users and the AI can collaborate and understand one another. Just as autonomous driving requires a long development process with human-AI co-driving as a necessary phase, AIOps cannot achieve full automation overnight. It will take significant time to refine, and assisted operations remain an essential intermediate stage. Currently, the intelligence of large models and their ability to replicate what a user sees and does are still far from this ultimate vision. Nevertheless, guided by this philosophy, we believe the thought process for solving complex problems can become simpler and more intuitive, allowing the capabilities of large models to gradually converge on the level we envision.
If UModel provides the skeleton for the observable world, our newly upgraded AIOps Agent is the intelligent brain that brings it to life. Its interaction model has been completely reshaped. Users can summon the Agent with natural language at any time, from any interface within Cloud Monitor 2.0. With its full-context awareness, a user can simply select a cluster ("add to context") and ask, "Has this cluster been stable recently? List the error rates for the services running on it." The Agent immediately understands the intent and begins its analysis, making the interaction both precise and efficient. More importantly, its core is fundamentally different. We have completely abandoned traditional AIOps driven by rigid rules or workflows. The AIOps Agent leverages an Agentic architecture, enabling it to autonomously plan, invoke tools, execute tasks, and reflect on outcomes—all guided by large models. This empowers it to tackle a broader range of open-ended and novel operational challenges.
This marks a paradigm shift from an era of "humans adapting to tools" to a new AIOps paradigm of "tools adapting to humans."
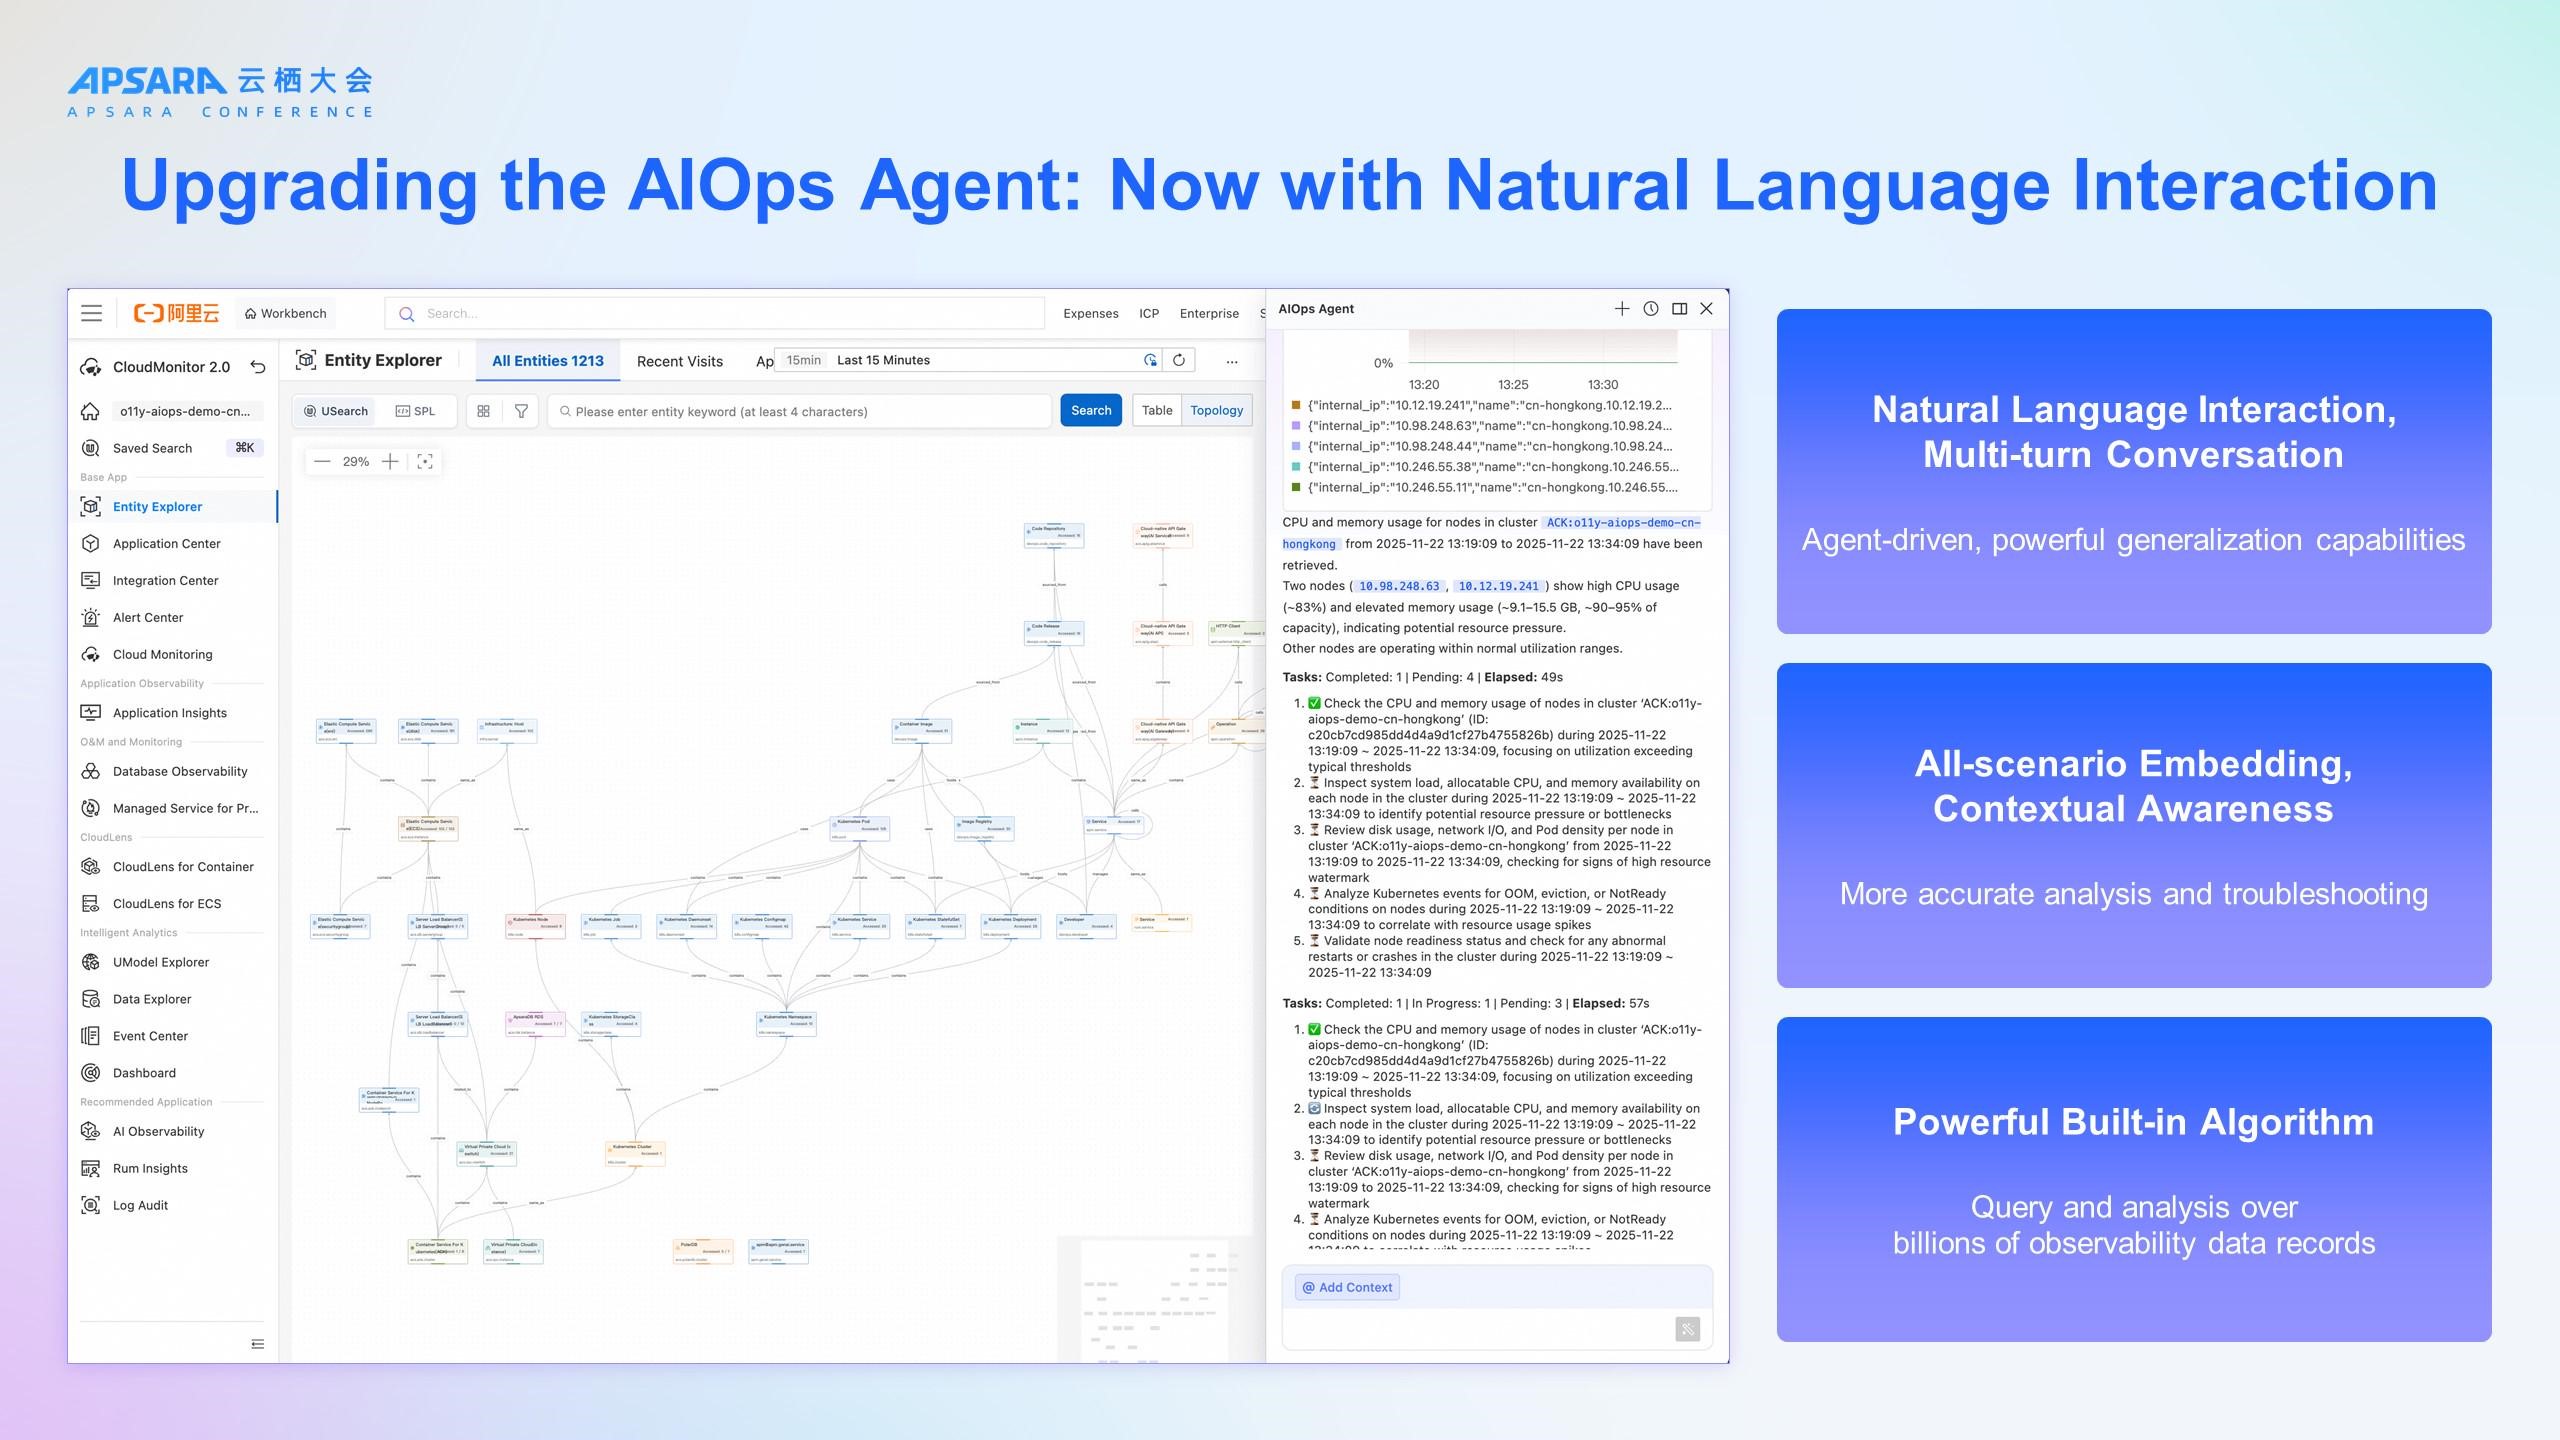
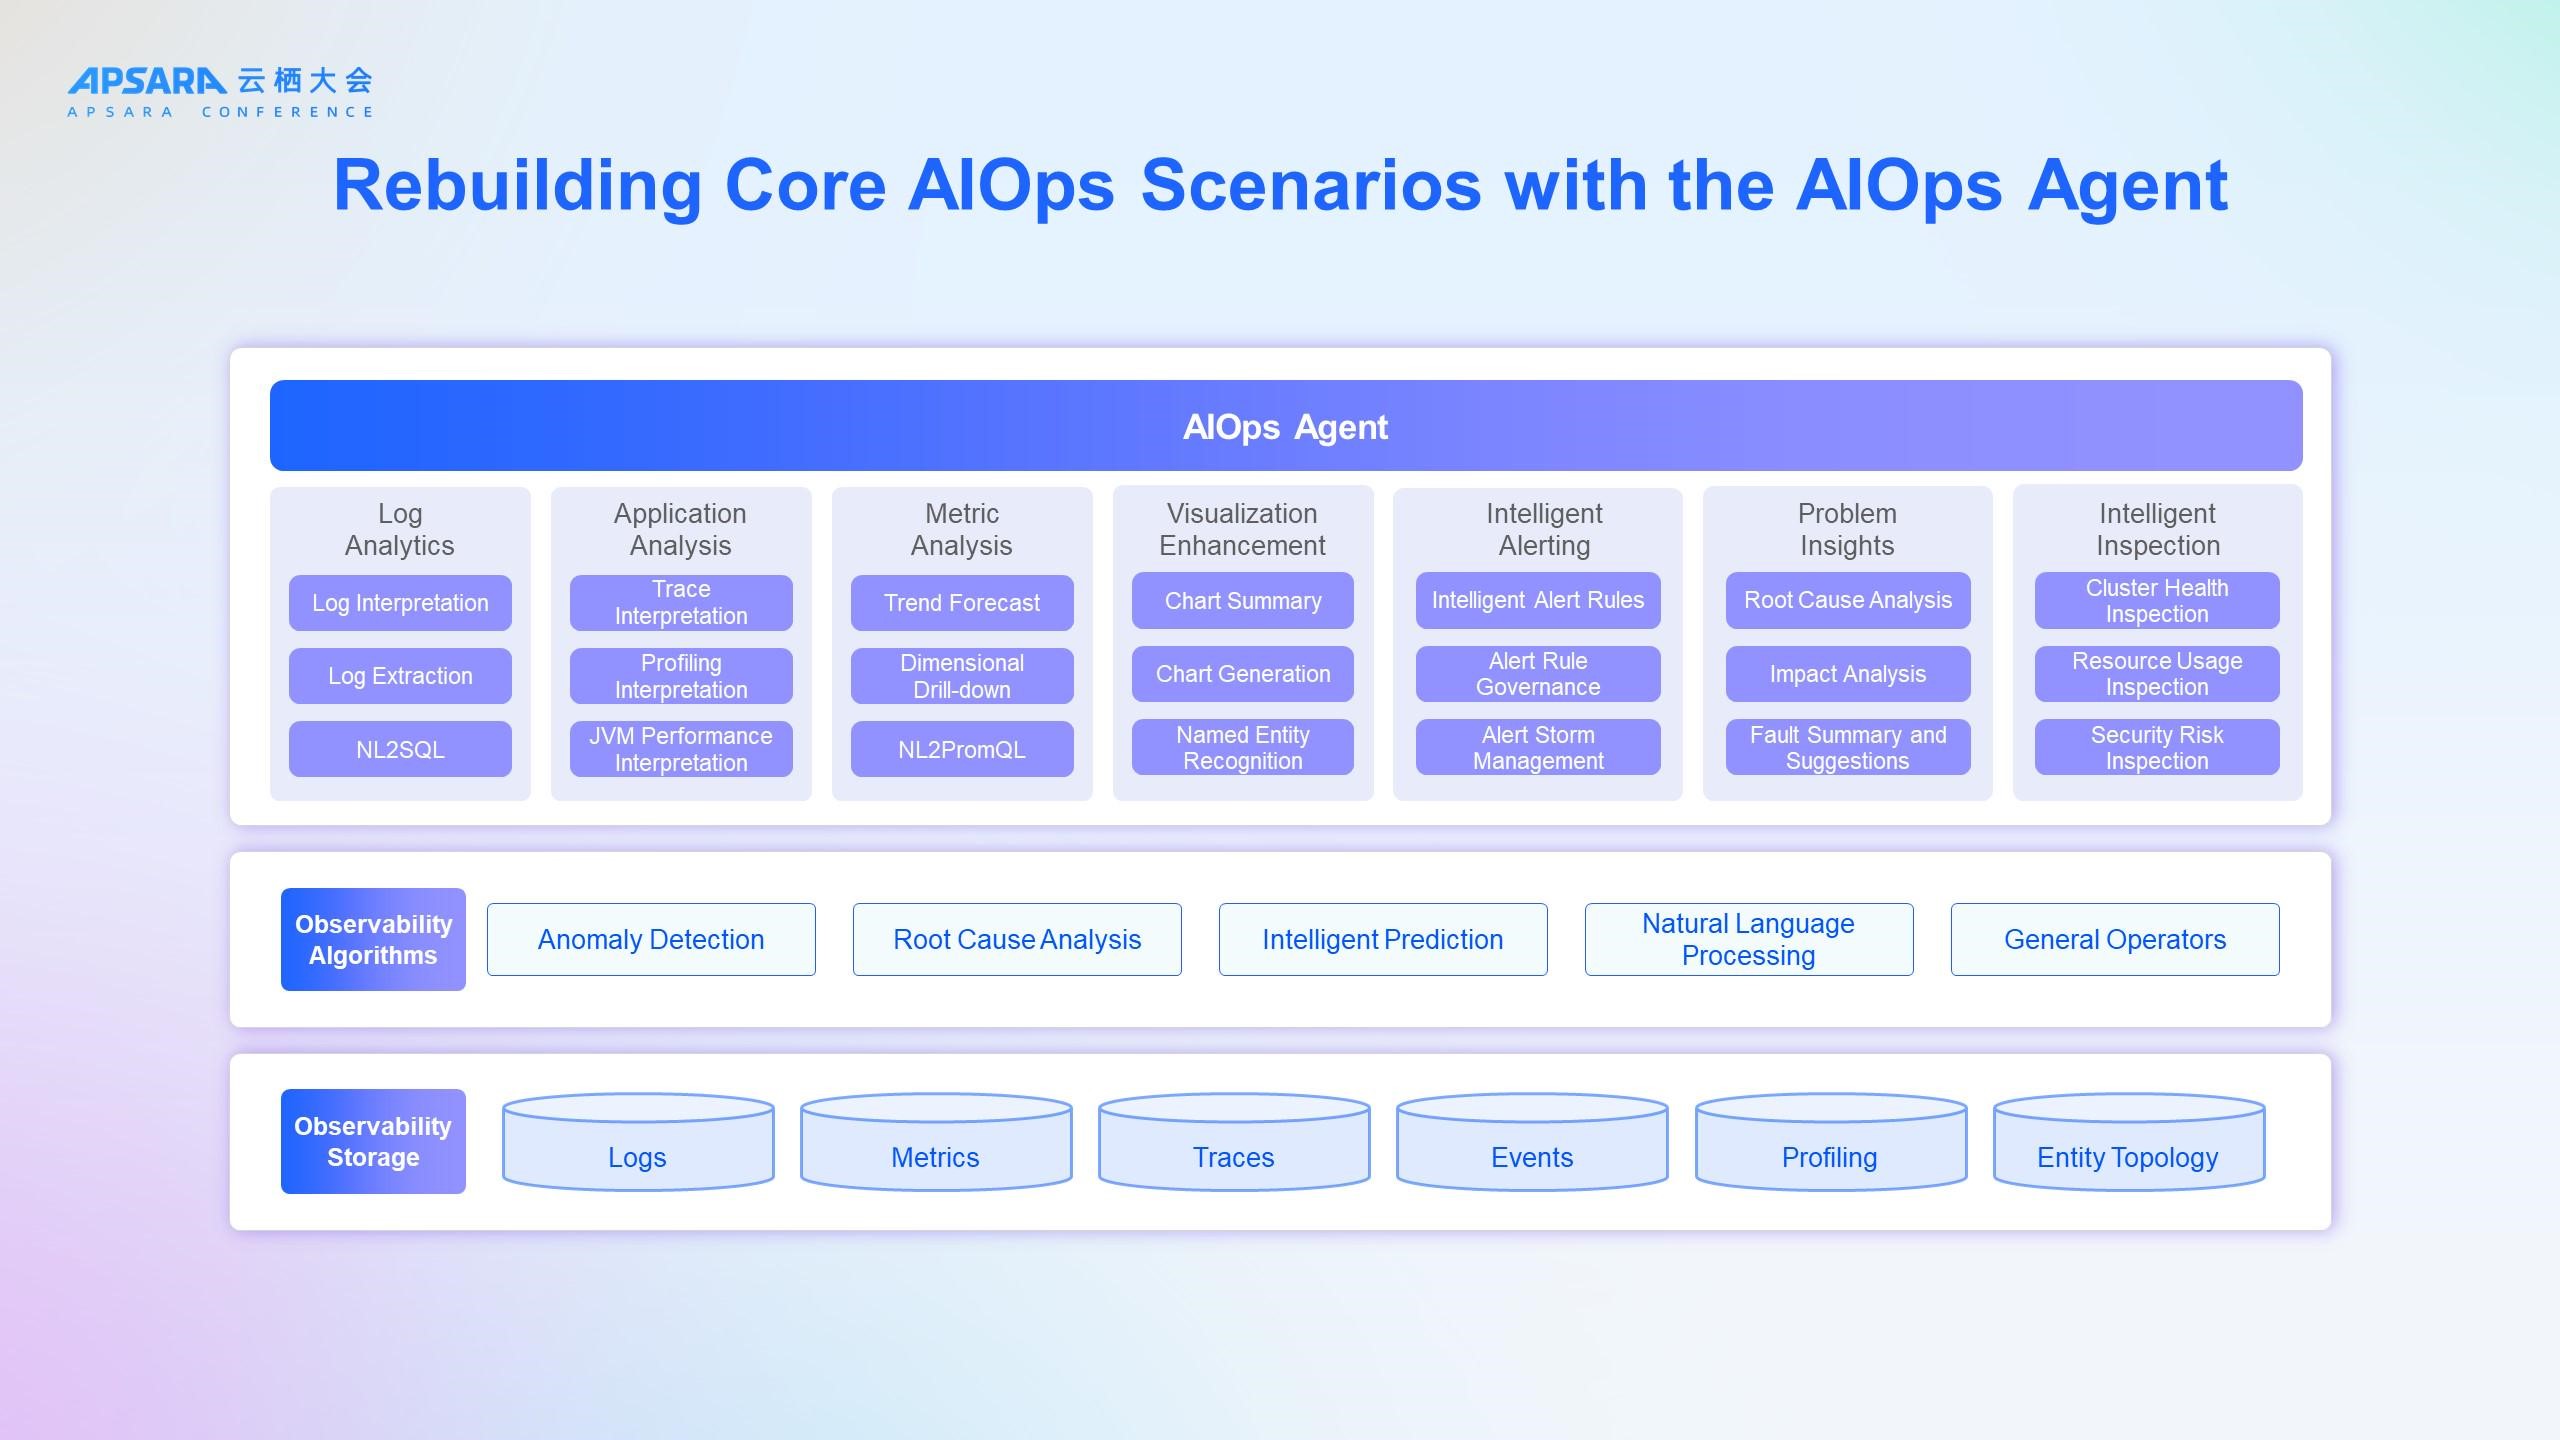
The value of the AIOps Agent lies not only in its intelligence but also in how it completely redefines our core AIOps scenarios. The keyword here is "redefine," because we have used a new, large model-driven, and natural language-based approach to integrate and upgrade four key use cases:
● Intelligent analysis: The Agent becomes an observability data analysis companion. Whether interpreting complex traces and flame graphs or diagnosing issues spanning applications and cloud services, users can directly ask the Agent to analyze the data and provide optimization suggestions.
● Intelligent alerting: The Agent assists with configuring and governing alerts, leveraging algorithms to consolidate and reduce noise (soon to be upgraded to Agent mode).
● Root cause insights: When an incident occurs, the Agent aids in root cause analysis, assesses the impact, and generates incident summaries.
● Intelligent inspection (coming soon): The Agent can be tasked with performing scheduled inspections of core services or clusters, shifting the paradigm from reactive firefighting to proactive prevention.
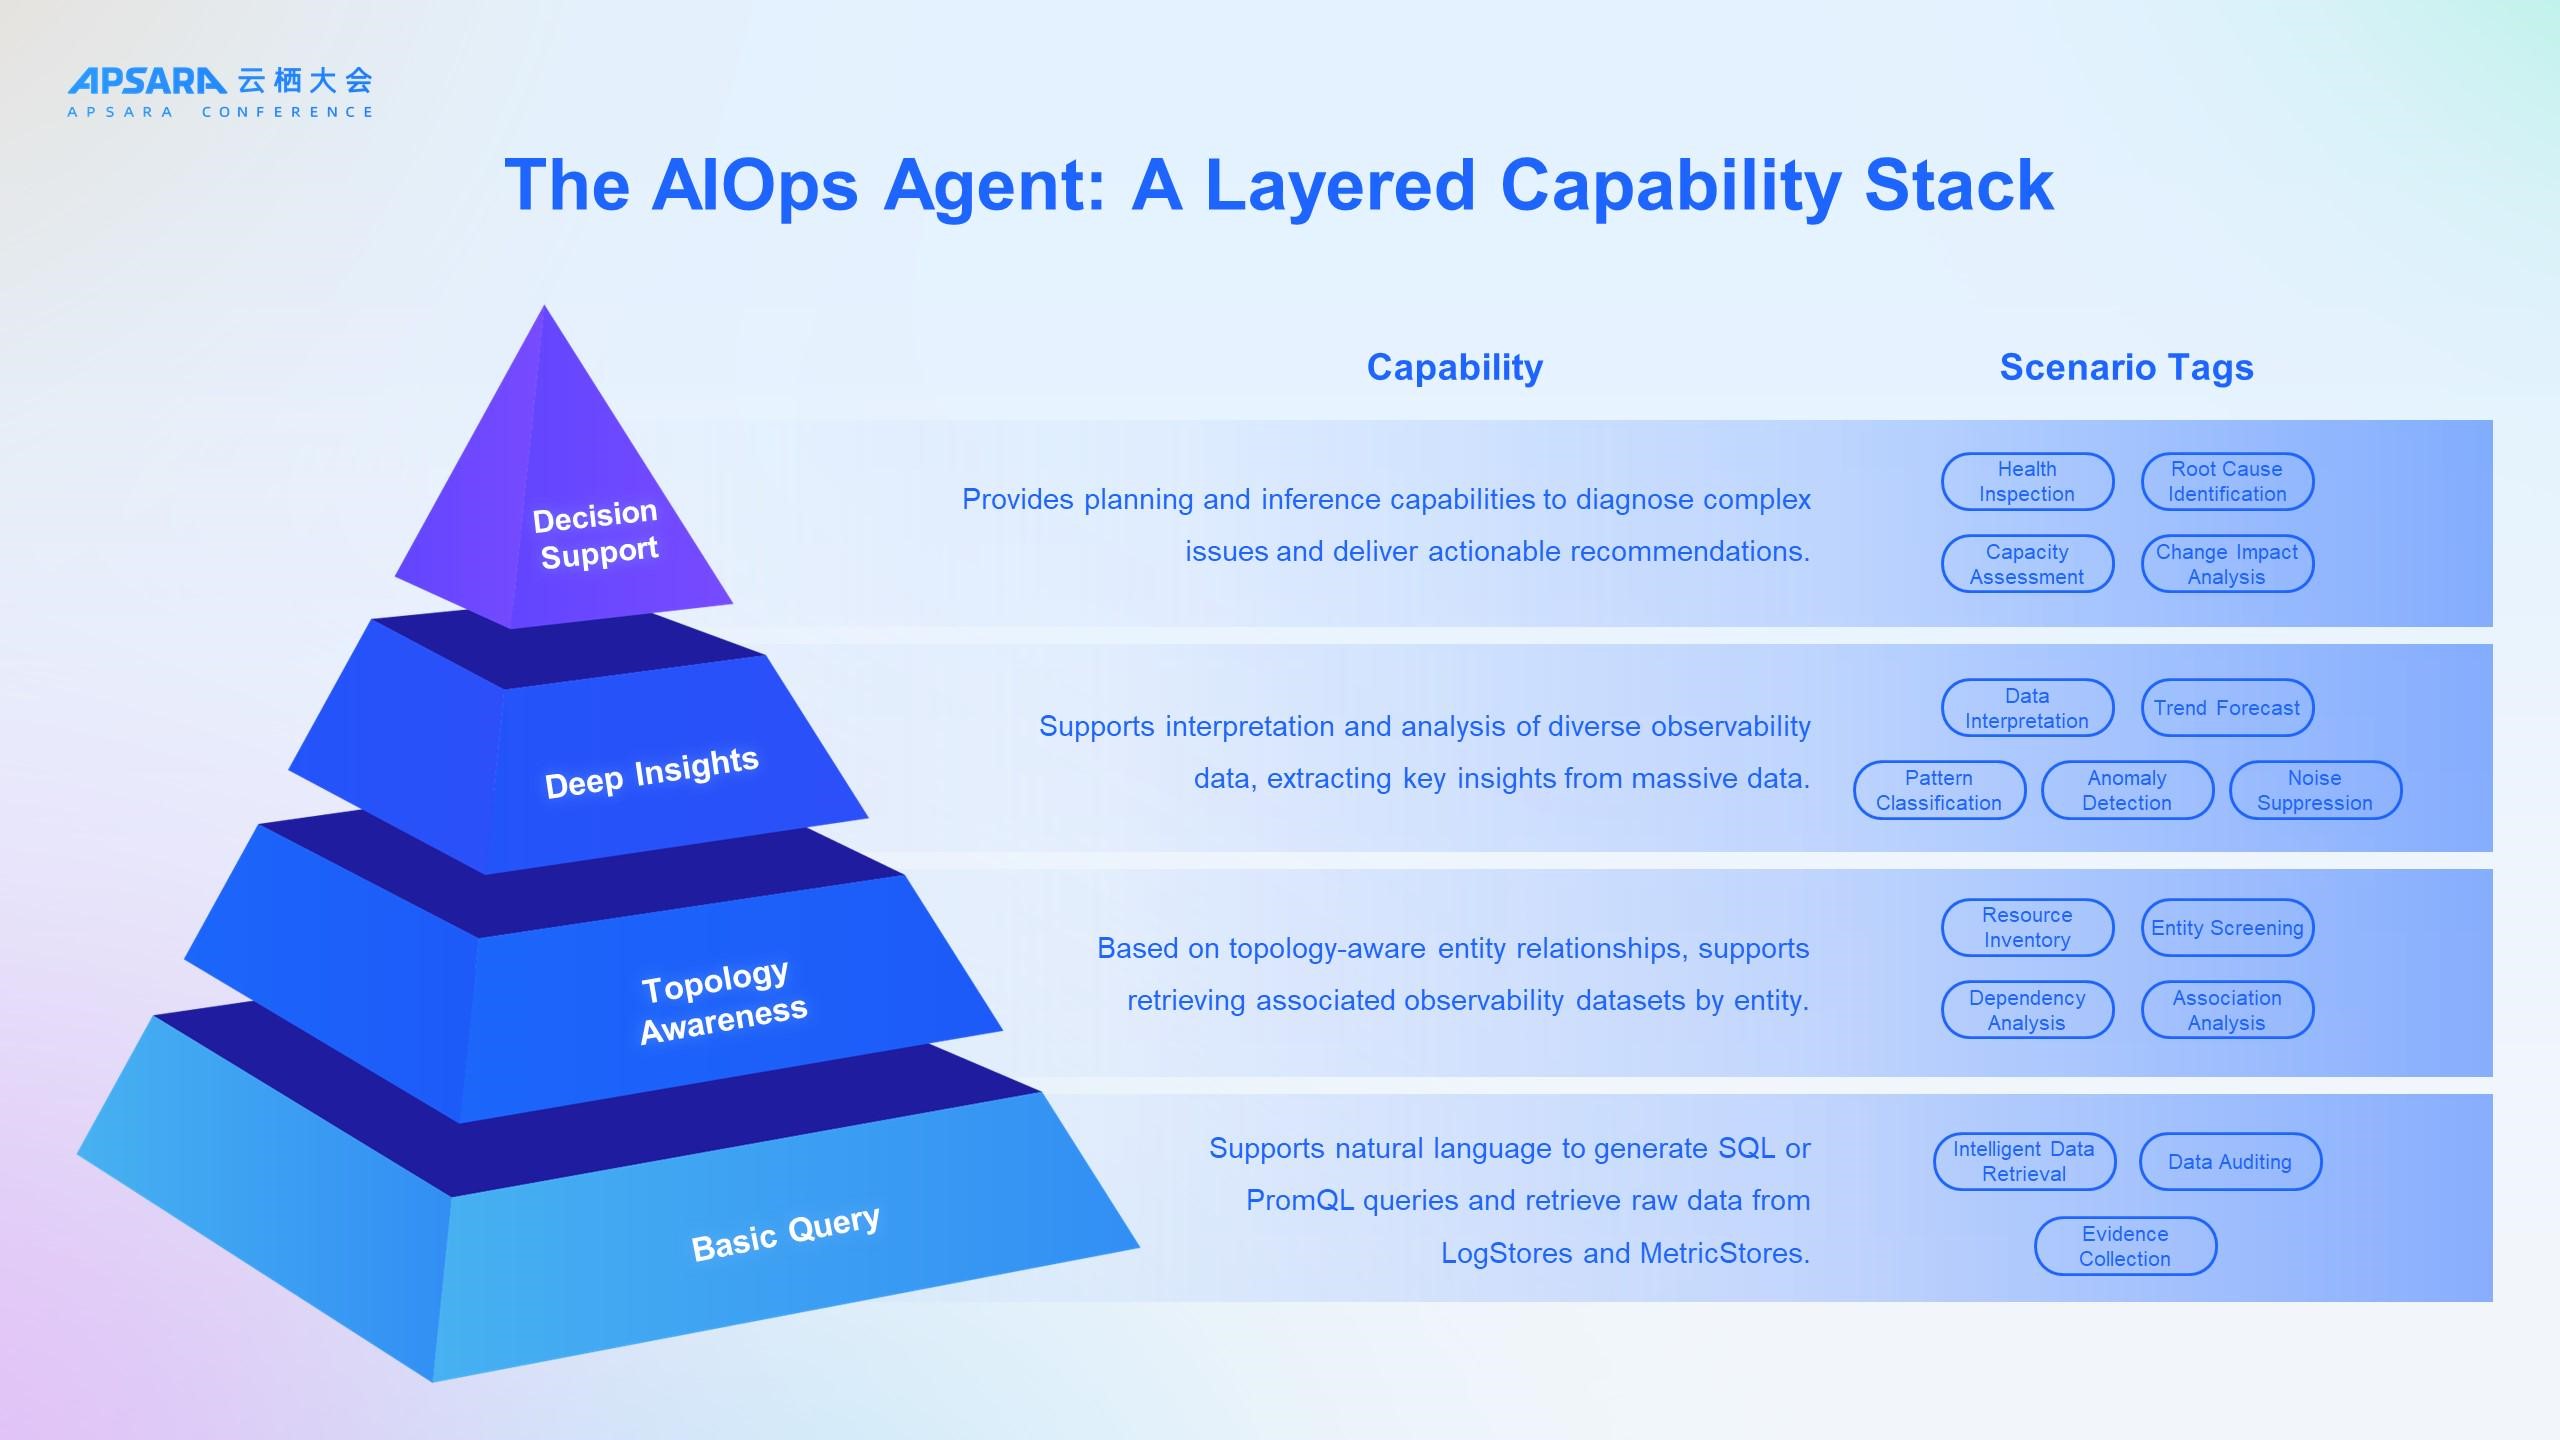
So, how does the AIOps Agent achieve all of this? Its intelligence is not built in a vacuum, nor is it achieved overnight. It is constructed upon a solid, layered pyramid of capabilities:
● Basic query: the Agent's "linguistic capability," enabling natural language interpretation and intelligent data retrieval from Logstores and Metricstores.
● Topology awareness: This is the Agent's "cognitive capability." Leveraging UModel, the Agent not only retrieves data but also understands the relationships between data and entities, enabling association analysis and resource inventory.
● Deep insights: This is the Agent's "analytical capability." It invokes various observability operators to perform anomaly detection, trend prediction, and pattern classification, extracting key information from massive datasets.
● Decision support: This is the Agent's "reasoning capability." By integrating all underlying capabilities, it performs complex root cause and change impact analysis to deliver actionable recommendations.
This layered capability stack is what transforms the Agent from a simple Q&A bot into an AIOps analysis engine capable of advanced diagnostics.
These capability layers are demonstrated in how you interact with the Agent in real-world scenarios. For example, you can ask, "What are the error rate rankings for the application performance management (APM) applications deployed in this Kubernetes cluster?" Or, you can select an application and instruct the Agent: "Analyze this application's call volume over the past week and forecast the trend for the next three days." Most importantly, the Agent provides top-level decision support. You can issue tasks like, "Perform an inspection of the Kubernetes cluster, focusing on components and resource levels," or ask for help during an incident: "This application has experienced request timeouts in the last hour. Help me locate the cause." As you can see, these are not rigid commands but natural, conversational interactions with your assistant. And as UModel integrates more data, knowledge, and actions, even more advanced conversational capabilities will be progressively unlocked.
The demo itself showcases the Agent performing an inspection on a Kubernetes cluster. Upon detecting an anomaly, it then proceeds to conduct a root cause analysis to identify the change event that triggered the issue. Throughout the demo, you can observe the Agent's thinking process: simple tasks are handled directly, while complex tasks involve a cycle of planning, execution, and reflection. By the end, the Agent successfully identifies the injected sidecar causing out-of-memory (OOM) faults and high CPU load. When prompted further, it also assesses the impact on the overlying business services.
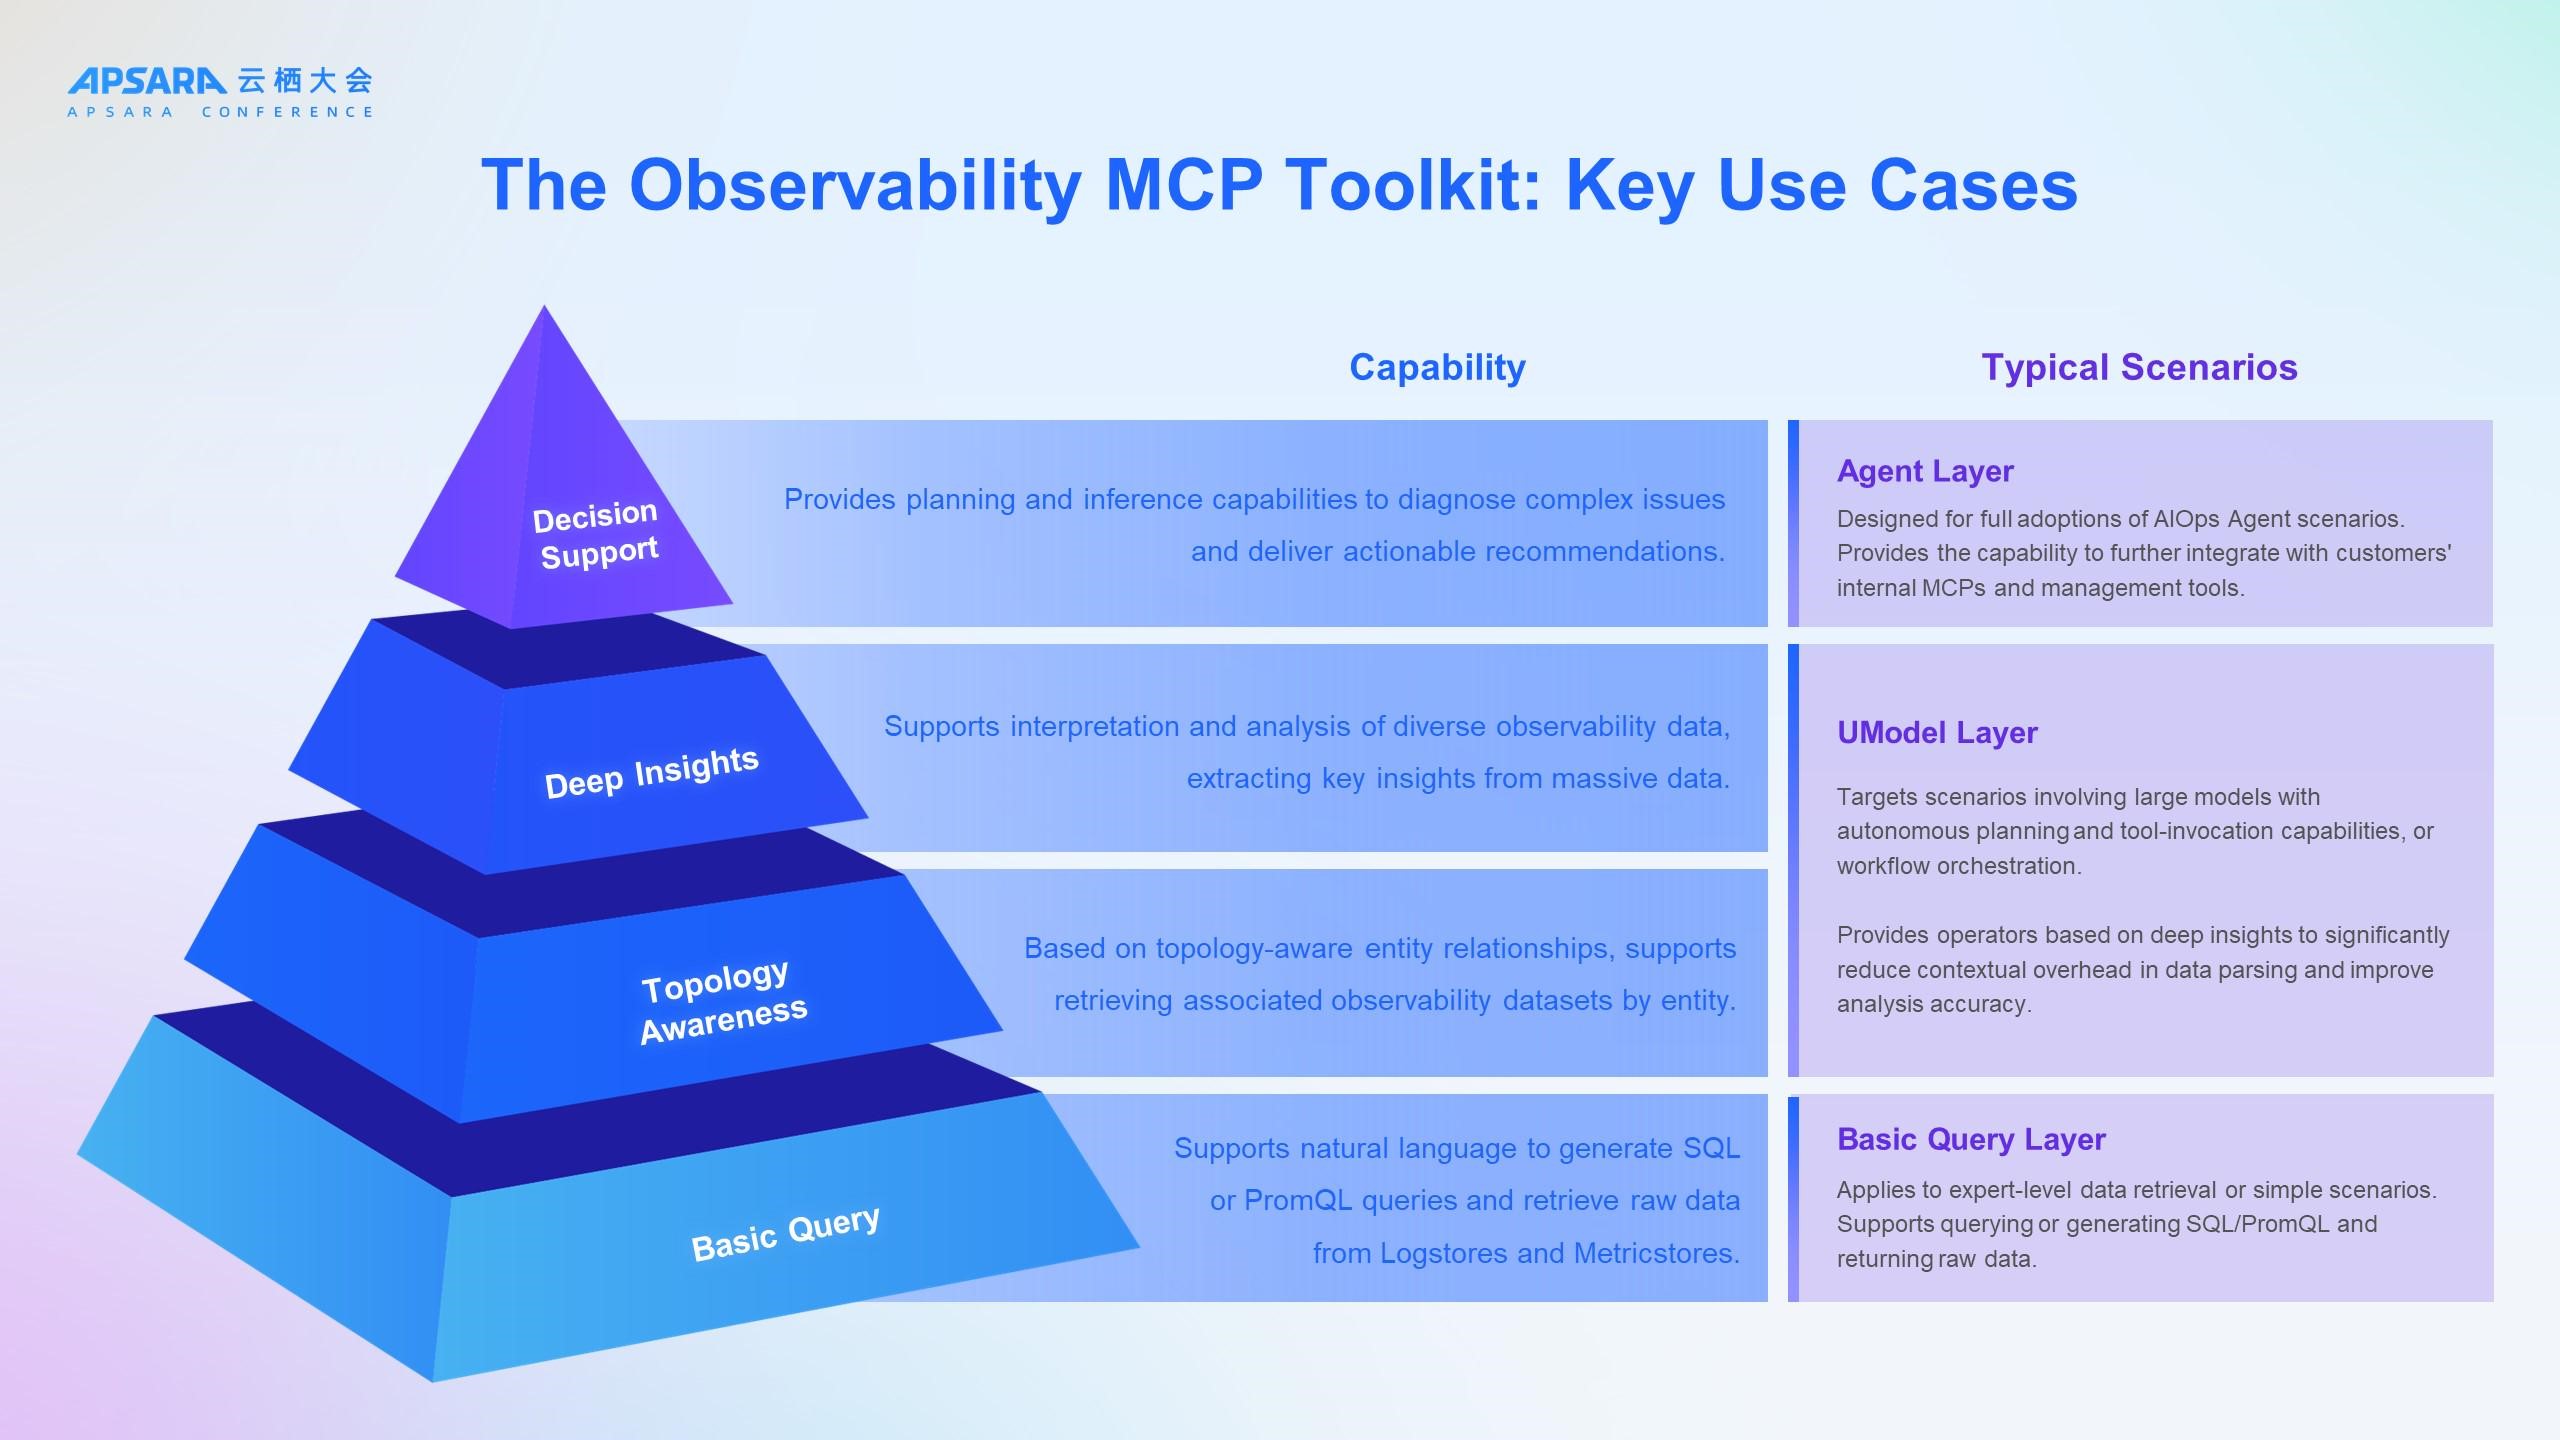
Growing alongside our customers, we have come to understand that no black-box solution can deliver long-term value. Therefore, we are making the core capabilities of AIOps fully available through a layered, observability Model Context Protocol (MCP) toolkit.
The three-layer design is intended to manage AI complexity. An AI Agent can become overwhelmed by too many tools, leading to confusion during selection and invocation. This layered structure provides multiple levels of integration, allowing users to choose what they need on demand.
You may notice that these three layers correspond to the four-layer capability pyramid discussed earlier. Indeed they do. Let's take a closer look:
● Base query layer: This layer provides data experts with direct API access to raw data, supporting natural language translation to both SQL and PromQL.
● UModel tool layer: Corresponding to topology awareness and deep insights, this layer is designed for large models or Agents capable of autonomous planning and tool invocation, and it also supports AI workflow orchestration. It provides structured query capabilities based on topology and entities, and enables information to be preprocessed before being fed to the large model, which improves analytical accuracy while reducing token consumption.
● Agent layer: This layer provides all users with an easy-to-use, natural language interface for observability focused on data analysis and issue diagnosis. This interface can be integrated with other MCP modules to enable a complete, closed-loop AIOps workflow.
● We believe that customers do not need to rebuild everything from scratch on our platform, but rather seek incremental enhancements to their existing capabilities. This open MCP toolkit allows enterprises to seamlessly integrate our observability intelligence into their existing platforms and processes, enabling them to build their own intelligent operations engines.
Finally, let's look at an exciting example of the possibilities unlocked by the open ecosystem of Cloud Monitor 2.0. In this demo, we took two key steps:
● Extend UModel: Leveraging UModel's open architecture, we created a custom series of DevOps UModels, incorporating entities such as "developers," "code repositories," and "code releases" into the observable world.
● Integrate an AI Coding IDE: We seamlessly integrated the observability MCP toolkit into Alibaba's Qoder. Because Qoder is already an Agentic IDE driven by powerful large models, this integration needed to rely only on the UModel tool layer, bypassing the Agent layer. This combination creates intriguing new synergies.
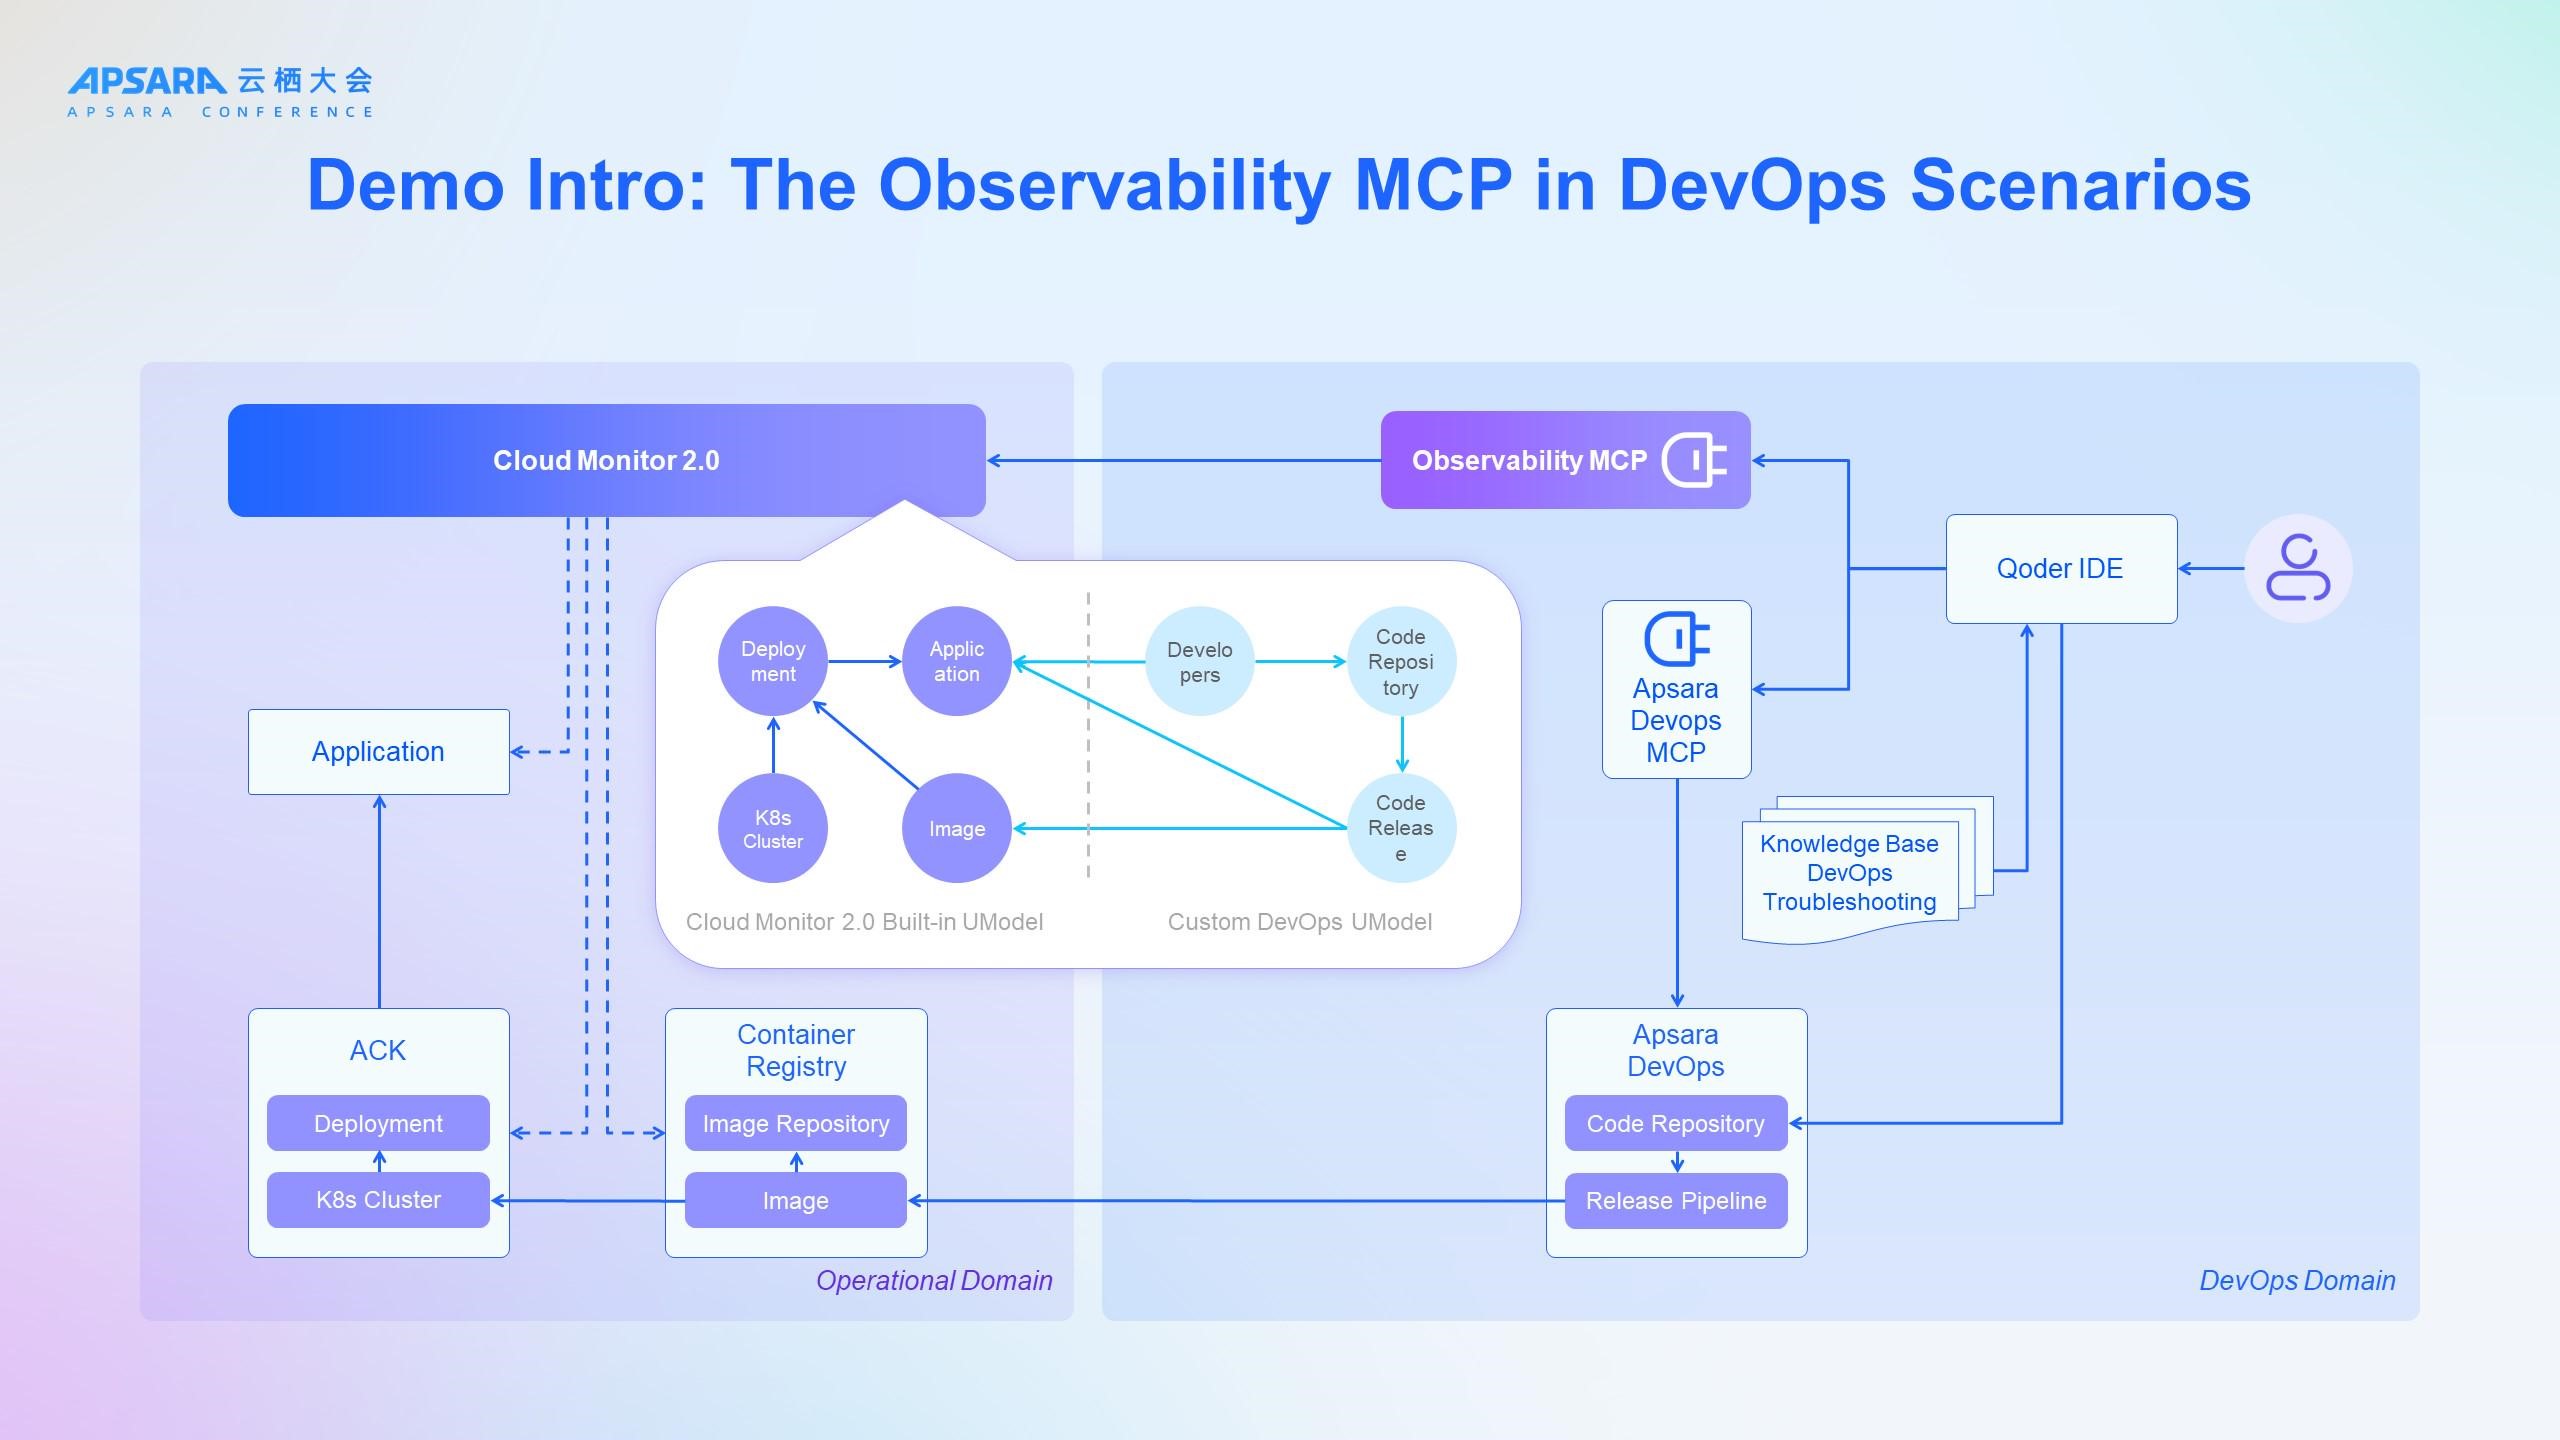
Imagine a developer using the Qoder IDE in the following scenario:Developer: "Was that recent production issue caused by the code I just deployed?"Qoder: "Yes. The spike in the error rate is linked to your latest commit to xxx."Developer: "Roll back that change immediately, optimize the code, and submit a new pull request."Qoder: Immediately rolls back the change, optimizes the code based on live observability data and the error analysis, and submits a new pull request with the fix.
Demo part 1: troubleshooting. Returning to the previous root cause analysis scenario, Qoder traces the anomaly to the responsible application, identifies the problematic image version, and confirms that the root cause was a recent deployment. Using UModel, it then pinpoints the exact code release record.
Demo part 2: bug fix. The findings from the troubleshooting are then fed as input to Qoder. It identifies the specific code causing the issue, applies a fix, and submits a new pull request to the Apsara DevOps platform (via the Apsara DevOps MCP).
This demo showcases a complete, closed-loop AIOps workflow that seamlessly integrates operational capabilities into the development workflow, making developers the first line of defense for system stability. It also hints at a new evolution for AIOps: if "Vibe Coding" allows users to create software based on ideas and intent, why not "Vibe Operation" (or "VibeOps")? After all, users who can create software based on their ideas shouldn't be expected to—and often are not equipped to—manually handle the complexities of deployment, monitoring, troubleshooting, and performance optimization.
We conclude with this panoramic view of Cloud Monitor 2.0—our comprehensive answer to the challenge of "rebuilding observability."
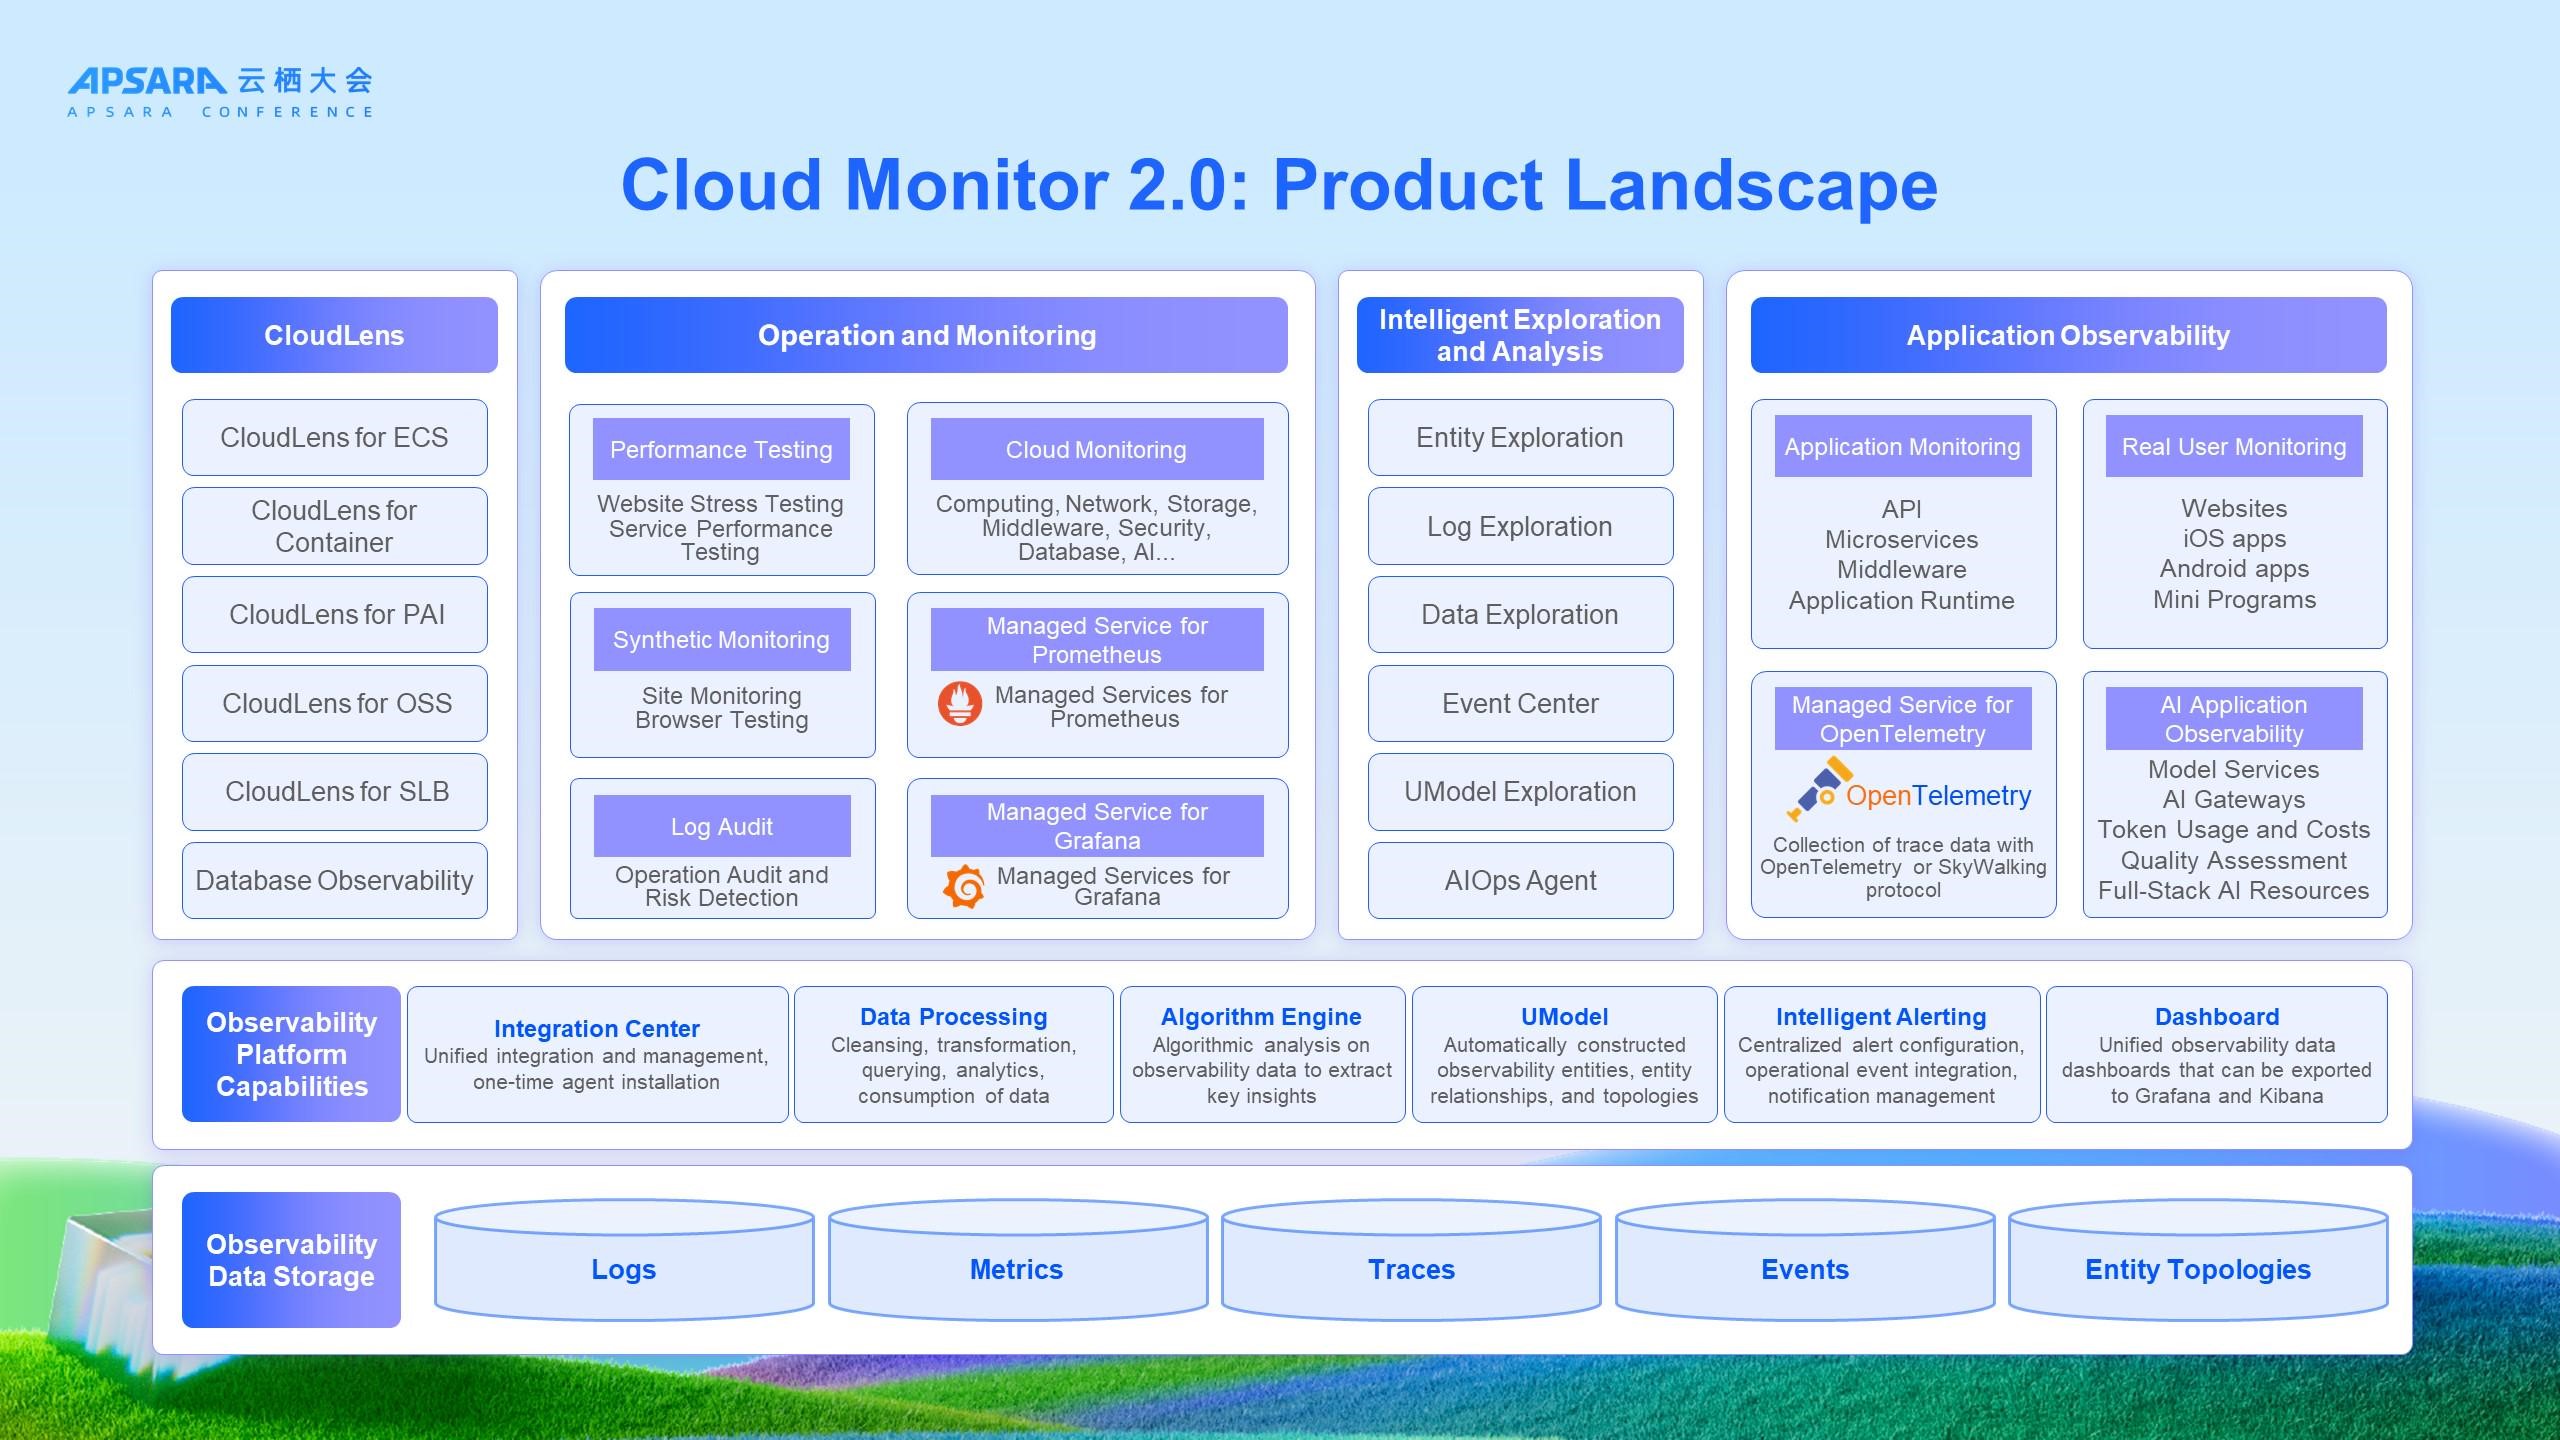
After a year and a half of evolution, Cloud Monitor 2.0 has completed the integration of most key systems, including Application Real-Time Monitoring Service (ARMS), Managed Service for Prometheus, and Hybrid Cloud Monitoring, along with their associated storage migrations. The remaining systems, such as CloudLens for SLS and Cloud Monitor Basic, are scheduled for gradual migration in the second half of the year. Unified ingestion, unified data processing, a unified algorithm engine, unified alerting, and unified dashboards—these are not just empty promises. They are the direct result of the continuous upgrades and migrations performed by the observability team. Consequently, most Alibaba Cloud observability customers can now seamlessly upgrade to the Cloud Monitor 2.0 ecosystem and experience the enhancements of UModel topology and the AIOps Agent at no additional cost. Looking back on our 2.0 journey, and leveraging the "All in AI" wave, we did not simply patch our existing technical systems. Instead, we fundamentally restructured three core layers:
● Bottom layer: We made the foundational decision to unify ingestion, computation, and storage, solving the core challenges of data scale and performance.
● Middle layer: Through our innovative UModel and algorithm engine, we enrich data with topological context and domain knowledge, bridging the cognitive gap.
● Top layer: The birth of the new AIOps Agent, along with rich intelligent exploration scenarios, has ushered IT operations into a new era of natural language conversation.
This is the new, large model-driven AIOps paradigm we have defined. It is not a set of isolated tools, but an end-to-end integration spanning from data to cognition to decision-making. We believe this represents not just a technological transformation, but an evolution in the very philosophy of intelligent operations. Let us look forward to the future of intelligent IT operations, a future we can reimagine and redefine through large models.

677 posts | 56 followers
FollowAlibaba Cloud Native Community - February 10, 2026
Alibaba Cloud Native Community - November 6, 2025
Alibaba Cloud Native Community - December 6, 2022
Alibaba Cloud Native Community - November 22, 2022
Alibaba Cloud Community - November 25, 2021
Data Geek - February 27, 2025

677 posts | 56 followers
Follow Container Service for Kubernetes
Alibaba Cloud Container Service for Kubernetes is a fully managed cloud container management service that supports native Kubernetes and integrates with other Alibaba Cloud products.
Learn More Container Compute Service (ACS)
A cloud computing service that provides container compute resources that comply with the container specifications of Kubernetes
Learn More Cloud-Native Applications Management Solution
Accelerate and secure the development, deployment, and management of containerized applications cost-effectively.
Learn More Alibaba Cloud for Generative AI
Accelerate innovation with generative AI to create new business success
Learn MoreMore Posts by Alibaba Cloud Native Community