In the last article of the IoV series, we take a look at some O&M Control and DevOps tools developed by Alibaba Cloud.
As we have mentioned, the IoV industry features peak hours in the morning and evening, when the data traffic is three times higher than that during normal hours. That means, the input for resources must also be three times more. In the traditional IDC architecture, resources prepared are capable of processing 1.2 times of peak traffic (as a buffer for special cases), but most of them are idle in normal hours with resource utilization of less than 30%. That is, if 120 sets of servers are sufficient for 18 hours a day, you will have to deploy 360 sets of servers in order to process the traffic in remaining 6 peak hours of the day. This is to ensure the system stability and improve the user experience.
To solve this pain point, we applied the on-cloud Auto Scaling service. The service can automatically create ECS instances, deploy applications prior to peak hours, and connect the started applications to Server Load Balancer instances. After the peak hours, the service automatically releases the new ECS instances. All the operations in this process are automatic without manual intervention. The new resources are charged in Pay-As-You-Go mode, greatly saving the costs.
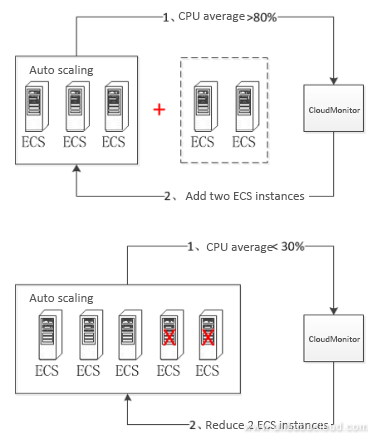
Solution for traffic peak in the morning and evening each day:
The traffic reaches the peak in hours from 07:00 to 09:00 in the morning and from 18:00 to 20:00 in the evening each day. In this case, the system is auto scaled regularly at 07:00 and 18:00 respectively to respond to the traffic peak.
Solution for traffic peak on festivals:
The traffic peak on festivals is unpredictable. In this case, the system is auto scaled based on the CPU utilization, application load, and bandwidth utilization. The system is auto scaled regularly at 16:00 one day before and on the penultimate day of the festivals to respond to the traffic peak and is auto scaled based on the utilization of the CPU and bandwidth during festivals.
Auto Scaling not only saves the costs but also realizes auto service scaling during peak hours. Besides, the whole process is automated without additional O&M. Auto Scaling has solved our long existing pain points.
For the traditional IDC architecture, most of our time was used for application upgrade release and troubleshooting. About 50 upgrades, which may reach 100 during major version upgrade, were released each day. Such a release speed was quite satisfying considering that the system O&M was based on scripts and manpower at that time. But our company wanted a higher speed. Why were so many upgrades released? At that time, our company was developing rapidly.
To adapt to the market changes and meet the market demands fast, the R&D team had to complete demand design and product R&D and test and make the product commercially available as fast as possible. The ability to occupy the market shares for the first time is also an Internet enterprise's core competitiveness. At that time, we were gradually familiar with Jenkins continuous integration and applied the service in the company. Now, we hope we can still use Jenkins for continuous integration on the cloud platform. Alibaba Cloud experts recommend CodePipeline for us. Compatible with Kenkins, CodePipeline is a Software-as-a-Service (SAAS) product free of O&M that can integrate with multiple code management platforms.
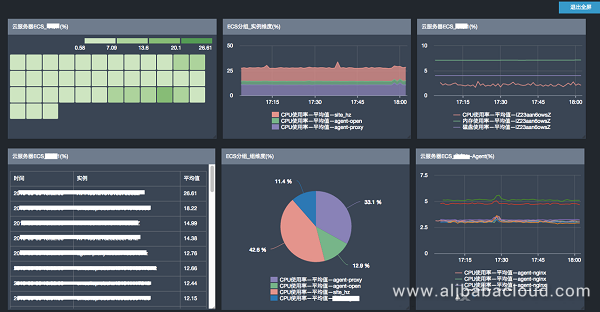
In the traditional IDC architecture, Alibaba Zabbix monitoring system is used. With the rapid development of our business, metrics increase from 1,000 to 30,000, and monitoring demands are diversified and customized. As a result, the query speed becomes slow, alarm delay becomes frequent, and false alarms become more. The traditional monitoring system lags behind the steps of the rapid business development. The monitoring and alarm system is a helpful tool for O&M. The system stability depends on the monitoring coverage, alarm flexibility, and alarm processing timeliness. Therefore, we use Alibaba Cloud CloudMonitor, a service that monitors Alibaba Cloud resources and Internet applications. CloudMonitor can be used to collect metrics for Alibaba Cloud resources, detect Internet service availability, and set alarms for the metrics.
The following is a monitoring dashboard generated through Alibaba Cloud CloudMonitor in one click. The CloudMonitor dashboard supports full screen display and automatic refresh of data. You can add various service metrics to a dashboard to display them on the dashboard in full screen mode.
Log Service is a very important functional module in our IoV platform architecture. The log system records all actions of the application or system and represents the actions according to specified rules. The log data is of great significance. The application logs, system logs, operation logs, and other logs can be collected for security audit, troubleshooting, and data analysis based on big data technologies. In the traditional IDC architecture, a self-developed open-source log system (shorted as ELK, a mainstream log system at that time) was used. The size of logs generated by all business systems one day was about 500 GB.
The self-developed ELK system had ten servers: one Kibana server for front-end display, three Logstash servers for log migration and indexing, three Kafka servers for log queue, and six Elasticsearch servers for log storage and search. The six Elasticsearch servers were physical hosts and the log write and search performance was affected by the poor ES configuration. This ELK system is expensive but can only store logs generated in one month. Besides, ES optimization and maintenance is complicated and should be performed by professional O&M personnel.
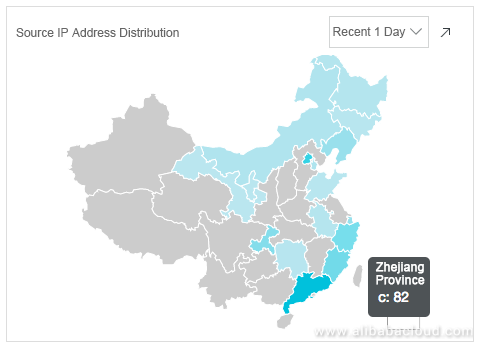
Access region analysis (ip_distribution)
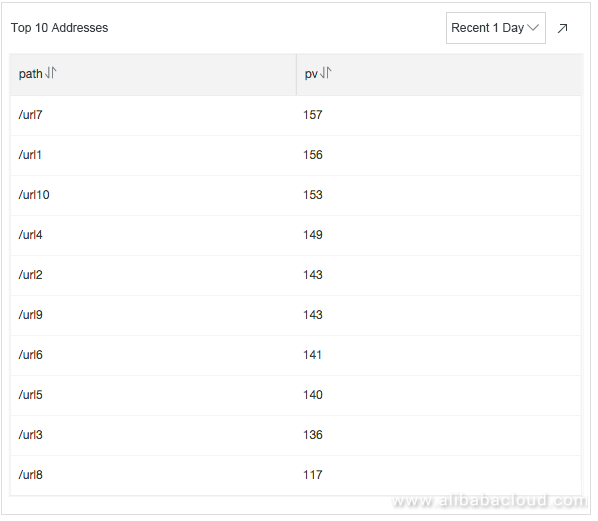
Top 10 access addresses (top_page)
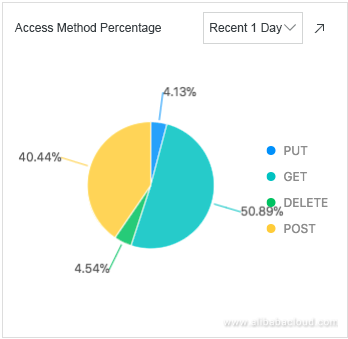
Access method percentage (http_method_percentage)
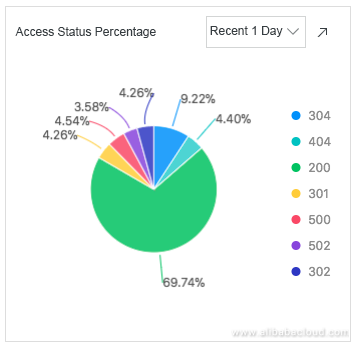
Access status percentage (http_method_percentage)
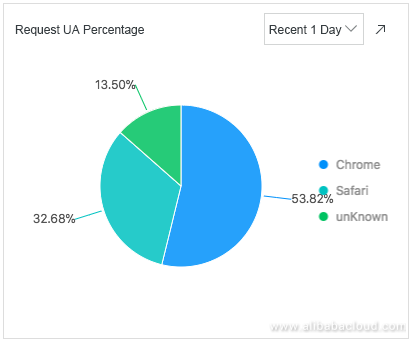
Request UA percentage (user_agent)
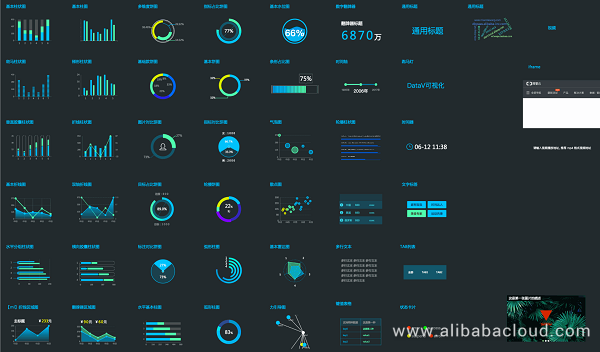
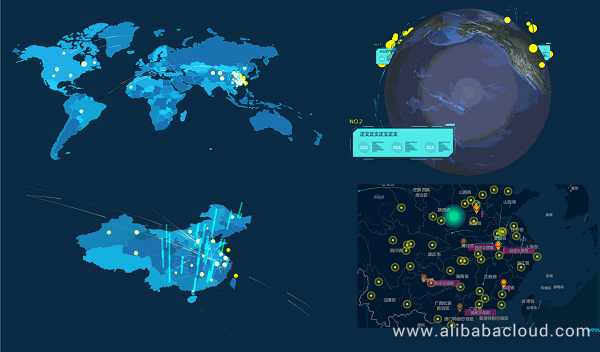
When China's Ministry of Transportation visited Alibaba, we presented the running status and indicators of our business systems on the IoV platform on a dashboard, including statistics on online vehicles, online app users, vehicle alarms, number of new IoV devices of the day, number of vehicles in each city, and traffic congestion status. Generally, this process is called data visualization. Data visualization is dedicated to revealing business insights behind the ever changing and complex data in a more vivid and user-friendly manner. In the past, our designers lacked the experience in presentation of complicated data, so the presented charts and special effects were too simple, and the result was unsatisfactory. Later, we applied Alibaba Cloud DataV.
Alibaba Cloud DataV provides multiple data and chart presentation components that allow you to design dashboards with excellent effects easily. By using DataV, we can perfectly and vividly present the real-time business indicators of the smart IoV platform and application of IoV in the traffic area.
The O&M team of our company has 26 members, 10 for application O&M, 3 for database O&M, 2 for system O&M, 2 for network O&M, 3 for O&M development, and 6 for O&M monitoring. The top task for enterprise O&M management is permission management, followed by security audit, for example, how to distinguish the DBA permission and the application O&M permission, and how to audit whether the operations of O&M personnel conform to the requirements, and so on.
Responding to account management risks, permission management risks, and security management risks, and improving the efficiency are all challenges for enterprises. In the traditional IDC architecture, we can only use the simple Sudo authorization system for permission control. However, the system configuration is quite complicated, the permission cannot be updated timely, and the management granularity is large, resulting in poor effect on the whole. On the cloud platform, we use RAM, ActionTrail, and other products of Alibaba Cloud.
In the past, we often needed to count resources before the end of the year to learn about how many resources are used by the R&D department, how many resources are used by the test department, what is the cost of each department, and which department has the most expenses. In the traditional IDC architecture, resources are counted based on departments, without a dedicated management system. Excel statistics are time-consuming, laborious, and prone to errors.
The enterprise console on the cloud easily resolves these problems. The enterprise console provides cloud-based integrated management services for cloud resource management, personnel management, and financial management for enterprise customers. In contrast with the way that the conventional console controls and configures cloud products independently, the enterprise console helps enterprises standardize their operation process and manage the personnel, financing, and properties based on organizational relations such as companies, departments, and projects, with overall management as the starting point.
The enterprise console implements two key functions: O&M management and financial management.
O&M management:
Financial management:
Classification based on an enterprise' organizational structure
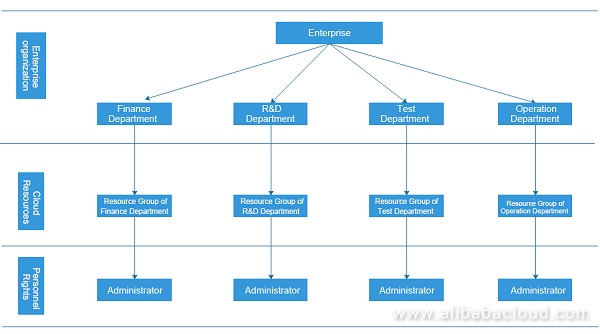
An enterprise can classify resource groups based on its organizational structure. Each resource group is configured with independent cloud resources, and each resource group is set with different resource administrators. In addition, an enterprise's primary account can manage all resource instances. For example, a company has a finance department, an R&D department, a test department, and an operation department. In resource group settings, you can set a financial department resource group, an R&D department resource group, a test department resource group, and an operation department resource group. The following figure shows an enterprise and its cloud resources and rights management architecture.
Classification based on organizational structure + business projects
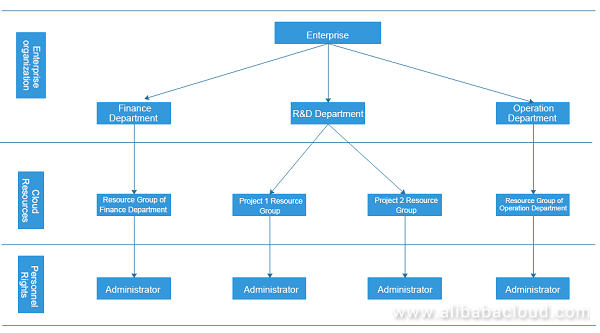
A certain department in an enterprise may have multiple projects. The resources of multiple projects need to be separately settled and managed by different administrators. Therefore, establish multiple resource groups for multiple projects in a certain department or enterprise, and set different administrators for different resource groups.In addition, an enterprise's primary account can manage all resource instances. Assume that enterprise A has a finance department, an R&D department, and an operation department. In resource group settings, set a financial department resource group and an R&D department resource group. For two different projects in the R&D department, set project 1 resource group and project 2 resource group.The following figure shows an enterprise and its cloud resources and rights management architecture.
Resource group report
The enterprise console supports the grouping of resources, which allows you to query reports.
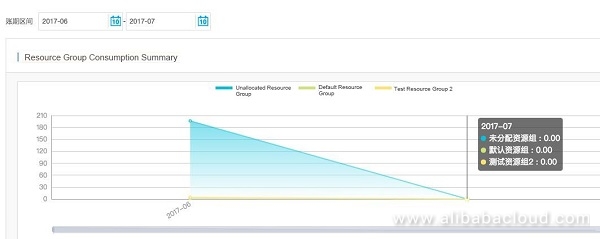
Resource group reports split financial reconciliation based on resource groups you have created in Resource Group Management, and display the data in a chart.

You can view trends by switching to the billing period interval or click on a resource group to view instance details, as shown in the following figure.
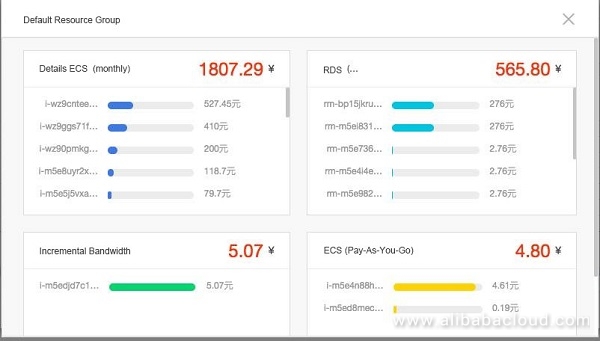
Note: Resource group reports only show the information about products contained in the resource group under the account.
Testing and Optimization for Internet of Vehicles: IoV Series (IV)

10 posts | 2 followers
FollowAlibaba Cloud Product Launch - December 11, 2018
Alibaba Cloud Product Launch - December 11, 2018
Alibaba Cloud Product Launch - December 12, 2018
Alibaba Clouder - March 9, 2018
Alibaba Clouder - October 1, 2019
Alibaba Clouder - October 15, 2018

10 posts | 2 followers
Follow Architecture and Structure Design
Customized infrastructure to ensure high availability, scalability and high-performance
Learn More Oracle Database Migration Solution
Migrate your legacy Oracle databases to Alibaba Cloud to save on long-term costs and take advantage of improved scalability, reliability, robust security, high performance, and cloud-native features.
Learn More Database Migration Solution
Migrating to fully managed cloud databases brings a host of benefits including scalability, reliability, and cost efficiency.
Learn More Cloud Migration Solution
Secure and easy solutions for moving you workloads to the cloud
Learn MoreMore Posts by Alibaba Cloud Product Launch