By Yuan Yi
At present, Kubernetes (K8s) has truly dominated the container orchestration market, which is the default cloud-independent computing abstraction. More and more enterprises are building services on K8s clusters. In K8s, components expose services through Services, including NodePort, LoadBalancer, and Ingress. Ingress mainly provides HTTP (layer 7) routing and has more advantages over TCP load balancing (layer 4), including more flexible routing rules and support for canary release, blue/green deployment, A/B testing, SSL, logging, monitoring, and user-defined extensions. Currently the Ingress resource is the main method to expose HTTP/HTTPS services in k8s.
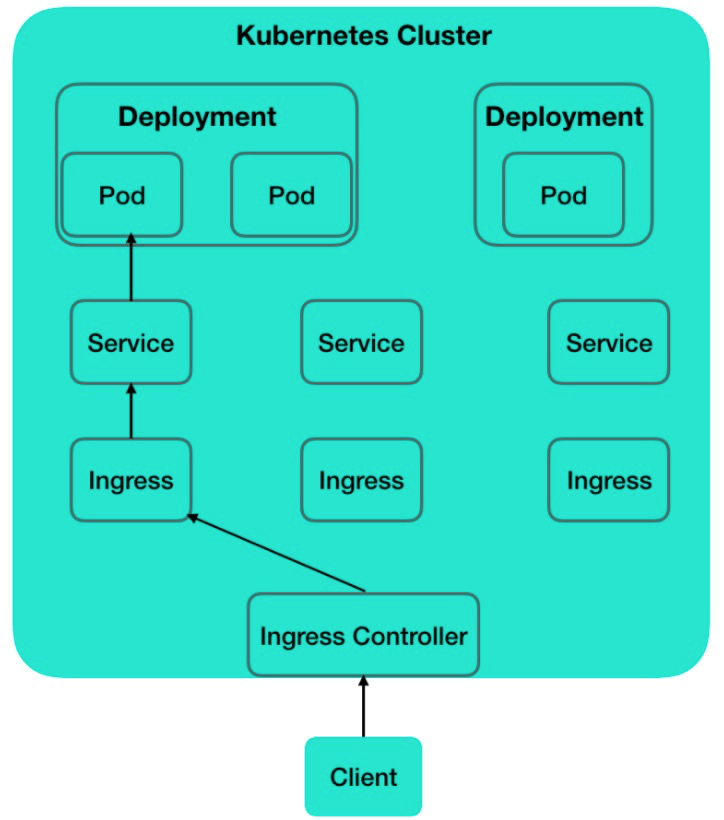
In k8s, an Ingress is just an API resource declaration. To fulfill an Ingress, it is required to install the corresponding Ingress Controller, which defines the Ingress and forwards traffic to the corresponding services. Currently many Ingress Controllers are available. For more information, see the Ingress Controllers document on the official website. Among all these Ingress Controllers, nginx, Traefik, Istio, and Kong controllers are very popular. Nginx Ingress Controllers are the most popular in China.
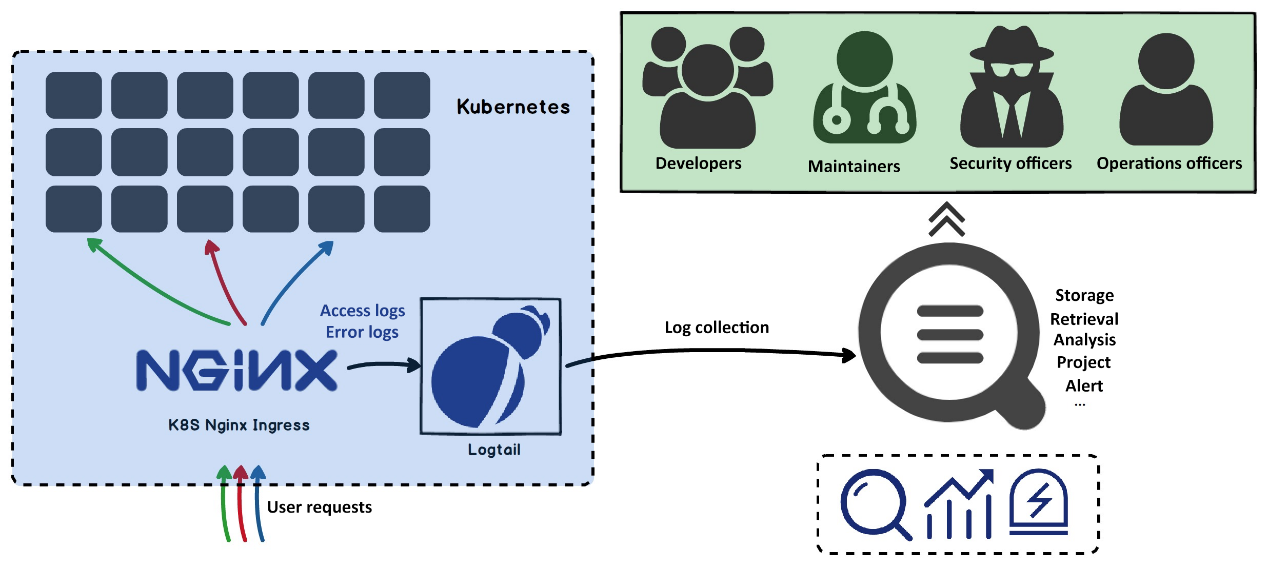
Logging and monitoring are two basic features provided by all Ingress Controllers. Logs generally include access logs, controller logs, and error logs. Monitoring mainly extracts some metric information from logs and controllers. Among all these logs, access logs have the largest volume, provide the largest amount of information and is of the highest value. Generally, layer 7 access logs include URLs, source IP addresses, UserAgents, status code, incoming traffic, outgoing traffic, and response time. Forwarding logs like logs for Ingress Controllers also include additional information like the names of the Services that the forwarding targets and Service response time. From these logs, we can analyze and find lots of information, including:
1.website PV and UV;
2.regional and device distribution of website access;
3.website access error rate;
4.response latency of backend services;
5.distribution of access to different URLs.
Our developers, maintenance officers, marketing officers, and security officers can fulfill their respective needs based on the obtained information, including:
1.data metric comparison between newer versions and older versions;
2.website quality monitoring and cluster status monitoring;
3.malicious attack detection and anti-cheating;
4.statistics on page view and advertising conversion rate.

However, it is very complex to manually set up and maintain a complete set of Ingress log analysis and monitoring systems. This set of systems require use to build lots of modules:
1.Deploy log collection agents and configure collection and parsing rules.
2.Build a buffer queue like Redis and Kafka because lots of page views usually come in k8s clusters.
3.Deploy real-time data analysis engines such as Elasticsearch and ClickHouse.
4.Deploy visualization components and build reports, such as Grafana and Kibana.
5.Deploy alerting modules and configure alerting rules, such as ElastAlert and AlertManager.
To lower the threshold for users to implement Ingress log analysis and monitoring, Alibaba Cloud Container Service and Log Service provide integrated support for Ingress logs (See the official document). A yaml resource is required to deploy a whole set of Ingress log solutions, including log collection, analysis, and visualization.
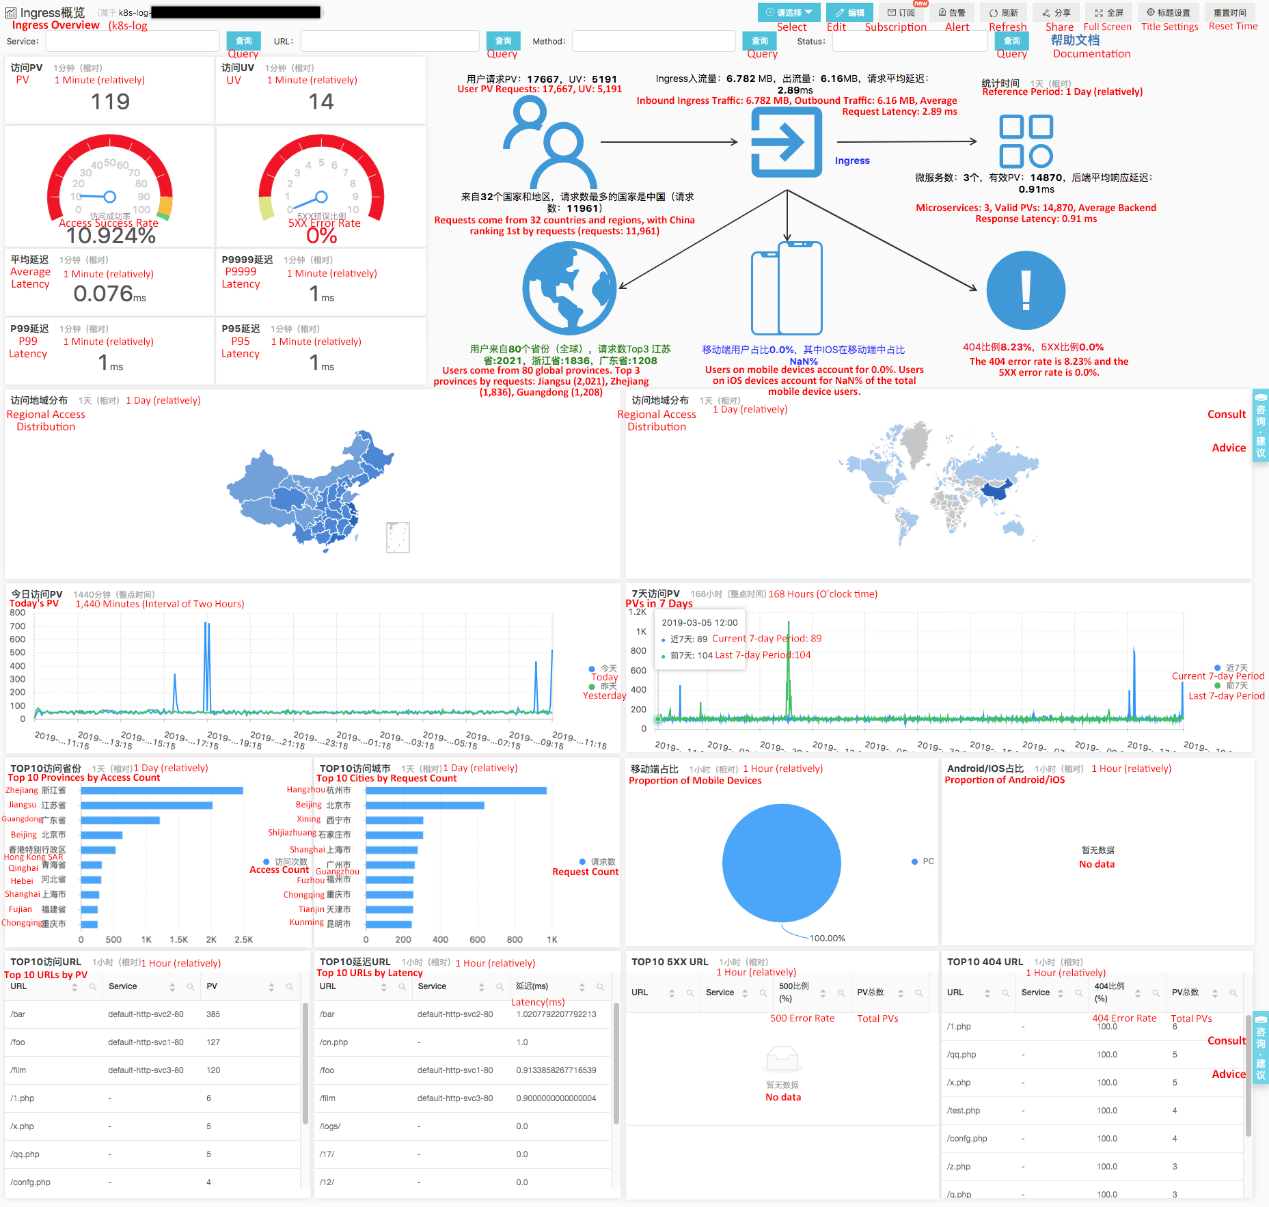
By default, Log Service creates five Ingress reports: Ingress Overview, Ingress Access Center, Ingress Monitoring Center, Ingress Blue/Green Release Monitoring Center, and Ingress Anomaly Detection Center. Different roles can use different reports based on their own needs. At the same time, each report has a filter box that allows filtering data by Service, URL, status code or other criteria. All reports are implemented based on the basic visualization components provided by Log Service and can be customized and adjusted to meet specific and actual scenarios of enterprises.
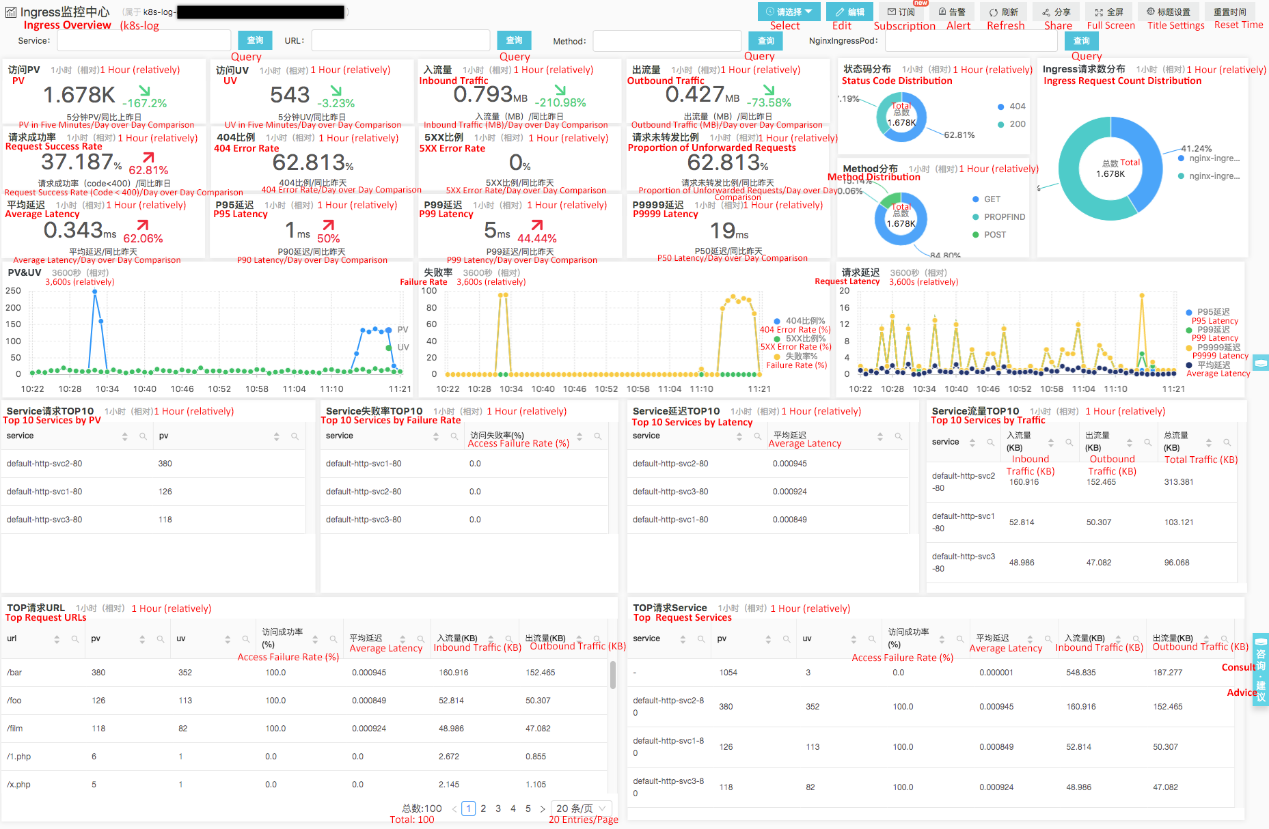
The Ingress Overview report displays the overall status of the current Ingress, including the following:
1.overall architecture status (1 day), including PV, UV, traffic, response latency, mobile access proportion, and error ratio;
2.real-time website status (1 minute), including metrics such as PV, UV, success rate, 5XX ratio, average latency, and P95/P99 latency;
3.user request information (1 day), including metrics such as comparison between 1-day and 7-day PV, regional access distribution, province/city with top PV, mobile access proportion, and Android/iOS proportion;
4.TOPURL statistics (1 hour), including metrics such as top 10 URLs by access requests, top 10 URLs by high latency, top 10 URLs by 5XX errors, and top 10 URLs by 404 errors.
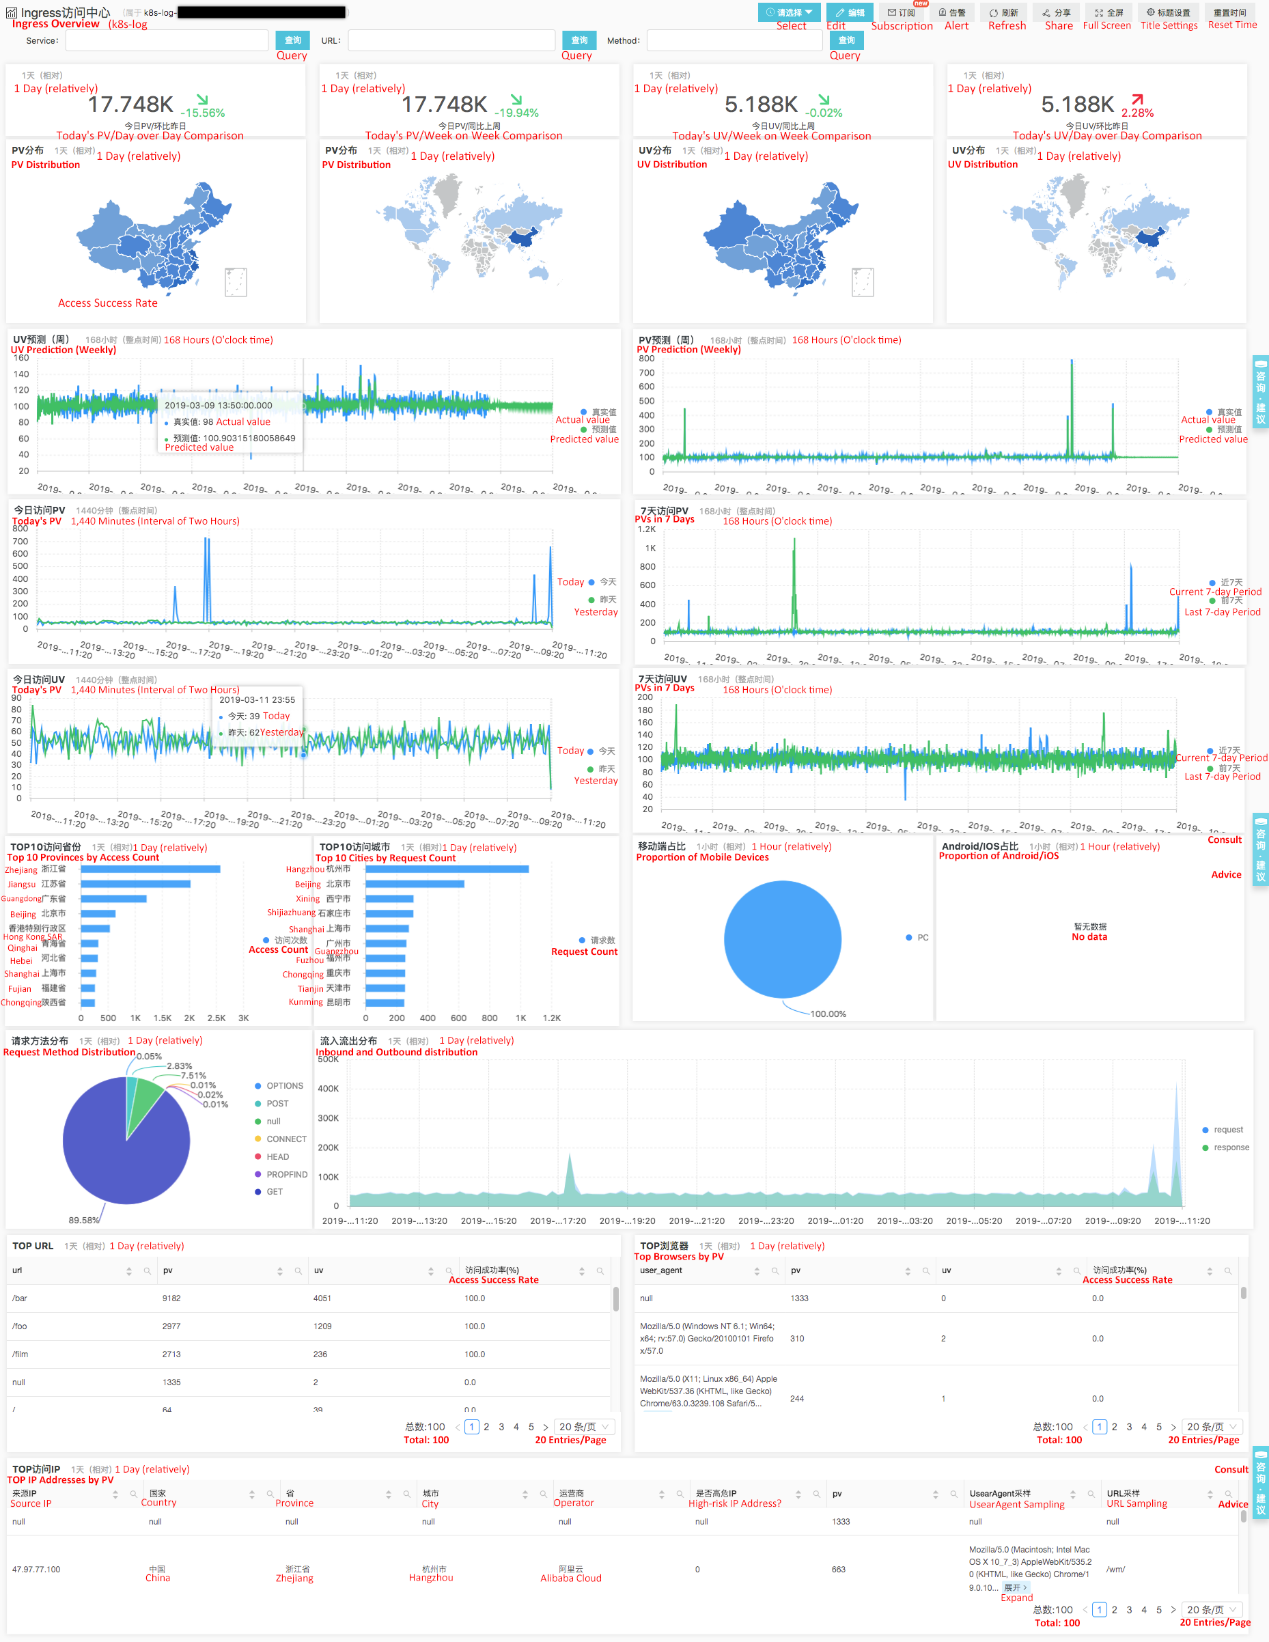
The Ingress Access Center report mainly displays access-related statistics and is generally used for operations analysis. The metrics in Ingress Access Center include UV/PV today, UV/PV distribution, UV/PV trends, top 10 provinces/cities by page views, top 10 browsers by PV, top IP addresses by PV, mobile access proportion, and Android/iOS proportion.
Ingress Monitoring Center displays real-time website monitoring data and is generally used for real-time monitoring and alerting. The metrics in Ingress Monitoring Center include request success rate, error rate, 5XX rate, unforwarded request rate, average latency, P95/P99/P9999 latency, status code distribution, Ingress request distribution, top 10 Services by PV, top 10 Services by errors, top 10 Services by high latency, and top 10 Services by traffic.
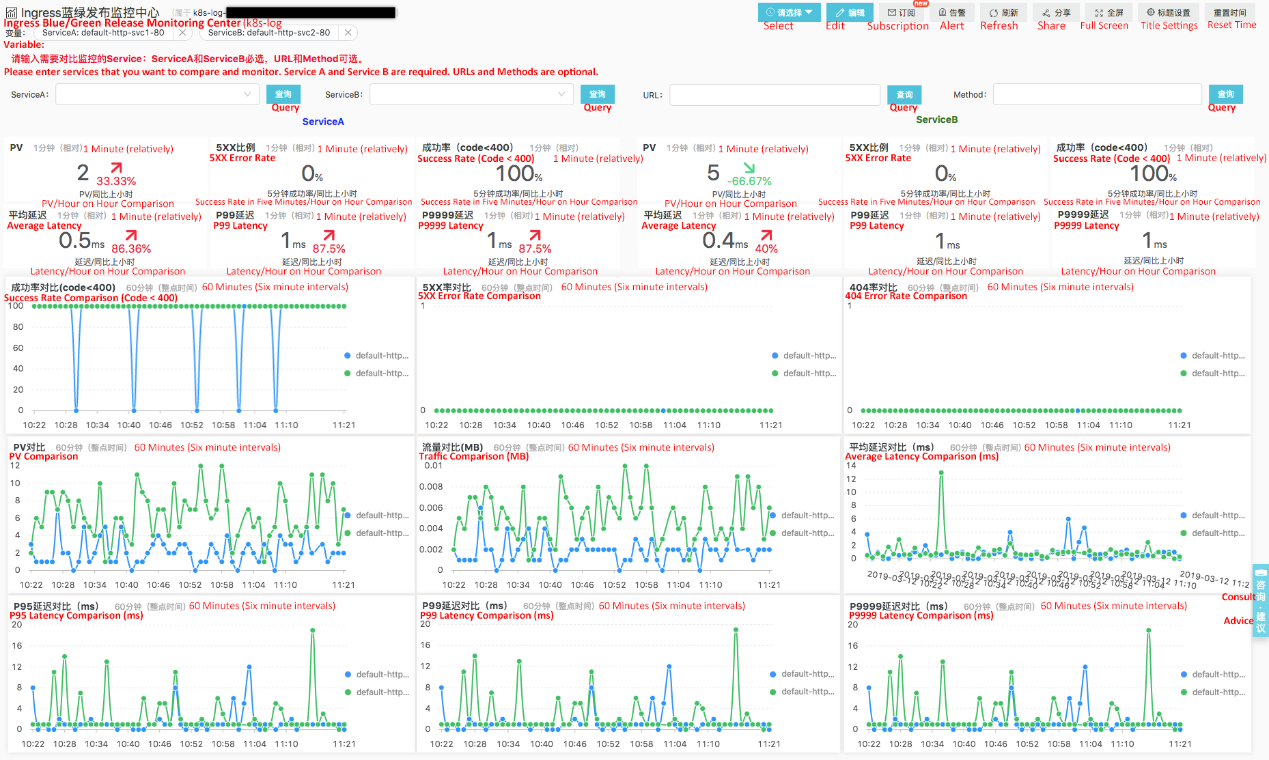
Ingress Blue/Green Release Monitoring Center is mainly used for real-time monitoring and comparison in the version release phase (between newer versions and older versions and between blue version and green version ) to quickly detect exceptions and roll back if necessary after a service is released. In this report, it is required to select the blue and green versions to be compared (Service A and Service B). The report displays related metrics based on selected blue and green versions, including PV, 5XX rate, success rate, average latency, P95/P99/P9999 latency, and traffic.
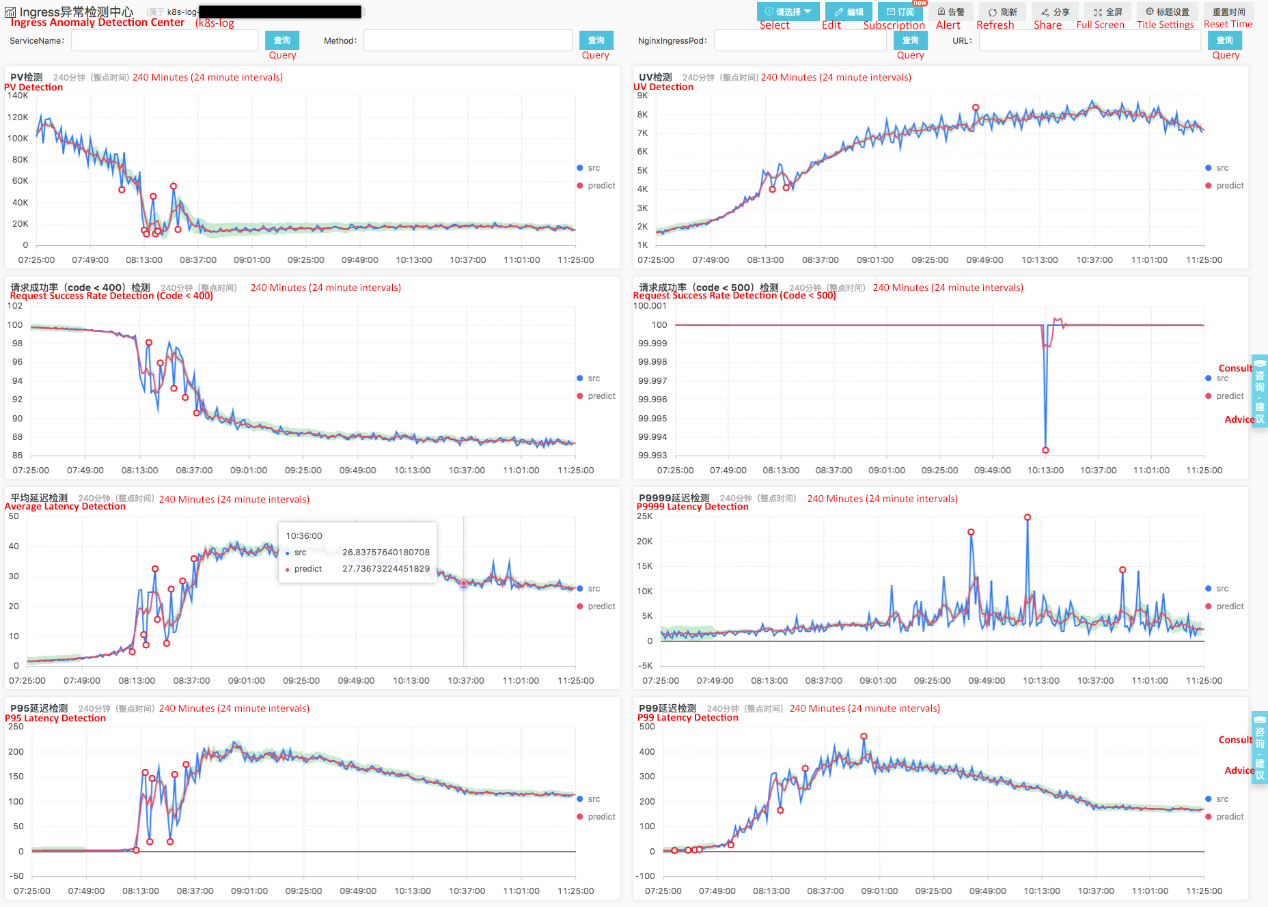
Ingress Anomaly Detection Center automatically detects exceptions from Ingress metrics and improves the efficiency in problem discovery by using machine learning algorithms provided by Log Service and various time series analysis algorithms.
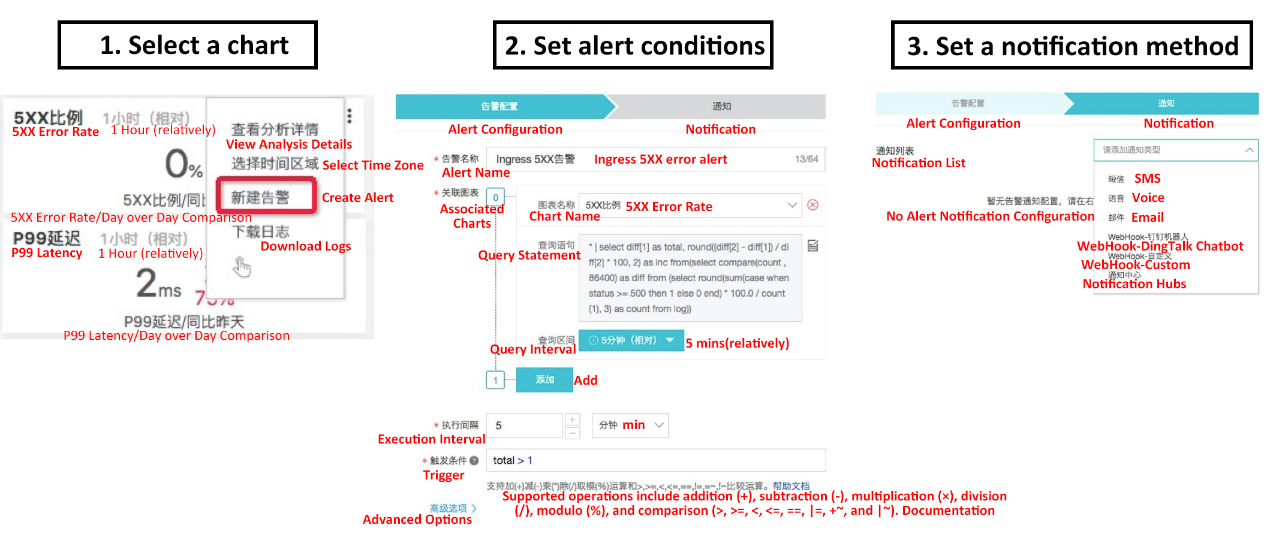
Because Ingress is the main entry to K8s website requests, real-time monitoring and alerting are one of the essential Ops methods. In Log Service, you can create alerts based on the preceding reports in just three steps. The following example configures a 5XX error alert for Ingress that runs every five minutes and will be triggered if the 5XX rate exceeds 1%.
In addition to common alerting features, Log Service supports the following features:
1.Associate multidimensional data. That is, alerting is determined by comprehensive analysis and judgment on multiple groups of SQL results to increase the alerting accuracy.
2.Support DingTalk Chatbot notifications and custom WebHook extensions in addition to SMS, voice message, email, and Notification Hubs.
3.Alerting records are also saved as logs to enable alerting on failed alerts.
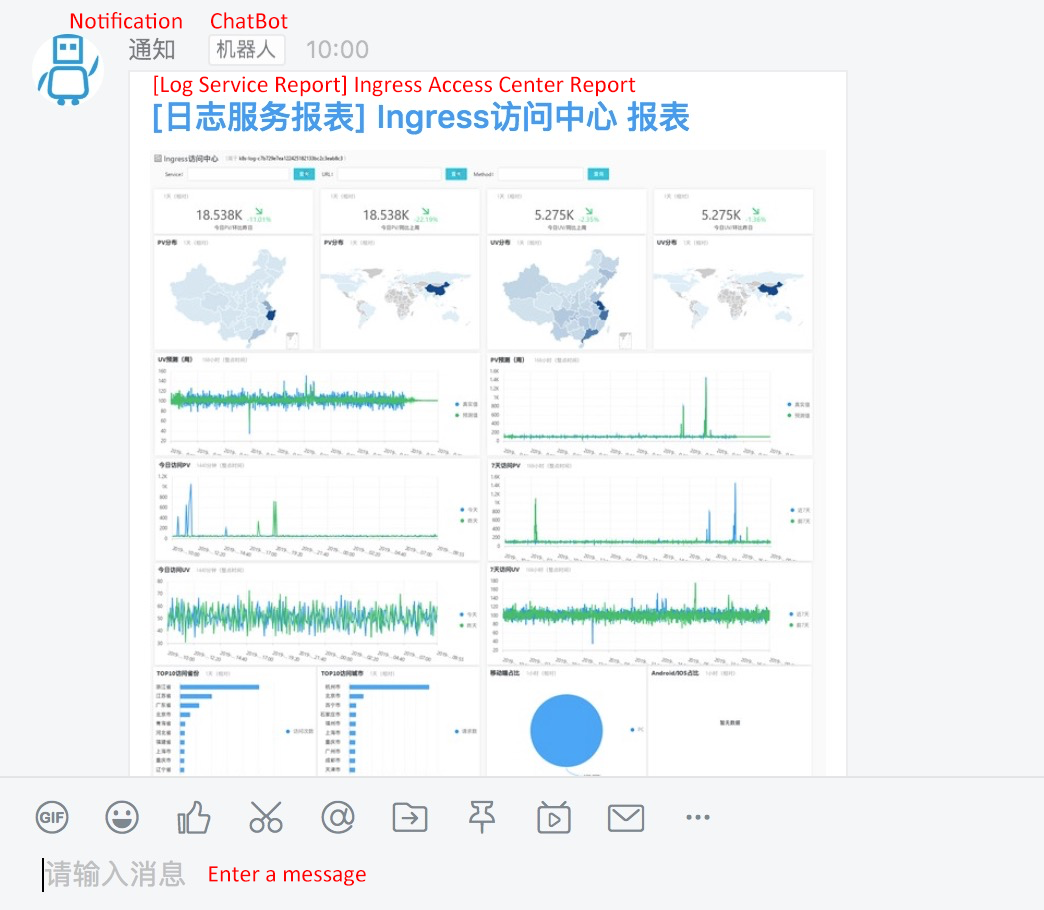
In addition to alert notifications, Log Service also supports report subscription. This feature regularly renders reports into pictures and sends pictures through email, DingTalk group message or other methods. For example, with this feature, you can send the website access statistics of yesterday to your operations chat group at 10:00 on each morning, send and archive reports in email groups on a weekly basis and send a monitoring report every five minutes when you release a new version.
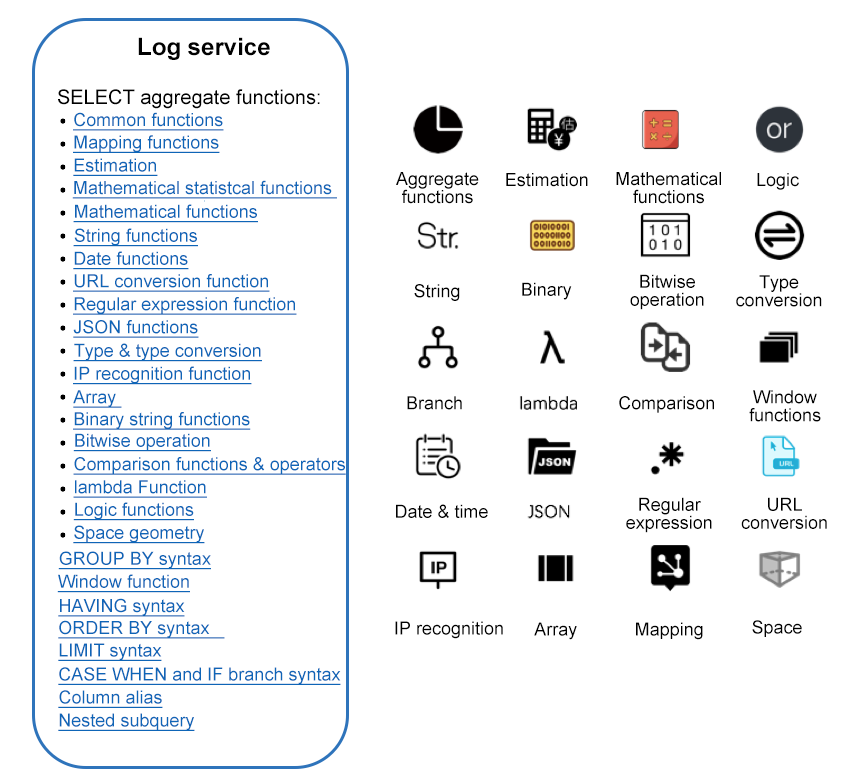
If the default reports in Container Service for Kubernetes cannot meet your analysis requirements, you can implement custom analysis and visualization directly by using features like SQL and Dashboard in Log Service.
1.Alibaba Cloud Log Service
2.Alibaba Cloud Container Service for Kubernetes
3.Ingress log analysis and monitoring
4.Alert configuration
5.Report subscription
6.Official Ingress documentation
7.Official Ingress Controllers documentation
A Brief Analysis on the Implementation of the Kubernetes Scheduler
High-Availability Deployment of Pods on Multi-Zone Worker Nodes

229 posts | 34 followers
FollowDavidZhang - December 30, 2020
Alibaba Cloud Native - February 15, 2023
Alibaba Cloud Native - September 4, 2023
Alibaba Cloud Native Community - May 17, 2022
Alibaba Cloud Blockchain Service Team - January 17, 2019
Alibaba Developer - December 24, 2019

229 posts | 34 followers
Follow Container Service for Kubernetes
Alibaba Cloud Container Service for Kubernetes is a fully managed cloud container management service that supports native Kubernetes and integrates with other Alibaba Cloud products.
Learn More Container Compute Service (ACS)
A cloud computing service that provides container compute resources that comply with the container specifications of Kubernetes
Learn More ACK One
Provides a control plane to allow users to manage Kubernetes clusters that run based on different infrastructure resources
Learn More Simple Log Service
An all-in-one service for log-type data
Learn MoreMore Posts by Alibaba Container Service