By Lingzhu
In a Kubernetes cluster, NGINX Ingress is used to realize the proxy forward of north-south traffic. NGINX Ingress generates specific routing rules based on Ingress resource configuration in the cluster. The Ingress resources manage public services. Generally, these services are accessed over HTTP. You can use NGINX Ingress and Ingress resources to implement the following scenarios:
1. Use the NGINX Ingress to forward all traffic from the client to a single Service:
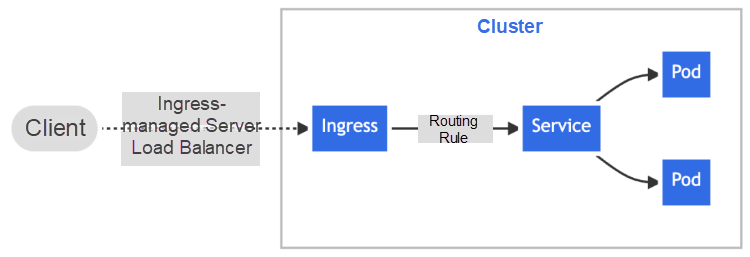
Figure: An Introduction to the Nginx Ingress Working Mode
2. Use Nginx Ingress to generate more complex routing and forwarding rules to forward all traffic from a single bound IP address to different Services based on the URL request path prefix.
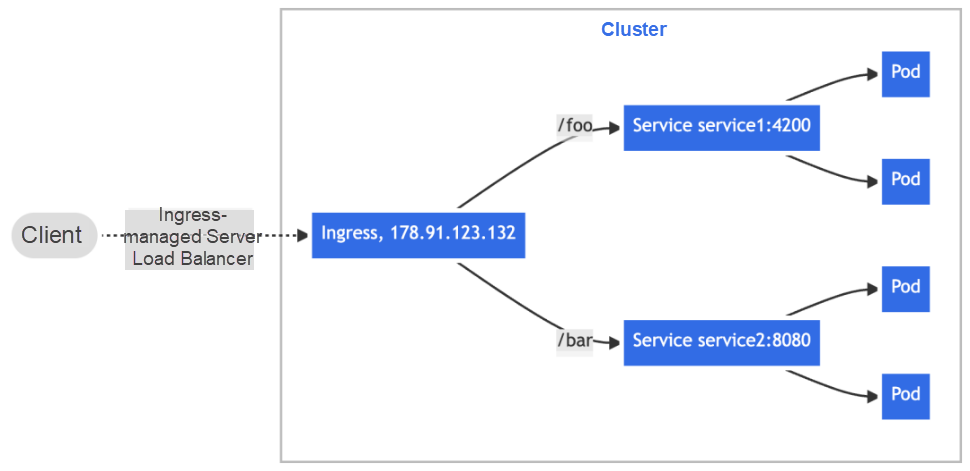
Figure: Forward Based on the URL Request Path
3. According to the Host field in the HTTP request header usually determined by the accessed domain name, traffic from a single bound IP address is distributed to different backend services to realize the Name-based Virtual Host capability.
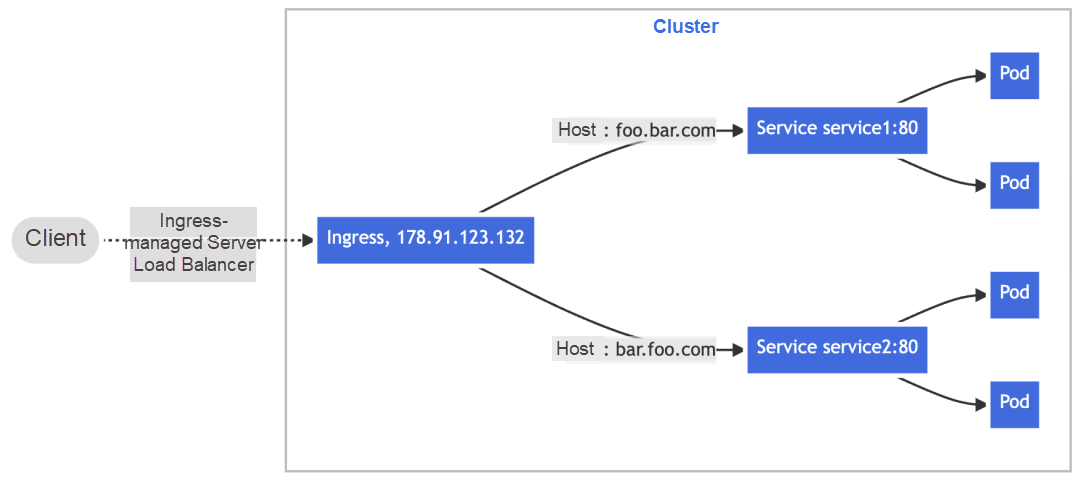
Figure: Forward Requests Based on the Host Header
We usually focus on two types of core metric data in the monitoring scenarios of NGINX Ingress gateway:
It is the load of the Nginx Ingress Controller Pod. When resource usage (such as CPU and memory) is saturated or overloaded, the external services of clusters will be unstable. For workload monitoring, we recommend paying attention to the USE metrics. They are Utilization, Saturation, and Errors. Alibaba Cloud Prometheus Service provides a preset performance monitoring dashboard. Please see Access to Workload Performance Monitoring Components [1] for more information.
It includes the analysis and statistics of the global traffic in a cluster, the traffic forwarded by an Ingress rule, the traffic of a Service, the success rate, error rate, latency, and the IP address and device of the request source. For ingress request traffic monitoring, we recommend paying attention to the RED metrics. They are Rate, Errors, and Duration. You can use the best practices in this article to implement access.
A major feature of the NGINX Ingress release of Kubernetes based on the open-source NGINX is that each process plays the role of Exporter and implements self-monitoring metrics that follow the Prometheus protocol format, such as:
nginx_ingress_controller_requests{canary="",controller_class="k8s.io/ingress-nginx",controller_namespace="kube-system",controller_pod="nginx-ingress-controller-6fdbbc5856-pcxkz",host="my.otel-demo.com",ingress="my-otel-demo",method="GET",namespace="default",path="/",service="my-otel-demo-frontend",status="200"} 2.401964e+06
nginx_ingress_controller_requests{canary="",controller_class="k8s.io/ingress-nginx",controller_namespace="kube-system",controller_pod="nginx-ingress-controller-6fdbbc5856-pcxkz",host="my.otel-demo.com",ingress="my-otel-demo",method="GET",namespace="default",path="/",service="my-otel-demo-frontend",status="304"} 111
nginx_ingress_controller_requests{canary="",controller_class="k8s.io/ingress-nginx",controller_namespace="kube-system",controller_pod="nginx-ingress-controller-6fdbbc5856-pcxkz",host="my.otel-demo.com",ingress="my-otel-demo",method="GET",namespace="default",path="/",service="my-otel-demo-frontend",status="308"} 553545
nginx_ingress_controller_requests{canary="",controller_class="k8s.io/ingress-nginx",controller_namespace="kube-system",controller_pod="nginx-ingress-controller-6fdbbc5856-pcxkz",host="my.otel-demo.com",ingress="my-otel-demo",method="GET",namespace="default",path="/",service="my-otel-demo-frontend",status="404"} 55
nginx_ingress_controller_requests{canary="",controller_class="k8s.io/ingress-nginx",controller_namespace="kube-system",controller_pod="nginx-ingress-controller-6fdbbc5856-pcxkz",host="my.otel-demo.com",ingress="my-otel-demo",method="GET",namespace="default",path="/",service="my-otel-demo-frontend",status="499"} 2
nginx_ingress_controller_requests{canary="",controller_class="k8s.io/ingress-nginx",controller_namespace="kube-system",controller_pod="nginx-ingress-controller-6fdbbc5856-pcxkz",host="my.otel-demo.com",ingress="my-otel-demo",method="GET",namespace="default",path="/",service="my-otel-demo-frontend",status="500"} 64
nginx_ingress_controller_requests{canary="",controller_class="k8s.io/ingress-nginx",controller_namespace="kube-system",controller_pod="nginx-ingress-controller-6fdbbc5856-pcxkz",host="my.otel-demo.com",ingress="my-otel-demo",method="GET",namespace="default",path="/",service="my-otel-demo-frontendproxy",status="200"} 59599
nginx_ingress_controller_requests{canary="",controller_class="k8s.io/ingress-nginx",controller_namespace="kube-system",controller_pod="nginx-ingress-controller-6fdbbc5856-pcxkz",host="my.otel-demo.com",ingress="my-otel-demo",method="GET",namespace="default",path="/",service="my-otel-demo-frontendproxy",status="304"} 15
nginx_ingress_controller_requests{canary="",controller_class="k8s.io/ingress-nginx",controller_namespace="kube-system",controller_pod="nginx-ingress-controller-6fdbbc5856-pcxkz",host="my.otel-demo.com",ingress="my-otel-demo",method="GET",namespace="default",path="/",service="my-otel-demo-frontendproxy",status="308"} 15709
nginx_ingress_controller_requests{canary="",controller_class="k8s.io/ingress-nginx",controller_namespace="kube-system",controller_pod="nginx-ingress-controller-6fdbbc5856-pcxkz",host="my.otel-demo.com",ingress="my-otel-demo",method="GET",namespace="default",path="/",service="my-otel-demo-frontendproxy",status="403"} 235
nginx_ingress_controller_requests{canary="",controller_class="k8s.io/ingress-nginx",controller_namespace="kube-system",controller_pod="nginx-ingress-controller-6fdbbc5856-pcxkz",host="e-commerce.
You can use the open-source or Alibaba Cloud Prometheus Agent and service discovery policies to capture and report metrics. You can use PromQL to analyze and configure alerts or Grafana to visualize metric data. However, there are many problems in production practice when using this type of monitoring implementation.
After you capture NGINX Ingress in a production or test cluster, you can find a large number of histogram metrics in the metric list it displays. In most cases, a histogram metric is named _bucket and used together with _count and _count. Also, it contains metrics not used for common analytics, such as:
By default, if you do not perform the drop operation in the metric_relabel_configs collection configuration of Prometheus, these metrics will be captured and reported, consuming a large amount of bandwidth and storage resources.
When the first problem encounters the Pull mode of Prometheus Agent, the situation becomes even worse. Even if a microservice with a low access frequency only had one request, all timelines related to it would always appear in the metric list exposed by Nginx Ingress. In each capture cycle, it is continuously collected and reported, wasting more resources.
The essential problem of this phenomenon is how to avoid reporting metrics when a counter metric stays the same during the observation period. We find it difficult to come up with a good solution through the Pull mode, and we will introduce new ideas later.
URL Path is difficult to process for monitoring metrics of HTTP traffic. If the URL Path of each request is directly added to the metric label for analysis purposes, a terrible dimension explosion will occur. However, if this information is not added, fine-grained drill-down analysis of metrics cannot be realized.
In the metrics exposed by NGINX Ingresses, the path label is used to record the corresponding request path fields in the Ingress rules, such as /(.+), /login, and /orders/(.+). This avoids the problem that the URL path details cannot be enumerated. However, if users want to implement more fine-grained drill-down analysis, for example, they want to see the statistics of the two different URL patterns, /users/(.+)/follower and /users/(.+)/follower, it is not scalable, and the computational logics of metrics preset in the NGINX Ingress implementation are not programmable.
Generally, the O&M personnel of a website system pay more attention to the information on the request source side. For example:
These data are not reflected in the metrics exposed by the NGINX Ingress.
Although it is not related to the metrics exposed by the NGINX Ingress, users generally use the Grafana dashboard provided by Kubernetes to visualize data, so it is a problem.
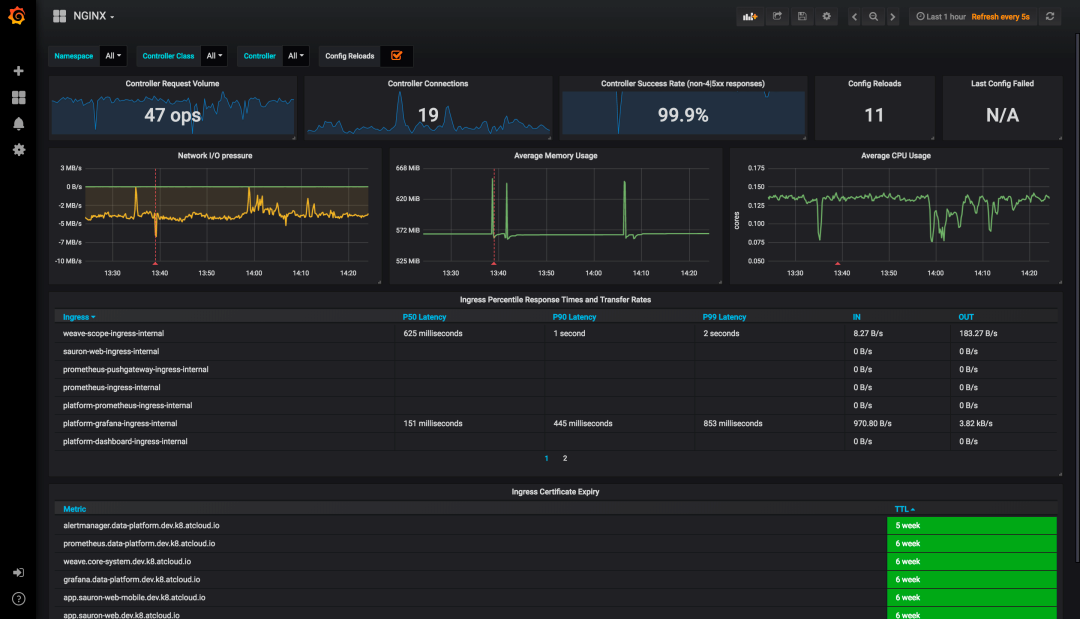
Figure: Kubernetes Grafana Dashboard Based on Self-Monitoring Metrics Produced by NGINX Ingress
As mentioned earlier, in monitoring scenarios for ingress traffic, we generally focus on the RED metrics: Rate, Errors, and Duration. However, in the face of the first screen of this dashboard, if you stand in the user's perspective to analyze the request traffic, you can find that its layout or information structure is unreasonable:
Therefore, providing a focused and easy-to-use dashboard is essential to implement NGINX Ingress Gateway Monitor.
To sum up, self-monitoring metrics based on the native NGINX Ingress have many problems in production practice. Therefore, *NGINX Ingress Gateway Monitor provided by Alibaba Cloud Prometheus Monitoring uses another method—Statistics based on access logs.
Similar to the open-source version of Nginx, Nginx Ingress prints the log of each request to its Ingress Controller Pod standard output, which is called access log:
172.16.0.20 - [172.16.0.20] - - [24/Mar/2023:17:58:26 +0800] "POST /api/cart HTTP/1.1" 500 32 "-" "Mozilla/5.0 (compatible; MSIE 7.0; Windows NT 5.1; Trident/3.0)" 475 0.003 [default-my-otel-demo-frontend-8080] 172.16.0.17:8080 32 0.003 500 8f4dafe7280e421e9f6ca01efeacaf2d my.otel-demo.com []
172.16.0.20 - [172.16.0.20] - - [24/Mar/2023:17:58:26 +0800] "GET /api/products/HQTGWGPNH4 HTTP/1.1" 200 758 "-" "Mozilla/5.0 (compatible; MSIE 7.0; Windows NT 5.1; Trident/3.0)" 334 0.001 [default-my-otel-demo-frontend-8080] 172.16.0.17:8080 758 0.002 200 e90aa6e5ffb7dfc03c0d576eb145fa29 my.otel-demo.com []
172.16.0.20 - [172.16.0.20] - - [24/Mar/2023:17:58:26 +0800] "POST /api/cart HTTP/1.1" 500 32 "-" "Mozilla/5.0 (compatible; MSIE 7.0; Windows NT 5.1; Trident/3.0)" 475 0.003 [default-my-otel-demo-frontend-8080] 172.16.0.17:8080 32 0.002 500 dd7b9f42dbe53e72efe8768b1811525a my.otel-demo.com []
172.16.0.20 - [172.16.0.20] - - [24/Mar/2023:17:58:26 +0800] "GET /api/products/L9ECAV7KIM HTTP/1.1" 200 752 "-" "Mozilla/5.0 (compatible; MSIE 7.0; Windows NT 5.1; Trident/3.0)" 334 0.002 [default-my-otel-demo-frontend-8080] 172.16.0.17:8080 752 0.001 200 883fec15467ed2e243a22345a0df9ed9 my.otel-demo.com []
172.16.0.20 - [172.16.0.20] - - [24/Mar/2023:17:58:26 +0800] "POST /api/cart HTTP/1.1" 500 32 "-" "Mozilla/5.0 (compatible; MSIE 7.0; Windows NT 5.1; Trident/3.0)" 475 0.007 [default-my-otel-demo-frontend-8080] 172.16.0.17:8080 32 0.008 500 08ae27b3de3e112c47572255f3702af0 my.otel-demo.com []
172.16.0.20 - [172.16.0.20] - - [24/Mar/2023:17:58:26 +0800] "POST /api/checkout HTTP/1.1" 200 315 "-" "Mozilla/5.0 (compatible; MSIE 7.0; Windows NT 5.1; Trident/3.0)" 765 0.194 [default-my-otel-demo-frontend-8080] 172.16.0.17:8080 315 0.194 200 4ed16b7f57394004d1d90383ce43a137 my.otel-demo.com []
172.16.0.20 - [172.16.0.20] - - [24/Mar/2023:17:58:26 +0800] "GET /api/products/6E92ZMYYFZ HTTP/1.1" 200 493 "-" "Mozilla/5.0 (compatible; MSIE 7.0; Windows NT 5.1; Trident/3.0)" 334 0.002 [default-my-otel-demo-frontend-8080] 172.16.0.17:8080 493 0.002 200 674e2ae6c941f48a0bcaf0a7c57821c1 my.otel-demo.com []
172.16.0.20 - [172.16.0.20] - - [24/Mar/2023:17:58:26 +0800] "GET /api/products/66VCHSJNUP HTTP/1.1" 200 515 "-" "Mozilla/5.0 (compatible; MSIE 7.0; Windows NT 5.1; Trident/3.0)" 334 0.001 [default-my-otel-demo-frontend-8080] 172.16.0.17:8080 515 0.002 200 245e689b406613eed45937d56c11339e my.otel-demo.com []
172.16.0.20 - [172.16.0.20] - - [24/Mar/2023:17:58:26 +0800] "GET /api/products/0PUK6V6EV0 HTTP/1.1" 200 438 "-" "Mozilla/5.0 (compatible; MSIE 7.0; Windows NT 5.1; Trident/3.0)" 334 0.001 [default-my-otel-demo-frontend-8080] 172.16.0.17:8080 438 0.002 200 b6d2416865d34f601c460a2b382806b7 my.otel-demo.com []
172.16.0.20 - [172.16.0.20] - - [24/Mar/2023:17:58:26 +0800] "POST /api/checkout HTTP/1.1" 200 321 "-" "Mozilla/5.0 (compatible; MSIE 7.0; Windows NT 5.1; Trident/3.0)" 772 0.214 [default-my-otel-demo-frontend-8080] 172.16.0.17:8080 321 0.214 200 63d8d6405b0d9a0ee65d6c1a13342f10 my.otel-demo.com []
By default, the access log printed by ACK Nginx Ingress contains the following information:
Based on this information, you only need to deploy a collector in the Kubernetes environment to achieve RED metrics statistics of ingress traffic through pre-aggregation calculation. At the same time, with the help of controllable technical means, major problems in monitoring based on Exporter metrics can be avoided:
Metric name: ingress_requests
Metric type: Gauge
Aggregation period: 30s
Metric description: It is the number of requests counted in the dimension corresponding to the label within an aggregation cycle.
Metric label:
| Label | Description | Value Example |
| ingress_cluster | The deployment name of NGINX Ingress controller | nginx-ingress-controller |
| ingress_cluster_instance | The pod name of NGINX Ingress controller | nginx-ingress-controller-6fdbbc5856-pcxkz |
| ingress_cluster_namespace | The namespace where the NGINX Ingress controller is located | kube-system |
| host | The Host name carried in the request header. It can identify which Ingress routing rule the traffic came from. If it is a non-compliant request, the value is "_". | my.otel-demo.com |
| service | The name of the backend service to which the request is forwarded. If it is a non-compliant request, the value is null. | default-my-otel-demo-frontend-8080 |
| uri | URL path after convergence | /(.+) |
| method | Request Method | GET |
| status_code | The status code returned | 200 |
Metric name: ingress_geoip_requests
Metric type: Gauge
Aggregation period: 30s
Metric description: It is the number of requests counted in the dimension corresponding to the label within an aggregation period. The label is enriched with geographic information.
Metric label:
| Label | Description | Value Example |
| ingress_cluster | The deployment name of NGINX Ingress controller | nginx-ingress-controller |
| ingress_cluster_instance | The pod name of NGINX Ingress controller | nginx-ingress-controller-6fdbbc5856-pcxkz |
| ingress_cluster_namespace | The namespace where the NGINX Ingress controller is located | kube-system |
| host | The Host name carried in the request header. It can identify which Ingress routing rule the traffic came from. If it is a non-compliant request, the value is "_". | my.otel-demo.com |
| service | The name of the backend service to which the request is forwarded. If it is a non-compliant request, the value is null. | default-my-otel-demo-frontend-8080 |
| country_codeC | Country code of the request source IP address | CN |
| country_name | Country name of the request source IP address | China |
| region_name | Region name of the request source IP address | Zhejiang |
| city_name | City name of the request source IP address | Hangzhou |
| timezone | Time zone of the request source IP address | Asia/Shanghai |
Note: We cut the information in several dimensions (such as URI, Method, and Status Code in the label). In common scenarios of this metric, the granularity of the request path is of the service level. Finer granularity requires more expensive storage and has a lower use value.
Metric name: ingress_user_agent_requests
Metric type: Gauge
Aggregation period: 30s
Metric description: It is the number of requests counted in the dimension corresponding to the label in an aggregation period. The label is enriched with device information.
Metric label:
| Label | Description | Value Example |
| ingress_cluster | The deployment name of NGINX Ingress controller | nginx-ingress-controller |
| ingress_cluster_instance | The pod name of NGINX Ingress controller | nginx-ingress-controller-6fdbbc5856-pcxkz |
| ingress_cluster_namespace | The namespace where the NGINX Ingress controller is located | kube-system |
| host | The Host name carried in the request header. It can identify which Ingress routing rule the traffic came from. If it is a non-compliant request, the value is "_". | my.otel-demo.com |
| service | The name of the backend service to which the request is forwarded. If it is a non-compliant request, the value is null. | default-my-otel-demo-frontend-8080 |
| browser_family | The browser type of the request source. If the browser type cannot be correctly identified, the value is "". | Chrome |
| device_category | The device type of the request source. If the device type cannot be correctly identified, the value is "". | mobile |
| os_family | The operating system type of the request source. If the operating system type cannot be correctly identified, the value is "". | iPhone |
Note: We cut the information in several dimensions (such as URI, Method, and Status Code in the label). In common scenarios of this metric, the granularity of the request path is of the service level. Finer granularity requires more expensive storage and has a lower use value.
Metric name: ingress_request_time
Metric type: GaugeHistogram
Aggregation period: 30s
Metric description: The bucket value of the request latency that is counted in the dimension corresponding to the label within an aggregation period
Metric label:
| Label | Description | Value Example |
| ingress_cluster | The deployment name of NGINX Ingress controller | nginx-ingress-controller |
| ingress_cluster_instance | The pod name of NGINX Ingress controller | nginx-ingress-controller-6fdbbc5856-pcxkz |
| ingress_cluster_namespace | The namespace where the NGINX Ingress controller is located | kube-system |
| host | The Host name carried in the request header. It can identify which Ingress routing rule the traffic came from. If it is a non-compliant request, the value is "_". | my.otel-demo.com |
| service | The name of the backend service to which the request is forwarded. If it is a non-compliant request, the value is null. | default-my-otel-demo-frontend-8080 |
| uri | URL path after convergence | /(.+) |
| method | Request Method | GET |
| status_code | The status code returned | 200 |
Note: The current metric type is not the common Histogram type. The value of each bucket is a counter model, but the GaugeHistogram type—the value of each bucket is an instantaneous value observed in the current aggregation period. Therefore, if you want to perform quantile calculation on this metric, refer to the expression:
histogram_quantile(0.95,sum(sum_over_time(ingress_request_time_bucket{...}[1m])) by (le)). Metric name: ingress_request_size
Metric type: Gauge
Aggregation period: 30s
Metric description: The total number of bytes in the request message that are counted in the dimension corresponding to the label within an aggregation period.
Metric label:
| Label | Description | Value Example |
| ingress_cluster | The deployment name of NGINX Ingress controller | nginx-ingress-controller |
| ingress_cluster_instance | The pod name of NGINX Ingress controller | nginx-ingress-controller-6fdbbc5856-pcxkz |
| ingress_cluster_namespace | The namespace where the NGINX Ingress controller is located | kube-system |
| host | The Host name carried in the request header. It can identify which Ingress routing rule the traffic came from. If it is a non-compliant request, the value is "_". | my.otel-demo.com |
| service | The name of the backend service to which the request is forwarded. If it is a non-compliant request, the value is null. | default-my-otel-demo-frontend-8080 |
Note: We cut the information in several dimensions (such as URI, Method, and Status Code in the label). In common scenarios of this metric, the granularity of the request path is of the service level. Finer granularity requires more expensive storage and has a lower use value.
Metric name: ingress_response_size
Metric type: Gauge
Aggregation period: 30s
Metric description: The total number of bytes in the response message that are counted in the dimension corresponding to the label within an aggregation period. This metric is limited by the implementation of NGINX Ingress. Only the number of bytes in the response body can be counted, and the size of the response header cannot be counted.
Metric label:
| Label | Description | Value Example | |
| ingress_cluster | The deployment name of NGINX Ingress controller | nginx-ingress-controller | |
| ingress_cluster_instance | The pod name of NGINX Ingress controller | nginx-ingress-controller-6fdbbc5856-pcxkz | |
| ingress_cluster_namespace | The namespace where the NGINX Ingress controller is located | kube-system | |
| host | The Host name carried in the request header. It can identify which Ingress routing rule the traffic came from. If it is a non-compliant request, the value is "_". | my.otel-demo.com | |
| service | The name of the backend service to which the request is forwarded. If it is a non-compliant request, the value is null. | default-my-otel-demo-frontend-8080 |
Note: We cut the information in several dimensions (such as URI, Method, and Status Code in the label). In common scenarios of this metric, the granularity of the request path is of the service level. Finer granularity requires more expensive storage and has a lower use value.
If you check the box to install NGINX Ingress when you create an ACK cluster, a default Ingress Controller Pod is created in the kube-system space of the cluster to implement gateway traffic proxy. You can use the following method to monitor the default NGINX Ingress gateway:
Log on to the Alibaba Cloud Prometheus Service page. Find the Prometheus instance that corresponds to your ACK cluster. On the Integration page, find Nginx Ingress Gateway Monitor:
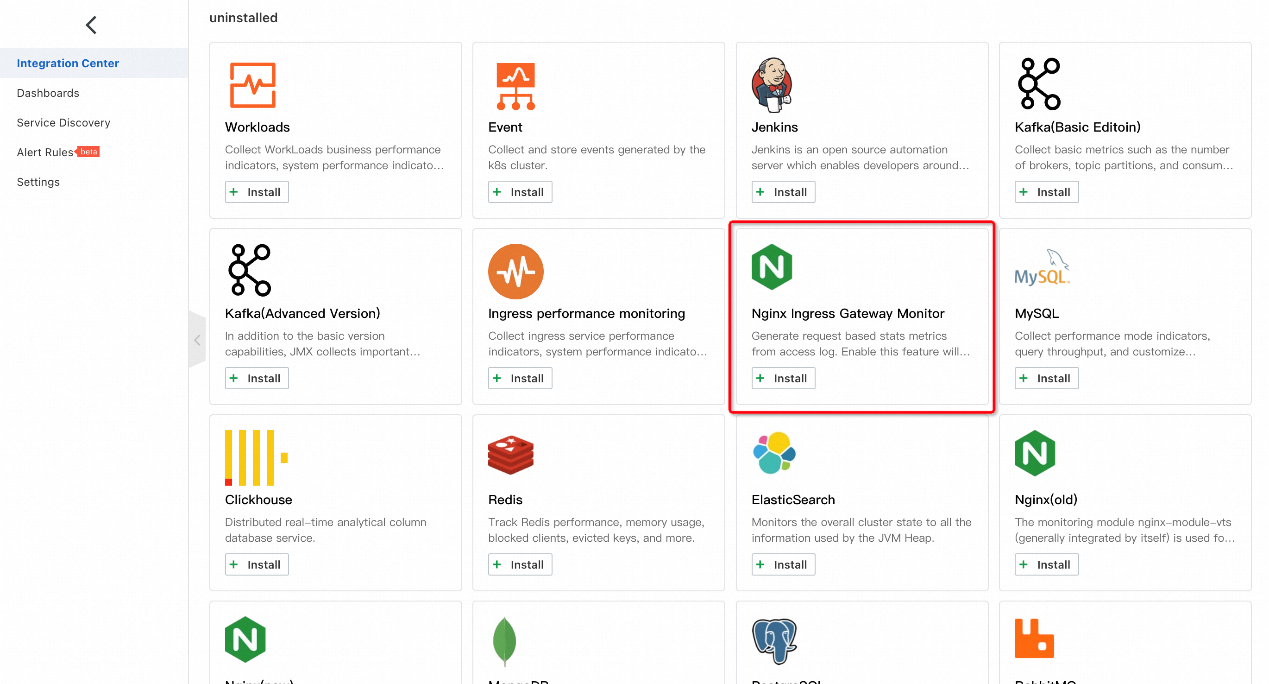
Figure: Select Nginx Ingress Gateway Monitor
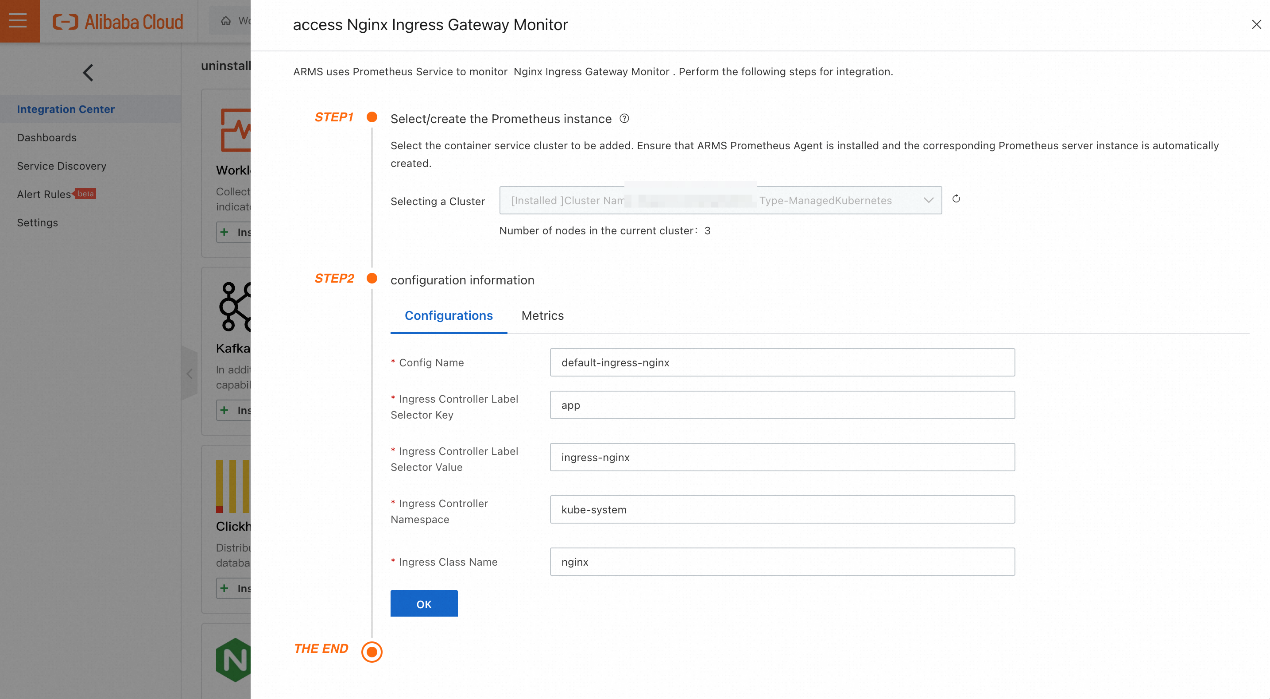
Figure: Installation Parameters
Note: If you start monitoring, a workload collector, DaemonSet, will be deployed in your Kubernetes cluster. The resource limit range is 0.5 CPU cores and 512MB memory. You can adjust the limit range based on the actual traffic volume of the gateway. Run the kubectl edit daemonset -narms-prom arms-vector command to change the limit range.
You can open the sidebar of NGINX Ingress gateway monitor integration card, find the dashboard named Universal Ingress Observability Dashboard on the Dashboards tab, and click to jump to Grafana to view data.
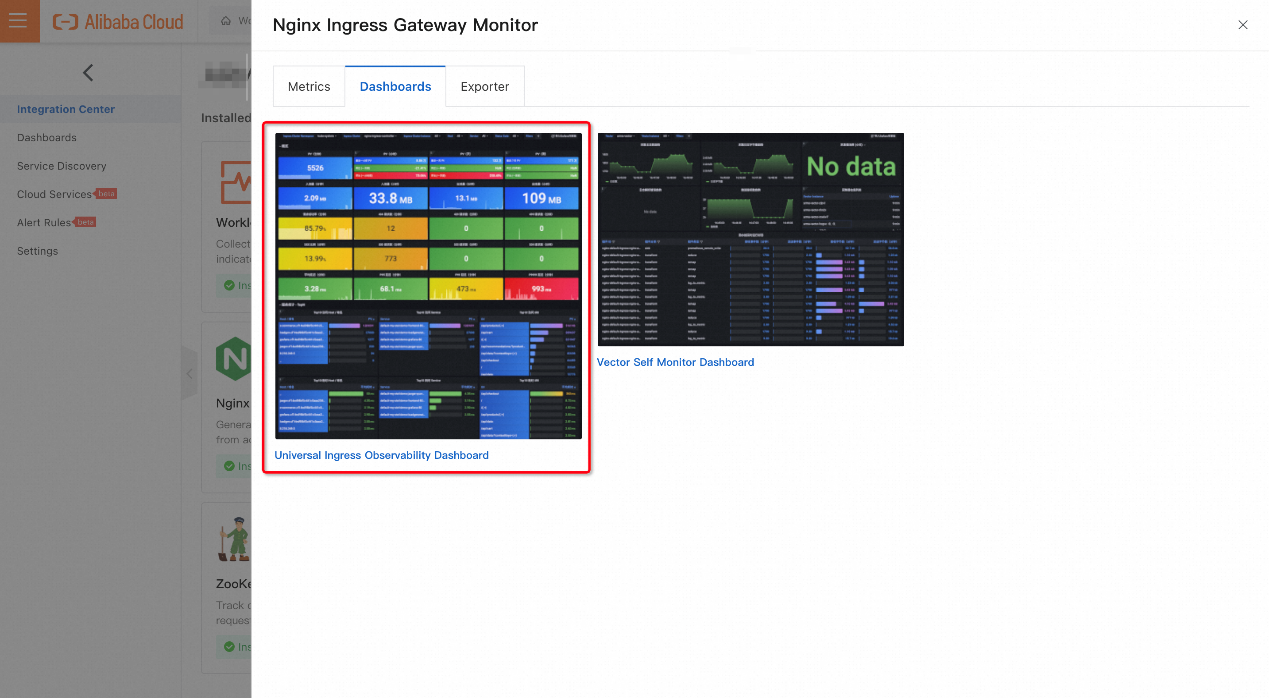
Figure: Dashboards TAB tab
If you have finished the installation in Step 2 and NGINX Ingress gateway has real traffic data, you can view the collected and reported metric data in the dashboard within 2-3 minutes.
If you use a self-managed NGINX Ingress gateway or deploy multiple NGINX Ingress gateways in the Kubernetes cluster by referring to the ACK official document Deploy Multiple Ingress Controllers [2], you can refer to this section for monitoring access.
The rest of the access process is unchanged. On the installation page of NGINX Ingress Gateway Monitor, adjust the parameters based on the actual situation.
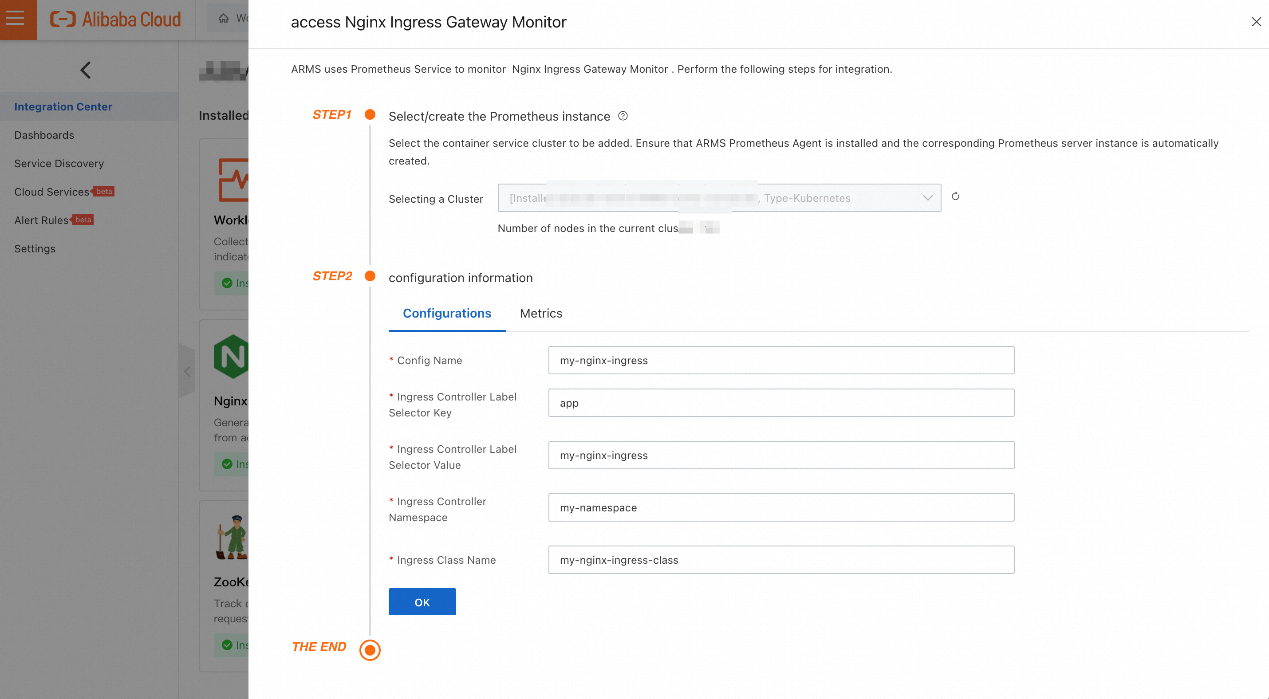
Figure: Custom Installation Parameters
The five parameters that require attention are described below:
Note: Monitoring multiple NGINX Ingress gateways will reuse the same workload collector. The default resource limit range is 0.5 CPU cores and 512MB memory. You can adjust the limit range based on the actual traffic volume of the gateway. Run the kubectl edit daemonset -narms-prom arms-vector command to change the limit range.
The entire visualization dashboard of NGINX Ingress gateway monitor is divided into six parts:
The overview section fully displays the elements defined by the RED metrics through a dashboard design that reflects traffic and service quality/experience: Rate, Errors, and Duration.
① Traffic Dashboard

Figure: PV and Traffic
The traffic dashboard is at the top of the Nginx Ingress gateway monitor dashboard to display the most important traffic-related data.
1. Minute-level PVs
2. Hour-level PVs
3. Day-level PVs
4. Week-level PVs
At the same time, thanks to the powerful visualization capability of Grafana, we can use different colors to distinguish whether metrics need attention. We can see that this practice has been applied in more than one scenario below:
② Service Quality/Experience Dashboard

Figure: Success Rate, Errors, and Duration
The Overview section also displays important metrics (such as success rate, errors, and duration). Here, a successful request is defined as a request with a response code of 1XX, 2XX, or 3XX. If the response code is 4XX or 5XX, the request is a failed or error request.
We have selected a set of error response codes that require special attention:
At the same time, the observable color is applied here, and the strategy is listed below:
1. Request Success Rate:
2. 5XX Ratio:
3. Number of errors: Yellow when the number is greater than 0
4. Duration metrics:
In addition, it should be noted that the duration metrics of correct requests and errors are quite different. Therefore, we recommend analyzing them differently by specifying a normal response code or an incorrect response code through the drop-down filter on the top.
The service statistics - TopN section displays the Host, service, and URI of the top 10 PVs, top 10 request duration, and top 10 5XX ratios.
① PV Access

Figure: PV Access Ranking
Here, you can use the drop-down filter on the top to specify the response status code to distinguish the ranking of normal request access and error request access.
② Request Duration

Figure: Request Duration Ranking
The color change strategy here is:
In addition, it should be noted that the duration metrics of correct requests and error requests are quite different. Therefore, we recommend analyzing them differently by specifying a normal response code or an incorrect response code through the drop-down filter on the top.
③ 5XX Ratio

Figure: 5XX Ratio Ranking
The color change strategy here is:
The service statistics-trend distribution section displays the trends of each RED metric in the Host dimension and the Service dimension, as well as the distribution of requests in terms of response status code, request methods, and Ingress Controller Pod.
① RED Metrics in the Host Dimension
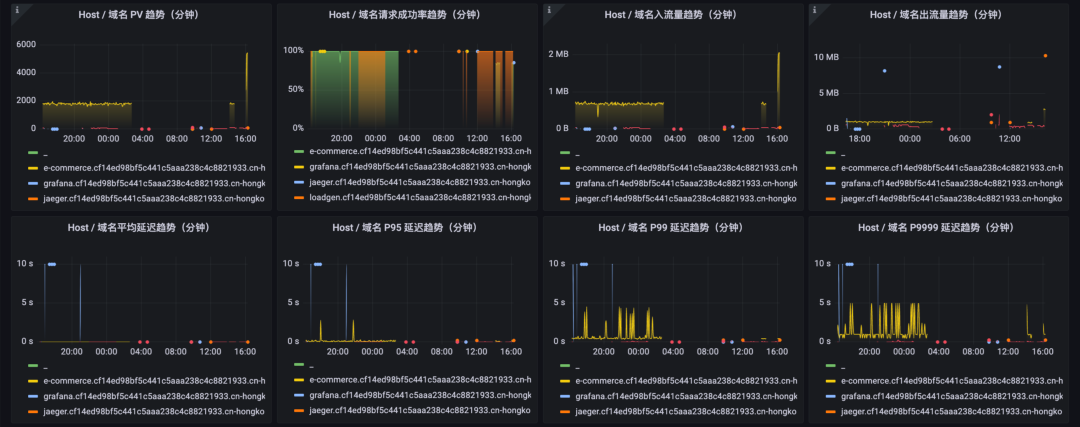
Figure: RED Metrics in the Host Dimension
This section of the dashboard shows the RED metric elements of each Host:
The PV trend and duration trend are controlled by the response status code change of the drop-down filter on the top, which can distinguish PV and duration of normal requests from error requests.
② RED Metrics in the Service Dimension
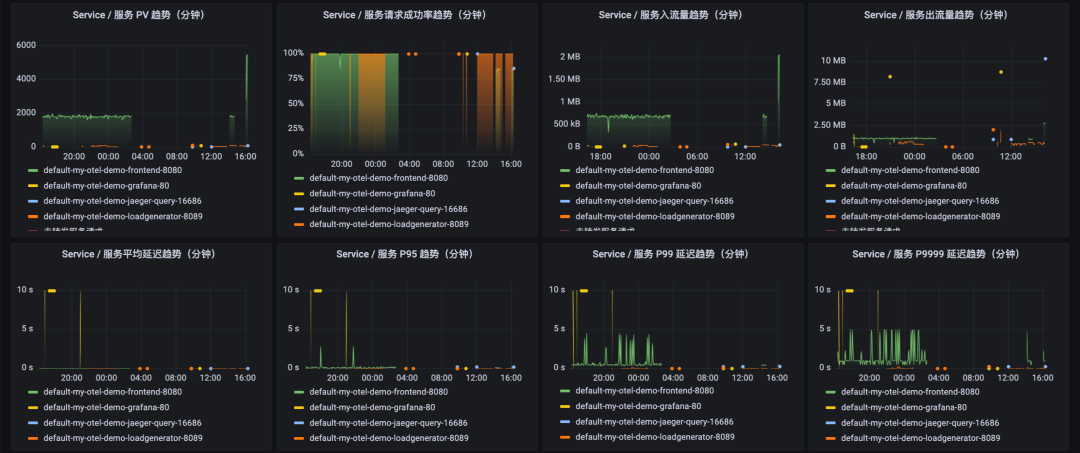
Figure: RED Metrics in the Service Dimension
This section of the dashboard shows the RED metrics elements of each Service:
The PV trend and duration trend are controlled by the response status code change of the drop-down filter on the top, which can distinguish PV and duration of normal requests from error requests.
③ Request Distribution

Figure: Distribution of Response Status Code, Request Method, and Ingress Controller Pod
This section of the dashboard uses a pie chart to show the request traffic distribution in each dimension:
Their statistical range is the current time period selected at the top.
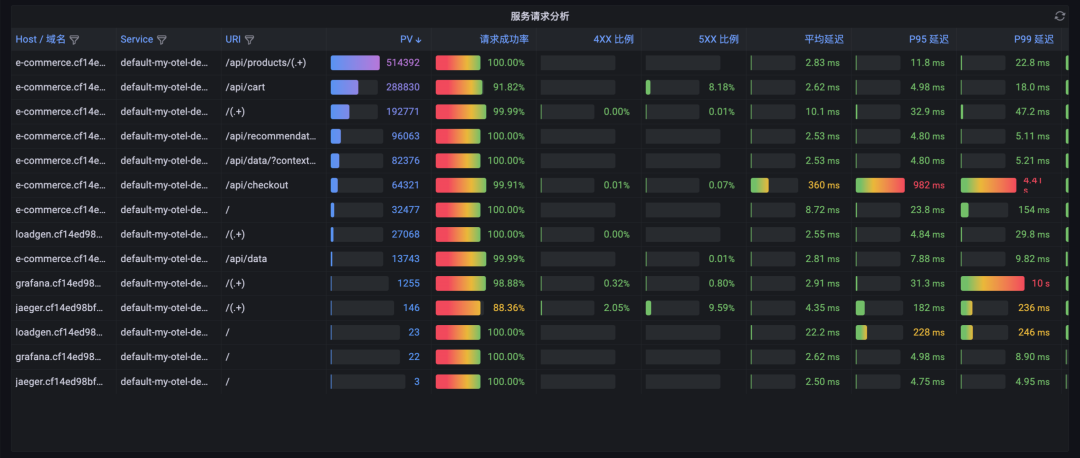
Figure: Request Analysis Table
The last section of service statistics is to present the PV, success rate, 4XX ratio, 5XX ratio, and the latency on the request path of Host, Service, and URI in table form in detail. Their statistical range is the current time period selected at the top. If you want to drill down to see more fine-grained URI request analysis statistics and extend URI convergence rules, please refer to Edit CR to Extend URI Convergence Rules in the advanced guide section.
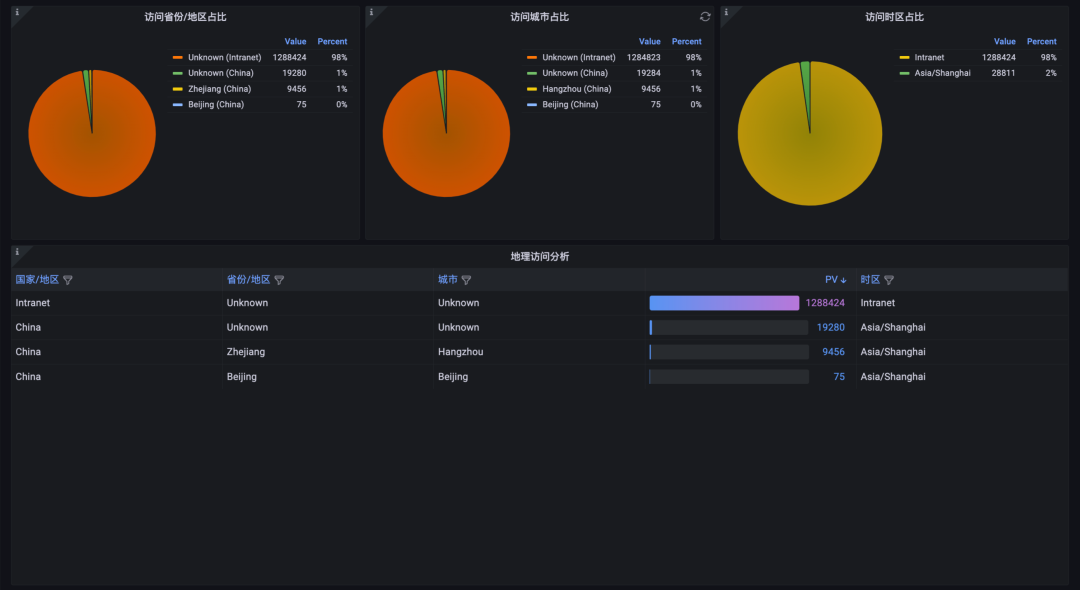
Figure: Statistics Based on Geographic Information
The geographic statistics section provides the proportion of each dimension and the corresponding table:
1. Province Visited
2. City Visited
3. Time Zone Visited
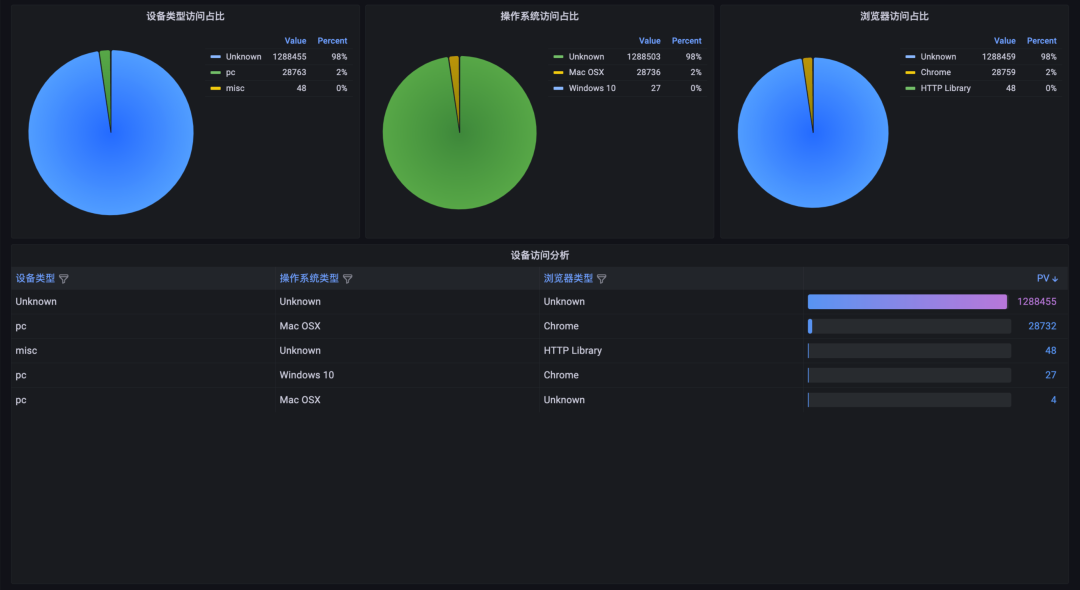
Figure: Device Statistics
The device statistics section provides the proportion of each dimension and the corresponding table:
1. Device Type
2. Operating System
3. Browser

Detailed data (such as request paths in access logs) cannot be enumerated. If you directly add these data to the label of Ingress request metric, the dimensions will diverge, the storage cost will increase sharply, and the metric query will be affected. Therefore, the collector that implements Nginx Ingress gateway monitor will refine the request path based on a set of URI convergence rules. Each convergence rule consists of two parts:
$/api/product/(.+)$)When the collector is enabled for the first time, it scans the Ingress resources of the current Kubernetes cluster and assembles convergence rules based on the Path information provided by the existing routing rules. If this part of the configuration cannot meet your analysis and statistical needs, please follow the following steps to extend the configuration.
First, execute the kubectl edit ingresslog -narms-prom ingresslog-<Your Collection Configuration Name> to enter the editing window of the custom resource (such as kubectl edit ingresslog -narms-prom ingresslog-default-ingress-nginx).
Please find the spec.logParser.reduceUri.allowList field and expand it. For example, it may have only two convergence rules by default:
reduceUri:
      allowList:
        - pattern: ^/(.+)$
          reduced: /(.+)
        - pattern: ^/$
          reduced: /
The allowList field is an array object. Each element of the allowList field indicates a convergence rule. The pattern field under each convergence rule indicates the match expression, and the reduced field indicates the converged text.
You can use the following examples to change the fields based on your business scenario:
    reduceUri:
      allowList:
        - pattern: ^/api/cart$
          reduced: /api/cart
        - pattern: ^/api/checkout$
          reduced: /api/checkout
        - pattern: ^/api/data$
          reduced: /api/data
        - pattern: ^/api/data/\?contextKeys=(.+)$
          reduced: /api/data/?contextKeys=(.+)
        - pattern: ^/api/products/(.+)$
          reduced: /api/products/(.+)
        - pattern: ^/api/recommendations/\?productIds=(.+)$
          reduced: /api/recommendations/?productIds=(.+)
        - pattern: ^/(.+)$
          reduced: /(.+)
        - pattern: ^/$
          reduced: /
Here, put the shortest rule that matches path to the end of the list in order, such as ^/$. Wait 2-3 minutes after you save the configuration, and then you can view the refined metric data that is expanded based on the URI convergence rule on the dashboard.
Extending URI convergence rules will refine your timeline, resulting in an increase in the number of generated metrics and affecting billing. Therefore, please pay attention to changes in the number of metrics in a timely manner.
Note 1: We recommend backing up URI convergence rules locally in a timely manner because the corresponding IngressLog custom resources will be deleted by default after the current NGINX Ingress gateway monitor is uninstalled.
Note 2: Do not modify other configurations in the IngressLog custom resource. Otherwise, NGINX Ingress gateway monitor cannot work properly.
[1] Install and configure Workload Performance Monitoring
https://www.alibabacloud.com/help/en/application-real-time-monitoring-service/latest/workload
[2] Deploy multiple Ingress controllers in a cluster
https://www.alibabacloud.com/help/en/container-service-for-kubernetes/latest/deploy-multiple-ingress-controllers-in-a-cluster
Kubernetes documentation:
Official documentation of Alibaba Cloud Container Service for Kubernetes (ACK):
Analysis of Alibaba Cloud Container Network Data Link (6): ASM Istio
Observability | What Metrics Should We Focus on When We Use Prometheus Service to Monitor SNMP?

212 posts | 13 followers
FollowAlibaba Cloud Native - February 15, 2023
Alibaba Cloud Native Community - April 21, 2025
Alibaba Cloud Indonesia - February 13, 2026
Alibaba Cloud Native - May 23, 2023
Alibaba Cloud Native Community - December 6, 2022
DavidZhang - December 30, 2020

212 posts | 13 followers
Follow Best Practices
Follow our step-by-step best practices guides to build your own business case.
Learn More Cloud-Native Applications Management Solution
Accelerate and secure the development, deployment, and management of containerized applications cost-effectively.
Learn More Lindorm
Lindorm is an elastic cloud-native database service that supports multiple data models. It is capable of processing various types of data and is compatible with multiple database engine, such as Apache HBase®, Apache Cassandra®, and OpenTSDB.
Learn More Function Compute
Alibaba Cloud Function Compute is a fully-managed event-driven compute service. It allows you to focus on writing and uploading code without the need to manage infrastructure such as servers.
Learn MoreMore Posts by Alibaba Cloud Native