Container Service for Kubernetes (ACK) allows you to configure the nginx-ingress-controller component for an ACK cluster. This component provides URLs that can be visited by servers outside the cluster, and supports server load balancing, SSL termination, and name-based virtual hosting. You can also use nginx-ingress-controller to write the log data of HTTP requests to stdout. You can enable Simple Log Service for an ACK cluster when you create the cluster. After Simple Log Service is enabled, you can monitor nginx-ingress-controller in real time and view dashboards in Simple Log Service. The dashboards show statistics that are collected from the access log of nginx-ingress-controller. This topic describes how to configure log collection for nginx-ingress-controller and how to view the collected log.
Table of contents
Prerequisites
The logtail-ds component is installed in your cluster.
By default, logtail-ds is installed when you create a cluster. If this component is not installed, you can manually install it. For more information, see Collect text logs from Kubernetes containers in DaemonSet mode.
The alibaba-log-controller component is updated.
Run the
kubectl edit deployment alibaba-log-controller -n kube-systemcommand to update the component.
Configure log collection for nginx-ingress-controller
Method 1: Use the ACK console
Log on to the ACK console. In the left-side navigation pane, click Clusters.
On the Clusters page, find the cluster that you want to manage and click its name. In the left-side navigation pane, choose .
On the Add-ons page, click the Networking tab, find the Nginx Ingress Controller component, click the
 icon in the lower-right corner of the card, and then click Enable Log Collection. In the message that appears, click OK to enable log collection.
Method 2: Use the CLI
ACK defines a type of CustomResourceDefinition (CRD) named AliyunLogConfig. You can create an AliyunLogConfig to configure log collection. alibaba-log-controller automatically generates configurations for Simple Log Service to collect log data and update data in relevant dashboards.
Take note of the following items when you create an AliyunLogConfig:
If nginx-ingress-controller already exists, you must recreate the pods of nginx-ingress-controller to enable log collection after you create an AliyunLogConfig.
Make sure that the version of alibaba-log-controller is
0.2.0.0-76648ee-aliyunor later. After you update alibaba-log-controller, if you find that an AliyunLogConfig is already created, delete the AliyunLogConfig and recreate it.The AliyunLogConfig applies only to the default log format that ACK defines for the Ingress controller. If you have changed the log format, you must modify the
processor_regexsettings in the AliyunLogConfig configuration. For more information, see Use CRDs to collect container logs in DaemonSet mode.Set
IncludeLabelto the label information that is retrieved by using the docker inspect command.A namespace and a container name in a Kubernetes cluster are separately mapped to the following Docker labels:
io.kubernetes.pod.namespaceandio.kubernetes.container.name. For example, the pod that you create belongs to the backend-prod namespace and the container name is worker-server.If you specify
io.kubernetes.pod.namespace : backend-prod, the logs of all containers in the pods in the specified namespace are collected.If you specify
io.kubernetes.container.name : worker-server, the log of the specified container is collected.
We recommend that you specify only the
io.kubernetes.pod.namespaceandio.kubernetes.container.namelabels. If you want to specify other labels, you can configure the IncludeEnv or ExcludeEnv parameter. For more information, see Use the Simple Log Service console to collect container stdout and stderr in DaemonSet mode.
To disable log collection for nginx-ingress-controller, delete the AliyunLogConfig.
Create a file named k8s-nginx-ingress.yaml and copy the following YAML template to the file:
apiVersion: log.alibabacloud.com/v1alpha1
kind: AliyunLogConfig
metadata:
  # The name of the AliyunLogConfig. The name must be unique in the cluster.
  name: k8s-nginx-ingress
  # The namespace of the AliyunLogConfig. Set the value to the namespace of the Ingress controller from which you want to collect logs.
  namespace: kube-system
spec:
  # The name of the Logstore that you want to use.
  logstore: nginx-ingress
  # The product code. Do not change the value.
  productCode: k8s-nginx-ingress
  # The Logtail configuration.
  logtailConfig:
    inputType: plugin
    # The name of the Logtail configuration. The name must be the same as the value of the metadata.name parameter.
    configName: k8s-nginx-ingress
    inputDetail:
      plugin:
        inputs:
          - type: service_docker_stdout
            detail:
              IncludeLabel: # The labels of the Docker containers from which you want to collect logs.
                # The name of the container from which you want to collect logs is nginx-ingress-controller.
                # If you collect logs from multiple Ingress controllers, duplicate logs may be collected. We recommend that you read and understand the description of the IncludeLabel parameter.
                io.kubernetes.container.name: nginx-ingress-controller
              Stderr: true
              Stdout: true
        processors:
          - type: processor_regex # Use a regular expression to extract fields.
            detail:
              KeepSource: false
              Keys: # The extracted fields are sorted in the following order:
                - client_ip
                - x_forward_for
                - remote_user
                - time
                - method
                - url
                - version
                - status
                - body_bytes_sent
                - http_referer
                - http_user_agent
                - request_length
                - request_time
                - proxy_upstream_name
                - upstream_addr
                - upstream_response_length
                - upstream_response_time
                - upstream_status
                - req_id
                - host
                - proxy_alternative_upstream_name
              NoKeyError: true
              NoMatchError: true
              # The regular expression that is used to extract fields. If a log matches the regular expression, the values of the preceding fields are automatically specified based on the content in each capture group.
              Regex: ^(\S+)\s-\s\[([^]]+)]\s-\s(\S+)\s\[(\S+)\s\S+\s"(\w+)\s(\S+)\s([^"]+)"\s(\d+)\s(\d+)\s"([^"]*)"\s"([^"]*)"\s(\S+)\s(\S+)+\s\[([^]]*)]\s(\S+?(?:,\s\S+?)*)\s(\S+?(?:,\s\S+?)*)\s(\S+?(?:,\s\S+?)*)\s(\S+?(?:,\s\S+?)*)\s(\S+)\s*(\S*)\s*\[*([^]]*)\]*.*
              SourceKey: content
Run the following command to create an AliyunLogConfig:
kubectl apply -f k8s-nginx-ingress.yaml
View the access log and dashboards of nginx-ingress-controller
Log on to the Simple Log Service console.
In the Projects section, click the name of the project that you specified when you created the ACK cluster. The details page of the project appears. By default, a project that is named in the format of k8s-log-{cluster-id} is created for the ACK cluster.
In the left-side navigation pane, click the
 icon. Then, click a dashboard in the dashboard list to view data on the dashboard.
Ingress overview
The Ingress overview dashboard displays information about network traffic that flows through nginx-ingress-controller for a website. You can view the following information:
Website data of the last 24 hours, including the number of page views (PVs), the number of unique visitors (UVs), inbound and outbound traffic, the average latency, the proportion of mobile users, and the proportions of 5xx errors and 404 errors.
Website data of the last 1 minute, including the number of PVs, the number of UVs, the success rate of requests, the average latency, the P95 latency, and the P99 latency.
Detailed information about requests within the last 24 hours, including the PV trend of the last 24 hours (based on the PVs within the last 24 hours), the PV trend of the last 7 days (based on the PVs within the last 7 days), regional distribution of request sources, the top N source areas and cities, the proportion of mobile users, and the proportions of Android users and iOS users.
Top N URLs within the last 1 hour, including the 10 URLs with the highest PVs, the 10 URLs with the highest latencies, the 10 URLs that return the most 5xx errors, and the 10 URLs that return the most 404 errors.
Ingress access center
The Ingress access center dashboard displays up-to-date information about requests. You can obtain and analyze the following data to help make business decisions: the numbers of UVs and PVs within the last 24 hours, the regional distribution of PVs and UVs, the top N areas by request, the top N cities by request, the top N browsers with the highest PVs, the top N source IP addresses with the highest PVs, the proportion of mobile users, and the proportions of Android users and iOS users.
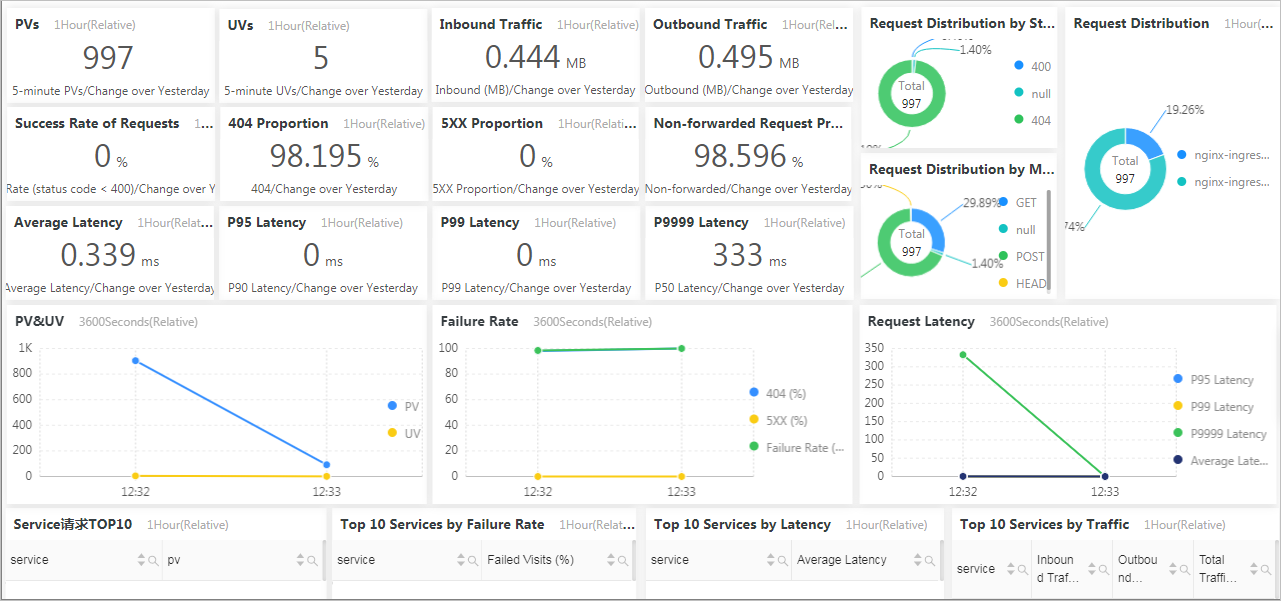
Ingress monitoring center
The Ingress monitoring center dashboard provides real-time monitoring and alerting data of the website. You can view the following data within the last 1 hour: the success rate of requests, the proportion of 5xx errors, the proportion of 404 errors, the proportion of requests that are not forwarded, the average latency, the P95 latency, the P99 latency, the P999 latency, the request distribution by status code, the proportion of PVs on each Ingress, the top 10 Services with the highest PVs, the top 10 Services with the highest request failure rates, the top 10 Services with the highest average latencies, and the top 10 Services with the most requests.
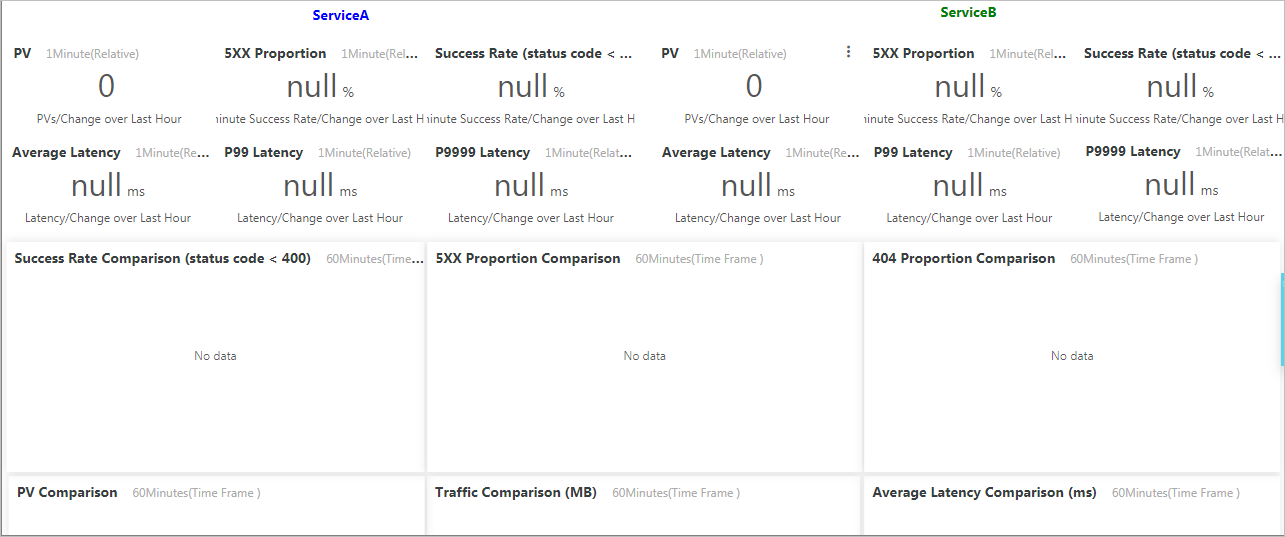
Ingress monitoring center for blue-green deployments
The Ingress monitoring center for blue-green deployments dashboard displays the real-time monitoring data of the Services that are used to expose the old and new application versions. The dashboard also compares the monitoring data of the Services. This allows you to identify exceptions and roll back the application version at the earliest opportunity. You must specify ServiceA and ServiceB for monitoring data comparison. The dashboard displays the following dynamic monitoring data of each Service: the number of PVs, the proportion of 5xx errors, the success rate of requests, the average latency, the P95 latency, the P99 latency, the P999 latency, and the number of requests.
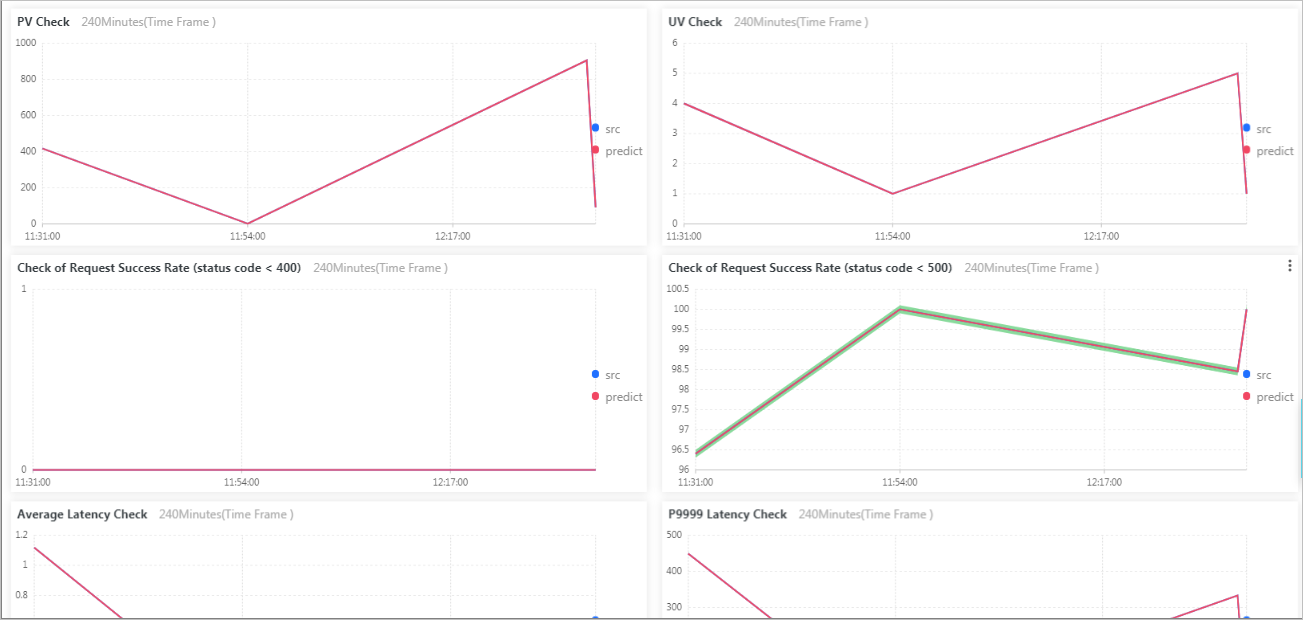
Ingress exceptions center
The Ingress exceptions center automatically detects anomalies in the log of nginx-ingress-controller. This service uses the machine learning algorithms provided by Simple Log Service and the time series analysis algorithms to improve detection efficiency.
Configure alerting
Simple Log Service enables interactive log analytics and provides visualized dashboards. You can also use Simple Log Service to configure alerting based on data on the dashboards. You can select one or more alert notification methods, such as emails, DingTalk chatbot webhooks, custom webhooks, and Short Message Service (SMS) messages.
For more information about how to configure alerting, see Configure an alert rule.
The following example describes how to configure alerting based on the proportion of 5xx errors. After you configure alerting, the system checks whether the alert conditions are met every 5 minutes. If the proportion of 5xx errors within the specified time range reaches 1%, an alert is triggered.
In the Dashboard section, click the Ingress Monitoring Center dashboard. On the Ingress Monitoring Center page, move the pointer over the
 icon in the upper-right corner of the 5XX Proportion chart and click Save as Alert (Old Version).
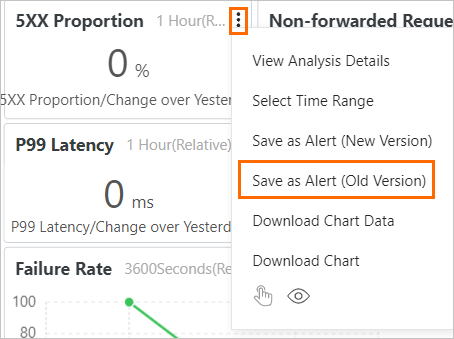
In the Create Alert wizard, set Alert Name, Associated Chart, Frequency, and Trigger Condition. The
totalfield in the query statement indicates the proportion of 5XX errors. Specify total > 1 in the Trigger Condition field.On the Notifications wizard page, select one or more alerting methods based on your requirements and set the parameters. Then, click Submit to create the alert rule.
Subscribe to a dashboard
Simple Log Service allows you to subscribe to dashboards. This feature takes snapshots of a dashboard and sends the snapshots by email or DingTalk group message at a specified interval.
For more information about how to subscribe to a dashboard, see Subscribe to a dashboard.
The following example describes how to subscribe to the Ingress overview dashboard. After you subscribe to the dashboard, a message is sent at 10:00 every day to the specified DingTalk group.
In the Dashboard section, click the Ingress Overview V1.2 dashboard. On the Ingress Overview V1.2 page, choose .
In the Create Subscription wizard, select Daily and 10:00 in the Frequency field. Turn off Add Watermark. Then, click Next.
On the Notifications wizard page, select WebHook-DingTalk Bot from the Notifications drop-down list and set Request URL to the webhook URL of your DingTalk chatbot. Then, click Submit to complete the configuration.
Use Ingress Dashboard with ARMS
Log on to the Log Service console.
In the Projects section, click the name of the project that you specified when you created the ACK cluster. The details page of the project appears. By default, a project that is named in the format of k8s-log-{cluster-id} is created for the ACK cluster.
In the left-side navigation pane, click the
 icon. Click Ingress Overview V1.2 in the Dashboard list to obtain the required information. For example, you can find the Top 10 Request URLs by Latency section and check the URL(ARMS Troubleshooting) field to view the top 10 request URLs sorted by latency. You can click the URL to go to the ARMS trace query page of the corresponding Service. You can view the trace details of the Service in the ARMS console.
References
For more information about how to filter the collected logs, see Filter logs.