[Discontinued] Monitor basic cluster resources with Cloud Monitor
Use Cloud Monitor Kubernetes monitoring to view CPU, memory, and network usage of workloads in ACK clusters and keep clusters running reliably. Note: this feature is being phased out.
Kubernetes container monitoring in Cloud Monitor is being phased out. Migrate to Managed Service for Prometheus (Prometheus), which provides equivalent coverage.
Cloud Monitor tracks CPU, memory, and network usage across all ACK clusters in your Alibaba Cloud account, providing a centralized multi-region view.
Prerequisites
Make sure that:
-
metrics-server is V0.3.8.5 or later
-
ACK managed cluster: Manage components
-
ACK dedicated cluster running Kubernetes 1.12 or earlier: Update the metrics-server component before you update the Kubernetes version to 1.12
-
-
If metrics-server cannot be updated to V0.3.8.5 or later, use the previous version of resource monitoring
How monitoring works
Cloud Monitor provides Kubernetes-native monitoring at three layers:
| Layer | What is monitored |
|---|---|
| Host infrastructure | Node-level CPU and memory utilization |
| Container (PaaS) | Pod CPU and memory usage; network resources |
| Kubernetes scheduling | Container working memory that affects pod scheduling decisions, distinguishing it from host memory usage |
At the cluster level, Cloud Monitor surfaces alerts, node counts, and resource usage across namespaces, nodes, workloads, and pods.
Enable Cloud Monitor for an ACK cluster
See Enable the Kubernetes container monitoring feature for an ACK cluster.
View monitoring data
-
Log on to the Cloud Monitor console.
-
In the left-side navigation pane, choose Cloud Service Monitoring > Container Service ACK.
-
On the Container Service Monitoring page, find the cluster and click its name or click View Details in the Actions column.
If prompted, click Authorize to grant access.
-
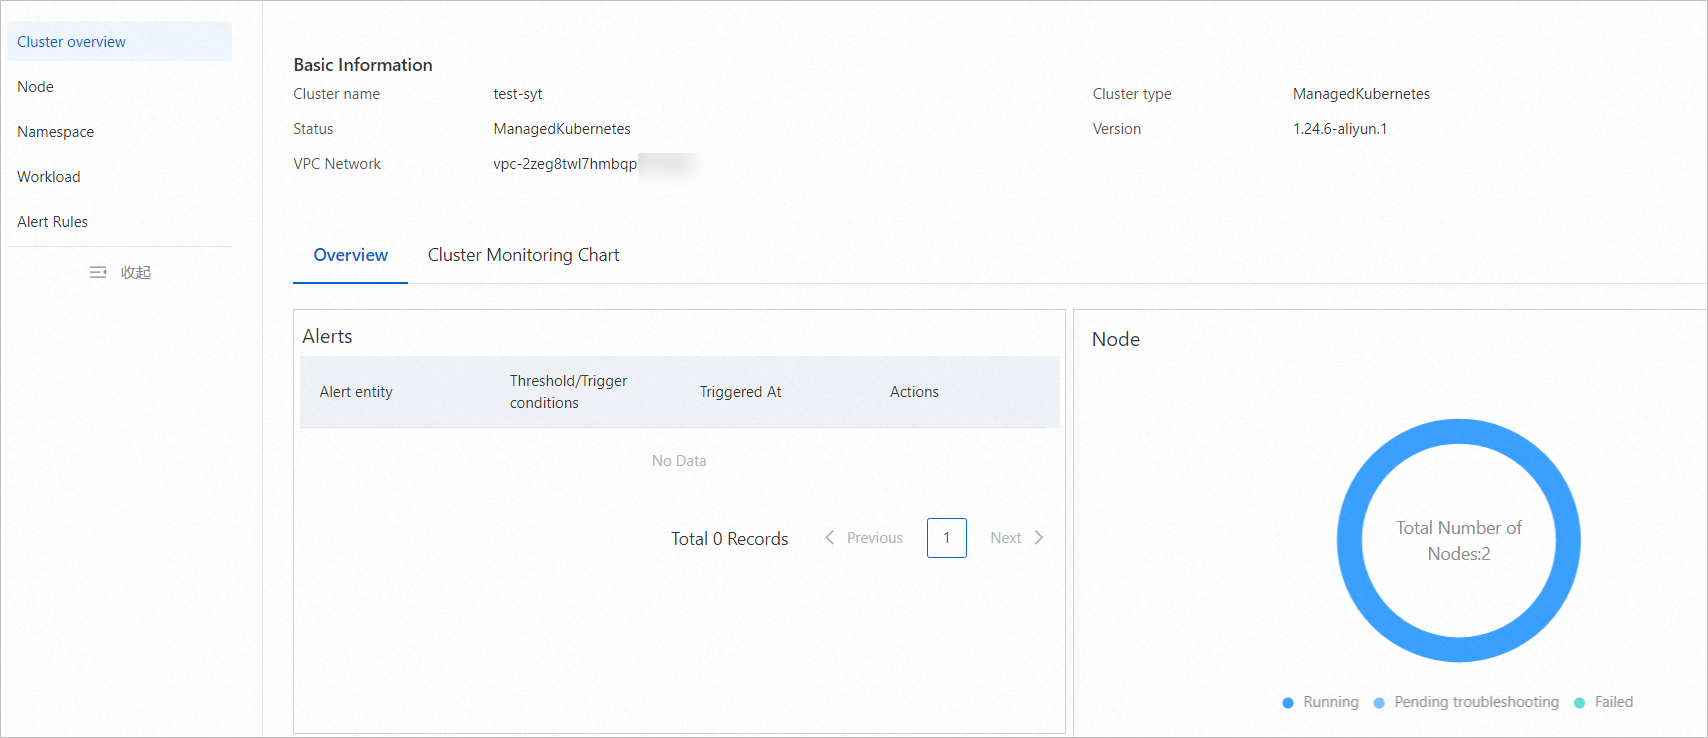
Review the Cluster overview, Node, Namespace, Workload, and Alert Rules sections. See View monitoring data.
The Cluster Overview page shows cluster basics (name, type, version, and VPC), current alert status, a ring chart of node status, and Top 5 line charts of pod CPU and memory usage.
Set up alert rules
Create an alert contact and contact group
-
Log on to the Cloud Monitor console.
-
In the left-side navigation pane, choose Alerts > Alert Contacts.
Create an alert rule
-
Log on to the Cloud Monitor console.
-
In the left-side navigation pane, choose Container Service Monitoring > Container Service ACK.
-
On the Container Service Monitoring page, find the cluster and click View Alert Rules in the Actions column.
-
Click Create Alert Rule.
-
In the Create Alert Rule panel, configure these parameters:
Parameter Description Resource Range The alert scope. Valid values: Cluster, Node, Container Group (pod). For Container Group (pod), select a namespace, workload type (Deployment, StatefulSet, DaemonSet, Job, or CronJob), and pods. Rule Description The trigger condition. Set the metric, threshold, and alert level. See ACK (new version) for pod metrics. Mute Period How long to suppress repeated notifications for the same alert. Valid values: 5 Minutes, 15 Minutes, 30 Minutes, 60 Minutes, 3 Hours, 6 Hours, 12 Hours, 24 Hours. Notifications resume when the alert level changes or the threshold is reached again after the period ends. During the mute period, resources show as Mute (single resource) or Notification Disabled (multiple resources). Effective Period The time window during which the alert rule is active. Monitoring runs only within this period. Alert Callback An Internet-accessible URL that receives HTTP POST requests when an alert fires. Only HTTP is supported. See Use the alert callback feature to send notifications about threshold-triggered alerts. Alert Contact Group The contact groups that receive notifications. See Create an alert contact or alert contact group. -
Click OK. The rule appears in the Alert Rules section. See Manage alert rules.
Verify
-
In the left-side navigation pane, choose Alerts > Alert History.
-
Check alert trends and records on the Alert History page.
Alert scenarios
Common alerting scenarios and their Resource Range configuration:
| Scenario | Description | Configuration |
|---|---|---|
| Cluster or node resource usage exceeds threshold | Alert when cluster or node resource usage exceeds the threshold | Set Resource Range to Cluster or Node. For Node, select all nodes. |
| Any pod in the cluster exceeds threshold | Alert when any pod causes resource pressure to identify the offending workload | Set Resource Range to Container Group (pod). Select All from both the Namespace and Container Group (pod) lists. |
| Any pod in a specific namespace exceeds threshold | Alert per namespace in multi-tenant clusters | Set Resource Range to Container Group (pod). Select the target namespace, then select All from the Container Group (pod) list. |
| Any pod of a specific workload exceeds threshold | Alert per workload, for example, when a Deployment's usage spikes | Set Resource Range to Container Group (pod). Select the namespace and the target workload (Deployment, StatefulSet, DaemonSet, Job, or CronJob), then select All from the Container Group (pod) list. |
Use the previous version of resource monitoring
If metrics-server cannot be updated to V0.3.8.5 or later, access resource monitoring in the ACK console:
-
Log on to the ACK console. In the left-side navigation pane, click Clusters.
-
On the Clusters page, find the cluster and click its name. In the left-side pane, choose Workloads > Deployments.
-
On the Deployments page, find the Deployment and click Monitor in the Actions column.
-
Review monitoring data on the Deployment Application, Container group list, and Container group hotspot tabs.
-
(Optional) In the left-side navigation pane, choose Alerts > Alert Rules to configure alert rules.
Group-based metric names start with
group; instance-based metric names start withpod.
FAQ
No monitoring data appears for my ACK cluster in Cloud Monitor
Next steps
-
Overview — Cloud Monitor Kubernetes monitoring capabilities
-
View monitoring data — details on each monitoring section
-
Prometheus — the recommended monitoring solution