CoreDNS is the default plug-in for DNS-based service discovery in Container Service for Kubernetes (ACK) clusters. This topic explains how to view the CoreDNS dashboard, interpret each metric, and troubleshoot common DNS issues using the dashboard.
Prerequisites
Before you begin, make sure that you have:
-
Installed the ack-arms-prometheus component. For more information, see Manage components.
View the CoreDNS dashboard
-
Log on to the ACK console. In the left navigation pane, click Clusters.
-
On the Clusters page, find the cluster you want and click its name. In the left-side pane, choose Operations > Prometheus Monitoring.
-
On the Prometheus Monitoring page, click the Network Monitoring tab, then click the CoreDNS tab to view the dashboard.
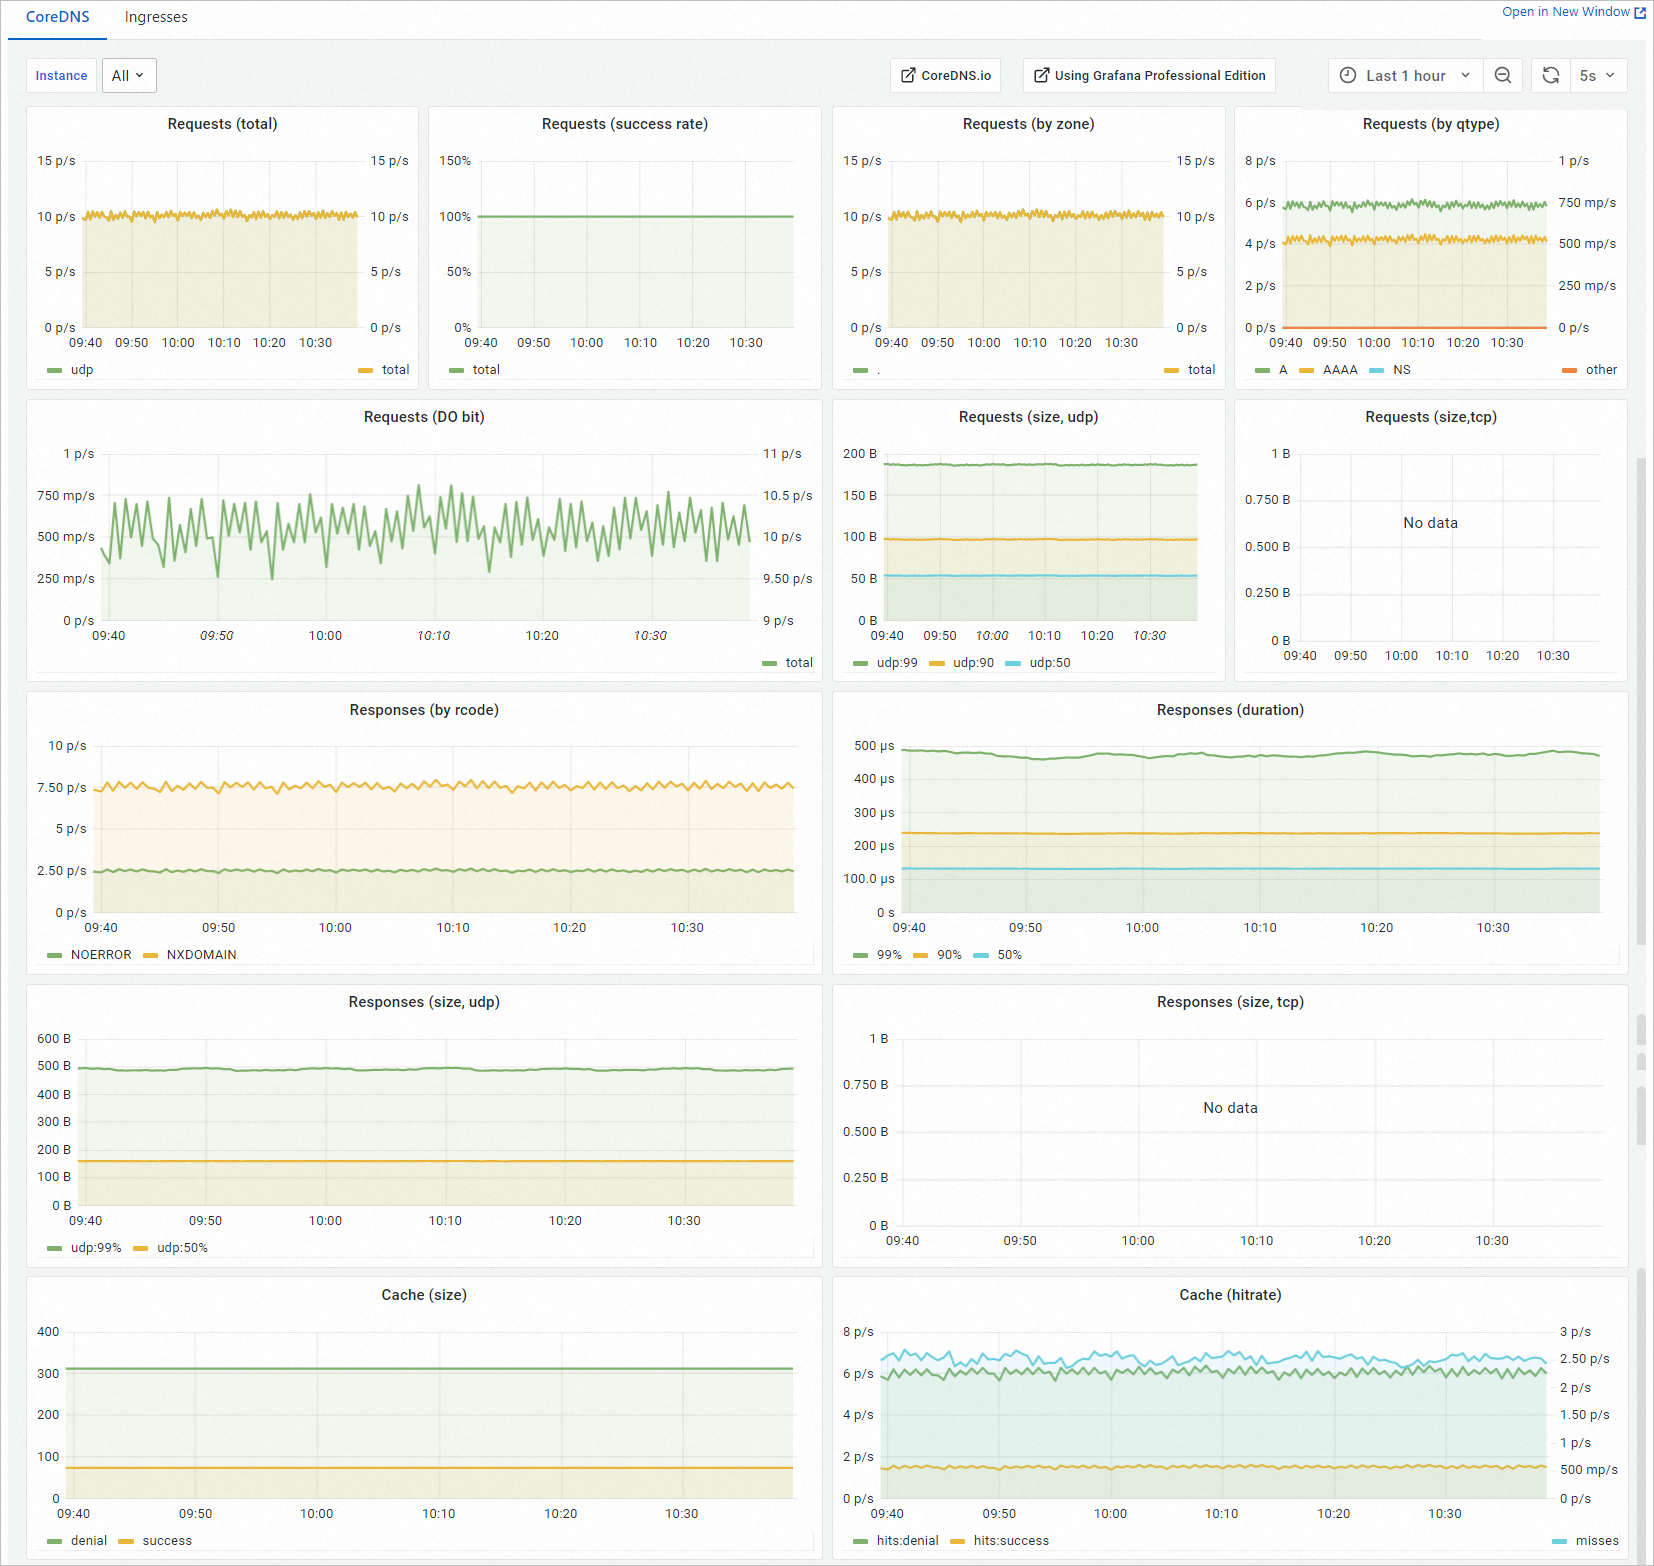
Dashboard metrics
The CoreDNS dashboard is built from Prometheus Query Language (PromQL) queries and displays request throughput, response behavior, and cache performance. The metrics are grouped into three categories.
Request metrics
| Metric | Unit | Description |
|---|---|---|
| Requests (total) | Requests/s | Total DNS requests received by CoreDNS per second. |
| Requests (success rate) | % | Percentage of requests that returned NOERROR or NXDOMAIN. Both response codes are considered successful. |
| Requests (by zone) | Requests/s | Request rate broken down by DNS zone. |
| Requests (by qtype) | Requests/s | Request rate broken down by DNS query type (for example, A, AAAA, MX). |
| Requests (DO bit) | Requests/s | Request rate for queries that include the DNSSEC OK (DO) bit. |
| Requests (size, udp) | Bytes | Size of each UDP request packet received by CoreDNS. |
| Requests (size, tcp) | Bytes | Size of each TCP request packet received by CoreDNS. |
Response metrics
| Metric | Unit | Description |
|---|---|---|
| Responses (by rcode) | Requests/s | Response rate broken down by DNS response code (for example, NOERROR, NXDOMAIN, SERVFAIL). |
| Responses (duration) | Seconds | Response latency at the 99th, 90th, and 50th percentile. |
| Responses (size, udp) | Bytes | UDP response packet size at the 99th and 50th percentile. |
| Responses (size, tcp) | Bytes | TCP response packet size at the 99th and 50th percentile. |
Cache metrics
| Metric | Unit | Description |
|---|---|---|
| Cache (size) | N/A | Total number of entries in the CoreDNS cache. |
| Cache (hitrate) | % | Cache hit rate. |
Common anomalies
The following table describes common CoreDNS anomalies by severity, along with their likely causes and recommended actions.
| Severity | Anomaly | Where to look | Likely causes | What to do |
|---|---|---|---|---|
| Critical | High SERVFAIL response rate | Responses (by rcode) | Upstream DNS server unreachable | Check the CoreDNS log to identify which domain names are triggering SERVFAIL responses, then troubleshoot upstream DNS connectivity. See Collect and analyze CoreDNS logs. |
| Critical | High response latency | Responses (duration) | Large number of applications resolving external domain names | Check the 99th percentile latency in the Responses (duration) chart to identify the source of latency. |
| Warning | Sharp increase in request rate | Requests (total) | Application traffic spike; misconfigured application making excessive DNS queries | Check the most frequently accessed domain names in the CoreDNS log to determine whether the increase is expected. If it is, scale CoreDNS by adding more pods — see Ensure the high availability of CoreDNS — and enable NodeLocal DNSCache to offload DNS traffic. For log analysis instructions, see Collect and analyze CoreDNS logs. |
Metrics for self-managed Prometheus
If ARMS is not enabled, monitor CoreDNS using a self-managed Prometheus instance. The following table lists the CoreDNS metrics available in CoreDNS 1.9.3. For the full list, see the CoreDNS metrics documentation.
| Metric | Data type | Labels | Description |
|---|---|---|---|
requests_total |
Counter | server, zone, proto, family, type | Total DNS query count. |
request_duration_seconds |
Histogram | server, zone | DNS query response time. |
request_size_bytes |
Histogram | server, zone, proto | DNS query packet size. Histogram bucket thresholds (bytes): 0, 100, 200, 300, 400, 511, 1023, 2047, 4095, 8291, 16000, 32000, 48000, 64000. |
do_requests_total |
Counter | server, zone | Total DNS query count for queries that include the DO bit. |
response_size_bytes |
Histogram | server, zone, proto | DNS response packet size. Histogram bucket thresholds (bytes): 0, 100, 200, 300, 400, 511, 1023, 2047, 4095, 8291, 16000, 32000, 48000, 64000. |
responses_total |
Counter | server, zone, rcode, plugin | Total DNS response count. |
panics_total |
Counter | — | Total number of CoreDNS panics. |
plugin_enabled |
Gauge | server, zone, name | Whether a plugin is enabled. |
https_responses_total |
Counter | server, status | Total DNS-over-HTTPS (DoH) query count. |