ACK streams all Nginx Ingress HTTP request logs to standard output and forwards them to Simple Log Service (SLS), where five pre-built dashboards give you immediate visibility into traffic, errors, and latency. By linking those dashboards to Application Real-Time Monitoring Service (ARMS), you can trace a slow URL from the Ingress layer down to the application code in a single click.
Prerequisites
Before you begin, ensure that you have:
-
The log collection component installed in your ACK cluster
Step 1: View Ingress logs and dashboards
-
Log on to the ACK console. In the left navigation pane, click Clusters.
-
On the Clusters page, click the name of your cluster. In the left navigation pane, click Cluster Information.
-
Click the Basic Information tab. In the Cluster Resources section, click the Project ID next to Log Service Project.
-
In the left navigation pane, click the
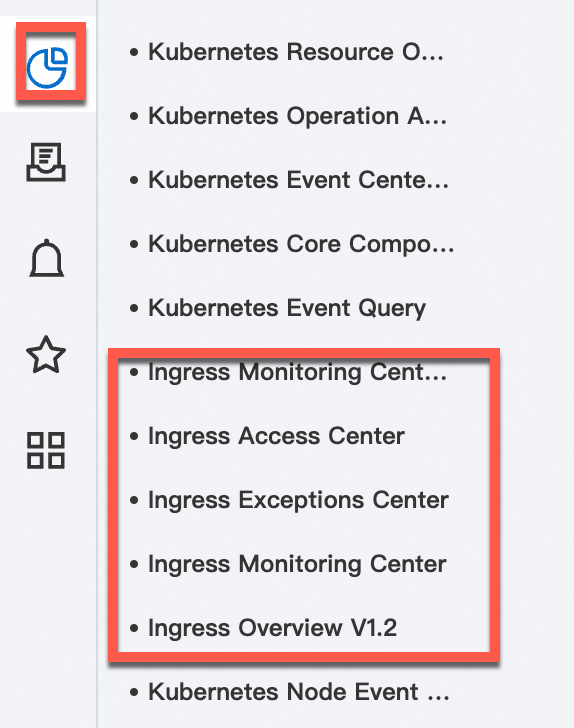
 icon. From the Dashboard list, open any of the five pre-built Nginx Ingress dashboards.

Pre-built dashboards
Simple Log Service provides five pre-built dashboards for Nginx Ingress. The table below summarizes each dashboard and when to use it.
| Dashboard | What it shows | Use when |
|---|---|---|
| Ingress Overview | Overall traffic health across four time windows: architecture status (1 day), real-time status (1 minute), user request patterns (1 day), and top URL statistics (1 hour) | Starting point for daily health checks |
| Ingress Exceptions Center | Error patterns, anomalies, and exception trends | Investigating elevated error rates or unexpected traffic patterns |
| Ingress Access Center | Request distribution, geographic access patterns, and client breakdowns | Understanding who is accessing your services and from where |
| Ingress Monitoring Center for blue-green deployment | Side-by-side metrics for two service versions in real time | Validating a new version release and deciding whether to roll back |
| Ingress Monitoring Center | Ongoing service-level monitoring | General production monitoring outside of release events |
For details on Ingress Exceptions Center, Ingress Access Center, and Ingress Monitoring Center, see Collect and analyze Nginx Ingress access logs.
Ingress Overview panels
The Ingress Overview dashboard is organized into four panels, each covering a different time window and monitoring purpose:
| Panel | Time window | Metrics |
|---|---|---|
| Overall architecture status | 1 day | Page views (PVs), unique visitors (UVs), traffic, response latency, mobile client ratio, error rate |
| Real-time website status | 1 minute | PVs, UVs, request success rate, average latency, P95 latency, P99 latency |
| User request information | 1 day | 1-day PV comparison, 7-day PV comparison, geographic distribution, top provinces by access, top cities by access, mobile client ratio, Android/iOS ratio |
| Top URL statistics | 1 hour | Top 10 by access, top 10 by latency, top 10 by 5XX errors, top 10 by 404 errors |
Ingress Monitoring Center for blue-green deployment
During a version release, open this dashboard to compare two service versions in real time. It provides before-and-after comparisons as well as side-by-side comparisons between the current blue and green versions. Select the blue and green versions — for example, ServiceA and ServiceB — and the dashboard dynamically renders metrics for both, including PVs, 5XX rate, success rate, average latency, P95 latency, P99 latency, P999 latency, and traffic. If the new version shows higher error rates or latency, roll back before the impact widens.
Step 2: Enable ARMS for your Java application
ARMS instruments your Java application to collect distributed trace data. Once enabled, URLs in the Top 10 request URLs by latency section of the Ingress Overview V1.2 dashboard link directly to the corresponding trace in ARMS — so you can follow a slow request from the load balancer through your application code without switching contexts.
To instrument a Java application, see Monitor Java applications.
Step 3: Configure an Ingress for your application
-
Log on to the ACK console. In the left navigation pane, click Clusters.
-
On the Clusters page, click the name of your cluster. In the left navigation pane, click Network > Ingresses.
-
On the Ingresses page, click Create Ingress. Configure the Ingress settings, and then click OK.
For configuration details, see Create and use an Nginx Ingress to expose services.
Step 4: Trace a slow request from Ingress to ARMS
After ARMS is enabled and your Ingress is configured, use the Ingress Overview V1.2 dashboard to identify high-latency URLs and jump directly to their traces.
Log on to the Simple Log Service console.
-
Log on to the Simple Log Service console.
-
In the project list, click your log project. The default project name is k8s-log-{cluster-id}.
-
In the left navigation pane, click the
 icon. From the Dashboard list, open the Ingress Overview V1.2 dashboard.
 -
In the Top 10 request URLs by latency section, find the URL (ARMS troubleshooting) column and click any URL. The ARMS console opens the trace query page for that request, where you can view detailed trace data and identify the root cause of the latency.
What's next
-
Collect and analyze Nginx Ingress access logs — detailed guide for all five dashboards
-
Monitor Java applications — enable ARMS for your Java services
-
Create and use an Nginx Ingress to expose services — full Ingress configuration reference