System Observer Monitoring (SysOM) is an OS kernel-level container monitoring method. Container Service for Kubernetes (ACK) allows you to monitor containers at the OS kernel level based on SysOM. This capability can help you better deploy and migrate containerized applications and monitor containers.
Prerequisites
Before you begin, ensure that you have:
-
An ACK managed cluster, or an ACK Serverless cluster created after October 2021, with Kubernetes version 1.18.8 or later. For more information, see Create an ACK managed cluster and Create an ACK Serverless cluster. To update an existing cluster, see Manually update ACK clusters
-
Managed Service for Prometheus enabled. For more information, see Enable Managed Service for Prometheus
What ack-sysom-monitor collects
ack-sysom-monitor is a SysOM component that uses extended Berkeley Packet Filter (eBPF) technology to collect node and container metrics and enhance metrics at the kernel level. Beyond standard system metrics, it provides enhanced metrics that support pod kernel-level monitoring and node kernel-level monitoring, helping you identify common issues such as system jitters, delays, resource leaks, and pod memory exceptions.
Billing
After ack-sysom-monitor is enabled, related components automatically send monitoring metrics to Managed Service for Prometheus. These metrics are billed as custom metrics.
Before enabling this feature, read the Billing overview to understand how custom metrics are charged. Fees vary based on cluster size and the number of applications running. To monitor and control resource usage, see View resource usage.
Enable ack-sysom-monitor
-
Log on to the ARMS console.
-
In the left-side navigation pane, click Integration Center.
-
In the Infrastructure section of the Integration Center page, find and click SysOM System Observation.
-
In the Start Integration step of the SysOM System Observation panel, select the ACK cluster to integrate and click OK.
View monitoring data
-
Log on to the ACK console. In the left-side navigation pane, click Clusters.
-
On the Clusters page, find your cluster and click its name. In the left-side pane, choose Operations > Prometheus Monitoring.
-
On the Prometheus Monitoring page, click the SysOM tab.
ack-sysom-monitorsupports two monitoring views:-
Node kernel-level monitoring — On the SysOM - Nodes tab, view CPU, memory, scheduling, storage, and network metrics for each node.
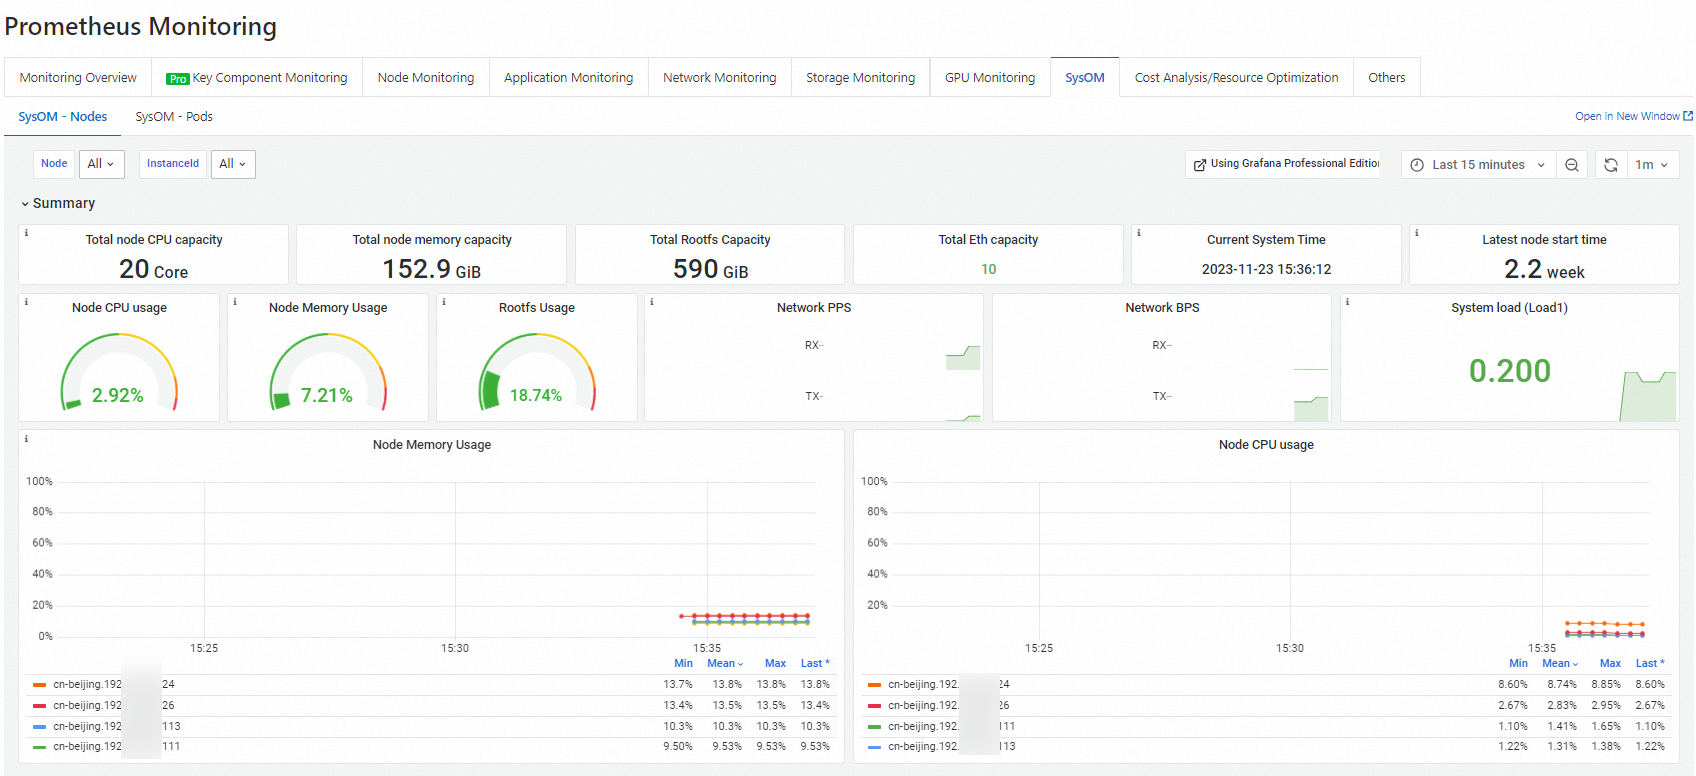
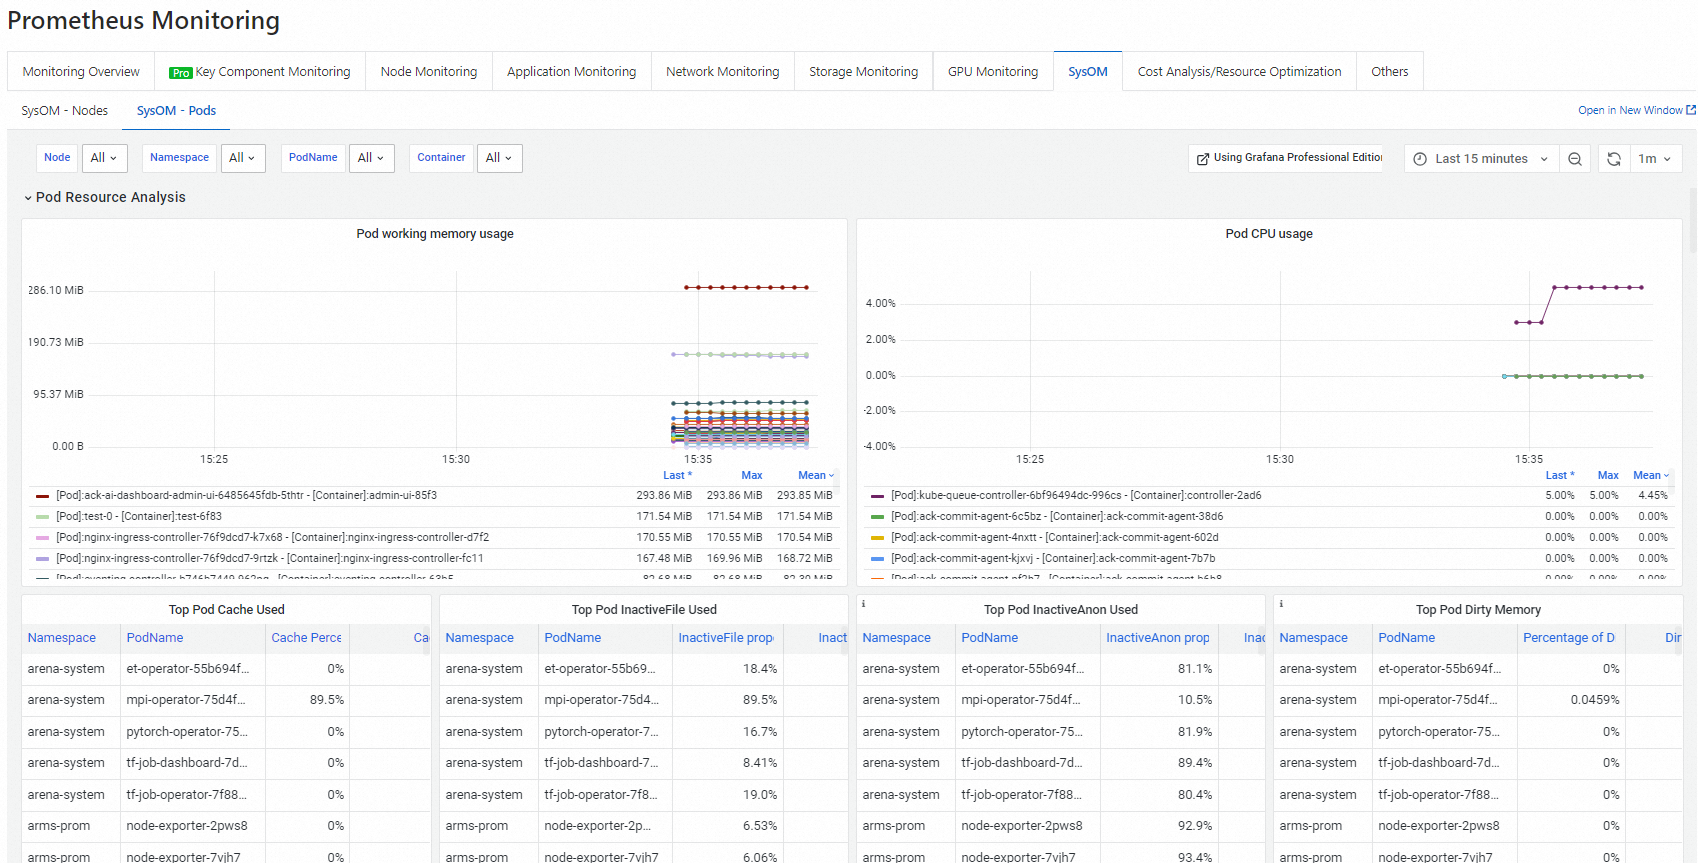
-
Pod kernel-level monitoring — On the SysOM - Pods tab, view memory, CPU, network, and I/O metrics for each pod in real time.
-
What's next
To stop incurring charges, uninstall the ack-sysom-monitor component. For more information, see Manage components.
Metrics
All metrics provided by ack-sysom-monitor follow the Prometheus data model.
All metric types listed below are gauge.
Diagnostic scenarios
Use the table below to go from symptom to metric.
| Symptom | Relevant metrics |
|---|---|
| CPU throttling or scheduling delays | sysom_proc_schedstat, sysom_cpu_dist, sysom_container_cpu_stat, sysom_container_cpu_cfsquota |
| High load or too many D-state processes | sysom_proc_stat_counters, sysom_proc_loadavg |
| Memory pressure or OOM events | sysom_proc_vmstat, sysom_container_memory_gdrcm_latency, sysom_container_memory_cdrcm_latency, sysom_container_memory_cpt_latency |
| Page cache causing memory jitter | sysom_container_memory_filecache |
| cgroup leaks | sysom_cgroups |
| Disk I/O latency or throughput issues | sysom_proc_disks, sysom_container_blkio_stat |
| Network packet loss or retransmission | sysom_proc_pkt_status, sysom_net_retrans_count |
| High TCP RTT or connection anomalies | sysom_net_health_hist, sysom_net_health_count, sysom_net_tcp_count |
| Socket or buffer exhaustion | sysom_sock_stat |
Node metrics
Node metrics include CPU and scheduling, memory, storage, network, and other system metrics.
CPU and scheduling
|
Metric |
Type |
Unit |
Description |
|
sysom_proc_cpu_total |
gauge |
% |
CPU uptime breakdown for the whole node, by state: user mode, kernel mode, softirq, hardirq, idle, and iowait. Use this metric to identify which state is consuming CPU time. |
|
sysom_proc_cpus |
gauge |
% |
CPU uptime breakdown per individual CPU core, by state: user mode, kernel mode, softirq, hardirq, idle, and iowait. Use this metric to detect per-core imbalances. |
|
sysom_proc_sirq |
gauge |
% |
Number of occurrences for each softirq type: HI, TIMER, NET_TX, NET_RX, BLOCK, IRQ_POLL, TASKLET, SCHED, HRTIMER, and RCU. A spike in NET_RX or NET_TX can indicate network saturation. |
|
sysom_proc_stat_counters |
gauge |
- |
Number of processes in Running or D state, system startup time, and context switch count. A high D-state count indicates I/O or lock contention. |
|
sysom_proc_loadavg |
gauge |
- |
Load averages at 1-minute, 5-minute, and 15-minute intervals, plus run-queue length and total process count. Use this metric to assess sustained load trends. |
|
sysom_proc_schedstat |
gauge |
ns (nanoseconds) |
CPU scheduling latency: time processes spend waiting in the run queue, and the length of CPU time slices. Elevated wait time indicates scheduling pressure. |
|
sysom_cpu_dist |
gauge |
- |
Distribution of CPU scheduling intervals—how long a process waits from releasing the CPU to being scheduled again. Counts are bucketed at 1 µs, 10 µs, 100 µs, 1 ms, 10 ms, 100 ms, and 1 s. Long tail latencies indicate scheduling jitter. |
Memory
|
Metric |
Type |
Unit |
Description |
|
sysom_proc_meminfo |
gauge |
KiB |
Node-level memory usage across categories: Total, Free, Available, Cache, Buffers, SReclaimable, and SUnreclaim. Use this metric to understand overall memory pressure. |
|
sysom_proc_vmstat |
gauge |
- |
Detailed memory page statistics and events: free pages, dirty pages, pages read/written, pages reclaimed from the inactive list, and out-of-memory (OOM) killer invocations. OOM killer activity signals critical memory exhaustion. |
|
sysom_proc_buddyinfo |
gauge |
- |
Kernel buddy system allocator state: available blocks across different sizes in each memory zone and node. Use this metric to detect memory fragmentation that can cause allocation failures. |
Storage
|
Metric |
Type |
Unit |
Description |
|
sysom_proc_disks |
gauge |
- |
Per-disk and per-partition I/O statistics: read/write request count and bytes, merge counts, inflight requests, and total time to complete requests. Use this metric to diagnose disk throughput and latency issues. |
|
sysom_fs_stat |
gauge |
- |
File system usage for each mounted file system: block size, used and available blocks, and used and available inodes. Use this metric to catch disk or inode exhaustion before it causes failures. |
Network
|
Metric |
Type |
Unit |
Description |
|
sysom_proc_networks |
gauge |
- |
Per-NIC data transfer statistics: packets and bytes received and sent, driver-level discards, and send/receive errors. Use this metric to detect NIC-level packet loss. |
|
sysom_proc_pkt_status |
gauge |
- |
Network protocol stack events: packet drops, buffer overflows, and assertion failures. Use this metric to identify where packets are being lost in the stack. |
|
sysom_sock_stat |
gauge |
- |
Socket and buffer usage: total, raw, TCP, and UDP socket counts, TCP sockets in TIME_WAIT or orphan state, and TCP/UDP socket memory usage. High TIME_WAIT or orphan counts can indicate connection handling issues caused by application logic or system parameters. |
|
sysom_softnets |
gauge |
- |
Per-CPU NIC softirq statistics: packets received and sent per softirq, and the number of times |
|
sysom_net_health_hist |
gauge |
- |
Round-trip time (RTT) distribution across all TCP connections on the node, bucketed at 10 ms, 100 ms, and 1 s. Use this metric to detect TCP latency degradation. |
|
sysom_net_health_count |
gauge |
- |
Average RTT of TCP connections on the node. Similar to |
|
sysom_net_retrans_count |
gauge |
- |
TCP retransmission statistics: count of retransmitted packets by type (SYN, SYN-ACK, RESET), including retransmissions due to timeout. Rising counts indicate network instability or congestion. |
|
sysom_net_tcp_count |
gauge |
- |
TCP connection statistics: active connection count, segments received and sent, segments retransmitted, and receive failures. |
|
sysom_net_udp_count |
gauge |
- |
UDP statistics: packets received and sent, send/receive buffer errors, and packets dropped due to no available ports. |
|
sysom_net_ip_count |
gauge |
- |
IP layer statistics: packets forwarded, received, and sent. |
|
sysom_net_icmp_count |
gauge |
- |
ICMP statistics: packets received and sent, and send/receive failures. |
Other system metrics
|
Metric |
Type |
Unit |
Description |
|
sysom_cgroups |
gauge |
- |
Number of cgroups in use across subsystems: CPU, Cpuacct, Memory, Pids, Blkio, and Devices. A steadily increasing count that does not decrease can indicate cgroup leaks. |
|
sysom_uptime |
gauge |
s (seconds) |
System uptime since the last boot, and system idle time. |
Container metrics
Container metrics include CPU and scheduling, memory, I/O, and network metrics.
CPU and scheduling
|
Metric |
Type |
Unit |
Description |
|
sysom_container_cpu_stat |
gauge |
- |
CPU throttling statistics per cgroup: number of times CPU limits were enforced, total enforcement count, and total duration of enforcement. Use this metric to determine whether resource quotas need adjustment. |
|
sysom_container_cpu_acctstat |
gauge |
% |
CPU utilization for container tasks, broken down by mode: user, kernel, and total. Use this metric to understand how containers consume CPU across kernel and user space. |
|
sysom_container_cpu_cfsquota |
gauge |
- |
Completely Fair Scheduler (CFS) configuration for the container cgroup: |
Memory
|
Metric |
Type |
Unit |
Description |
|
sysom_container_memory_stat |
gauge |
KiB |
Container memory usage by category: Total, Free, Available, Cache, Buffers, SReclaimable, and SUnreclaim. Use this metric to assess overall memory consumption per container. |
|
sysom_container_memory_filecache |
gauge |
KiB |
Page cache usage per container: the top 10 files consuming the most page cache, file sizes, and total page cache occupied. Use this metric to identify containers where page cache overuse is causing memory pressure, latency, or jitter. |
|
sysom_container_memory_gdrcm_latency |
gauge |
Times |
Delays caused by memory reclamation due to insufficient memory resources. Counts delays in six ranges: 1–5 ms, 5–10 ms, 10–100 ms, 100–500 ms, 500–1,000 ms, and over 1,000 ms. Use this metric to detect node-level memory pressure affecting container performance. |
|
sysom_container_memory_cdrcm_latency |
gauge |
Times |
Delays caused by memory reclamation due to insufficient memory cgroups. Counts delays in the same six ranges as Note
This metric is valid only if the current memory cgroups are non-root cgroups or memory limits are configured for the current memory cgroups. |
|
sysom_container_memory_cpt_latency |
gauge |
Times |
Delays caused by kernel memory adjustment, triggered when a process in the container requests memory but the node has insufficient memory or an excessive number of memory fragments exists. Counts delays in the same six ranges. Use this metric to detect memory fragmentation impacting container allocation. |
IO
|
Metric |
Type |
Unit |
Description |
|
sysom_container_blkio_stat |
gauge |
- |
Block I/O statistics for the container's disk: read/write request count and bytes, queued request count and bytes, and request wait time. Use this metric to diagnose I/O bottlenecks at the container level. |
Network
|
Metric |
Type |
Unit |
Description |
|
sysom_container_network_stat |
gauge |
- |
Virtual NIC data transfer statistics per container: packets and bytes received and sent, and device-level discards. Packets dropped by the network protocol stack are not included. |