With the rapid development of microservices models, server observability has become increasingly mature. Distributed tracing systems such as Jaeger, Zipkin, and SkyWalking allow developers to clearly observe how a request enters the gateway and propagates through multiple microservices. However, when we attempt to extend this trace to the mobile client, a significant gap emerges.
● Correlation challenges: The mobile client and the server operate as silos, each with its own logging system. The client records the request initiation time and outcome, whereas the server retains the complete trace. Yet there is no reliable linkage between the two. When failures occur, engineers must manually correlate data using timestamps. This approach is inefficient, error-prone, and nearly infeasible under high concurrency.
● Unclear failure boundaries: A common scenario illustrates this issue: A user reports an API timeout, but server metrics show all requests returning a normal 200 status code. The root cause could lie in the user's local network, the carrier's transmission quality, or a transient backend fluctuation. Because mobile and server observability systems are separated, fault boundaries cannot be identified, often leading to blame-shifting between teams.
● Inability to reproduce issues: Mobile network environments are more complex than server environments. DNS resolution may be hijacked, SSL handshakes may fail due to compatibility issues, and retries or timeouts under poor network conditions are common. In traditional solutions, this critical contextual data is lost once the request completes. When issues occur intermittently, developers are unable to reconstruct execution paths or identify root causes, leaving them to react passively to repeated user complaints.
These limitations make end-to-end tracing increasingly essential. A robust solution must treat the mobile client as the true origin of the distributed trace, ensuring that every user-initiated request is fully captured, accurately correlated, and continuously traced down to the lowest-level database calls. In this article, we present a best-practice implementation that demonstrates how to connect mobile and backend traces using Alibaba Cloud Real User Monitoring (RUM). This approach enables true end-to-end tracing and improves the efficiency of network request troubleshooting.
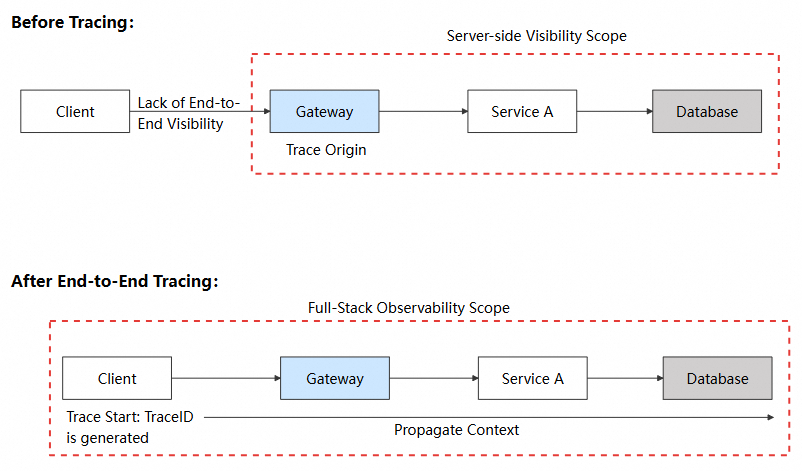
End-to-end tracing means making the client the first hop of a distributed trace, so that the client and the server share the same trace ID.
In traditional architectures, tracing starts at the server gateway. When a request reaches the gateway, the Application Performance Monitoring (APM) agent assigns a trace ID and propagates it across subsequent microservice calls. With end-to-end tracing, the trace origin is moved to the user's device. The mobile SDK generates a trace ID and injects it into the request headers, allowing the entire request path from user interaction to the underlying database to be correlated by a single identifier.

The implementation consists of four tightly connected stages.
When a user initiates a network request, the client SDK intervenes before the request is sent:
1. Request interception: The SDK captures outgoing requests using the interception mechanism of the network library, such as an OkHttp Interceptor.
2. Span creation: A span is created for the request, generating two identifiers:
3. Start time recording: The request start timestamp is recorded for subsequent latency analysis.
The generated trace identifiers must be encoded in a format that the server can interpret. This requires a shared propagation protocol, such as W3C Trace Context or Apache SkyWalking (sw8).
The client SDK injects the encoded trace data into the HTTP request headers, which are sent along with the request.
The HTTP protocol inherently supports header propagation, which is the technical basis for trace context propagation.
| Capability | Description |
|---|---|
| Protocol guarantee | HTTP requires intermediaries (proxies, gateways, and CDNs) to preserve and forward request headers. |
| Language-agnostic | HTTP headers can be read and written regardless of client (Java, Swift, JavaScript) or server language (Go, Python, Node.js). |
| TLS compatibility | HTTPS encrypts the transport layer. Headers remain intact after decryption. |
Once the request reaches the server, the APM agent continues the trace:
traceparent or sw8 header.Through these four stages, every client-initiated request can be seamlessly linked with the server-side trace, forming a complete trace from the user's device to the database.
To ensure interoperability across systems, standardized trace propagation protocols are required. Two protocols are commonly used in practice.
W3C Trace Context is an official W3C standard and provides the broadest compatibility.
Header formats
| Header | Format | Example |
|---|---|---|
traceparent |
{version}-{trace-id}-{span-id}-{flags} |
00-4bf92f3577b34da6a3ce929d0e0e4736-00f067aa0ba902b7-01 |
tracestate |
{vendor}={value} |
alibabacloud\_rum=Android/1.0.0/MyApp\_APK |
Fields
| Field | Length | Description | Example |
|---|---|---|---|
| version | 2 characters | The version of the protocol. The value is 00. | 00 |
| trace-id | 32 characters | The unique identifier of the entire trace (hexadecimal). | 4bf92f3577b34da6a3ce929d0e0e4736 |
| span-id | 16 characters | The identifier of the current span (hexadecimal). | 00f067aa0ba902b7 |
| flags | 2 characters | The sampling flag. A value of 01 indicates that the trace is sampled. | 01 |
APM support
| Backend APM | Support | Configuration method |
|---|---|---|
| Alibaba Cloud ARMS | ✅ Natively supported | No configuration required. |
| Jaeger | ✅ Natively supported | No configuration required. |
| Zipkin | ✅ Supported | Enable W3C mode. |
| OpenTelemetry | ✅ Natively supported | No configuration required. |
| Spring Cloud Sleuth | ✅ Supported | Configure propagation-type: W3C. |
The sw8 protocol is the native propagation protocol of Apache SkyWalking and carries richer contextual data.
Header formats
| Header | Format |
|---|---|
sw8 |
{sample}-{traceId}-{segmentId}-{spanIndex}-{service}-{instance}-{endpoint}-{target} |
Fields
| Field | Encoding | Description | Example |
|---|---|---|---|
| sample | Original | The sampling flag. A value of 1 indicates that the trace is sampled. | 1 |
| traceId | Base64 | The ID of the trace. | YWJjMTIz |
| segmentId | Base64 | The ID of the segment. | ZGVmNDU2 |
| spanIndex | Original | The index of the parent span. | 0 |
| service | Base64 | The name of the service (app package). | Y29tLmV4YW1wbGUuYXBw |
| instance | Base64 | The name of the instance (app version). | MS4wLjA= |
| endpoint | Base64 | The endpoint (request URL). | L2FwaS92MS9vcmRlcnM= |
| target | Base64 | The destination address (host:port). | YXBpLmV4YW1wbGUuY29tOjQ0Mw== |
APM support
| Backend APM | Support | Configuration method |
|---|---|---|
| Apache SkyWalking | ✅ Natively supported | No configuration required. |
| Alibaba Cloud ARMS (SkyWalking mode) | ✅ Supported | Enable the SkyWalking protocol. |
With the theory in place, this section walks through a real troubleshooting case to demonstrate how end-to-end tracing supports root cause analysis.
We constructed a slow request scenario based on an open source code library. The architecture is shown below.

In daily use, we found a specific page loaded extremely slowly, resulting in a poor user experience. An initial assessment suggested that an API response was slow, but further analysis was required to identify where the latency occurred and why. We then leveraged the end-to-end tracing capabilities of Alibaba Cloud RUM to identify the root cause step by step.
Log on to the Alibaba Cloud Management Console and go to Cloud Monitor 2.0 Console > Real User Monitoring > Your application > API Requests. This view provides performance statistics for all API requests.
After sorting by Slow Response Percentage, we identified the problematic endpoint.

The data shows that /java/products has an abnormally high response time, averaging over 40 seconds. This is far beyond normal expectations and sufficient to explain the slow page load.
With the suspicious API identified, the next step is to examine its trace to determine where the time is being spent.
Click View Trace for the API operation to go to the trace details page.

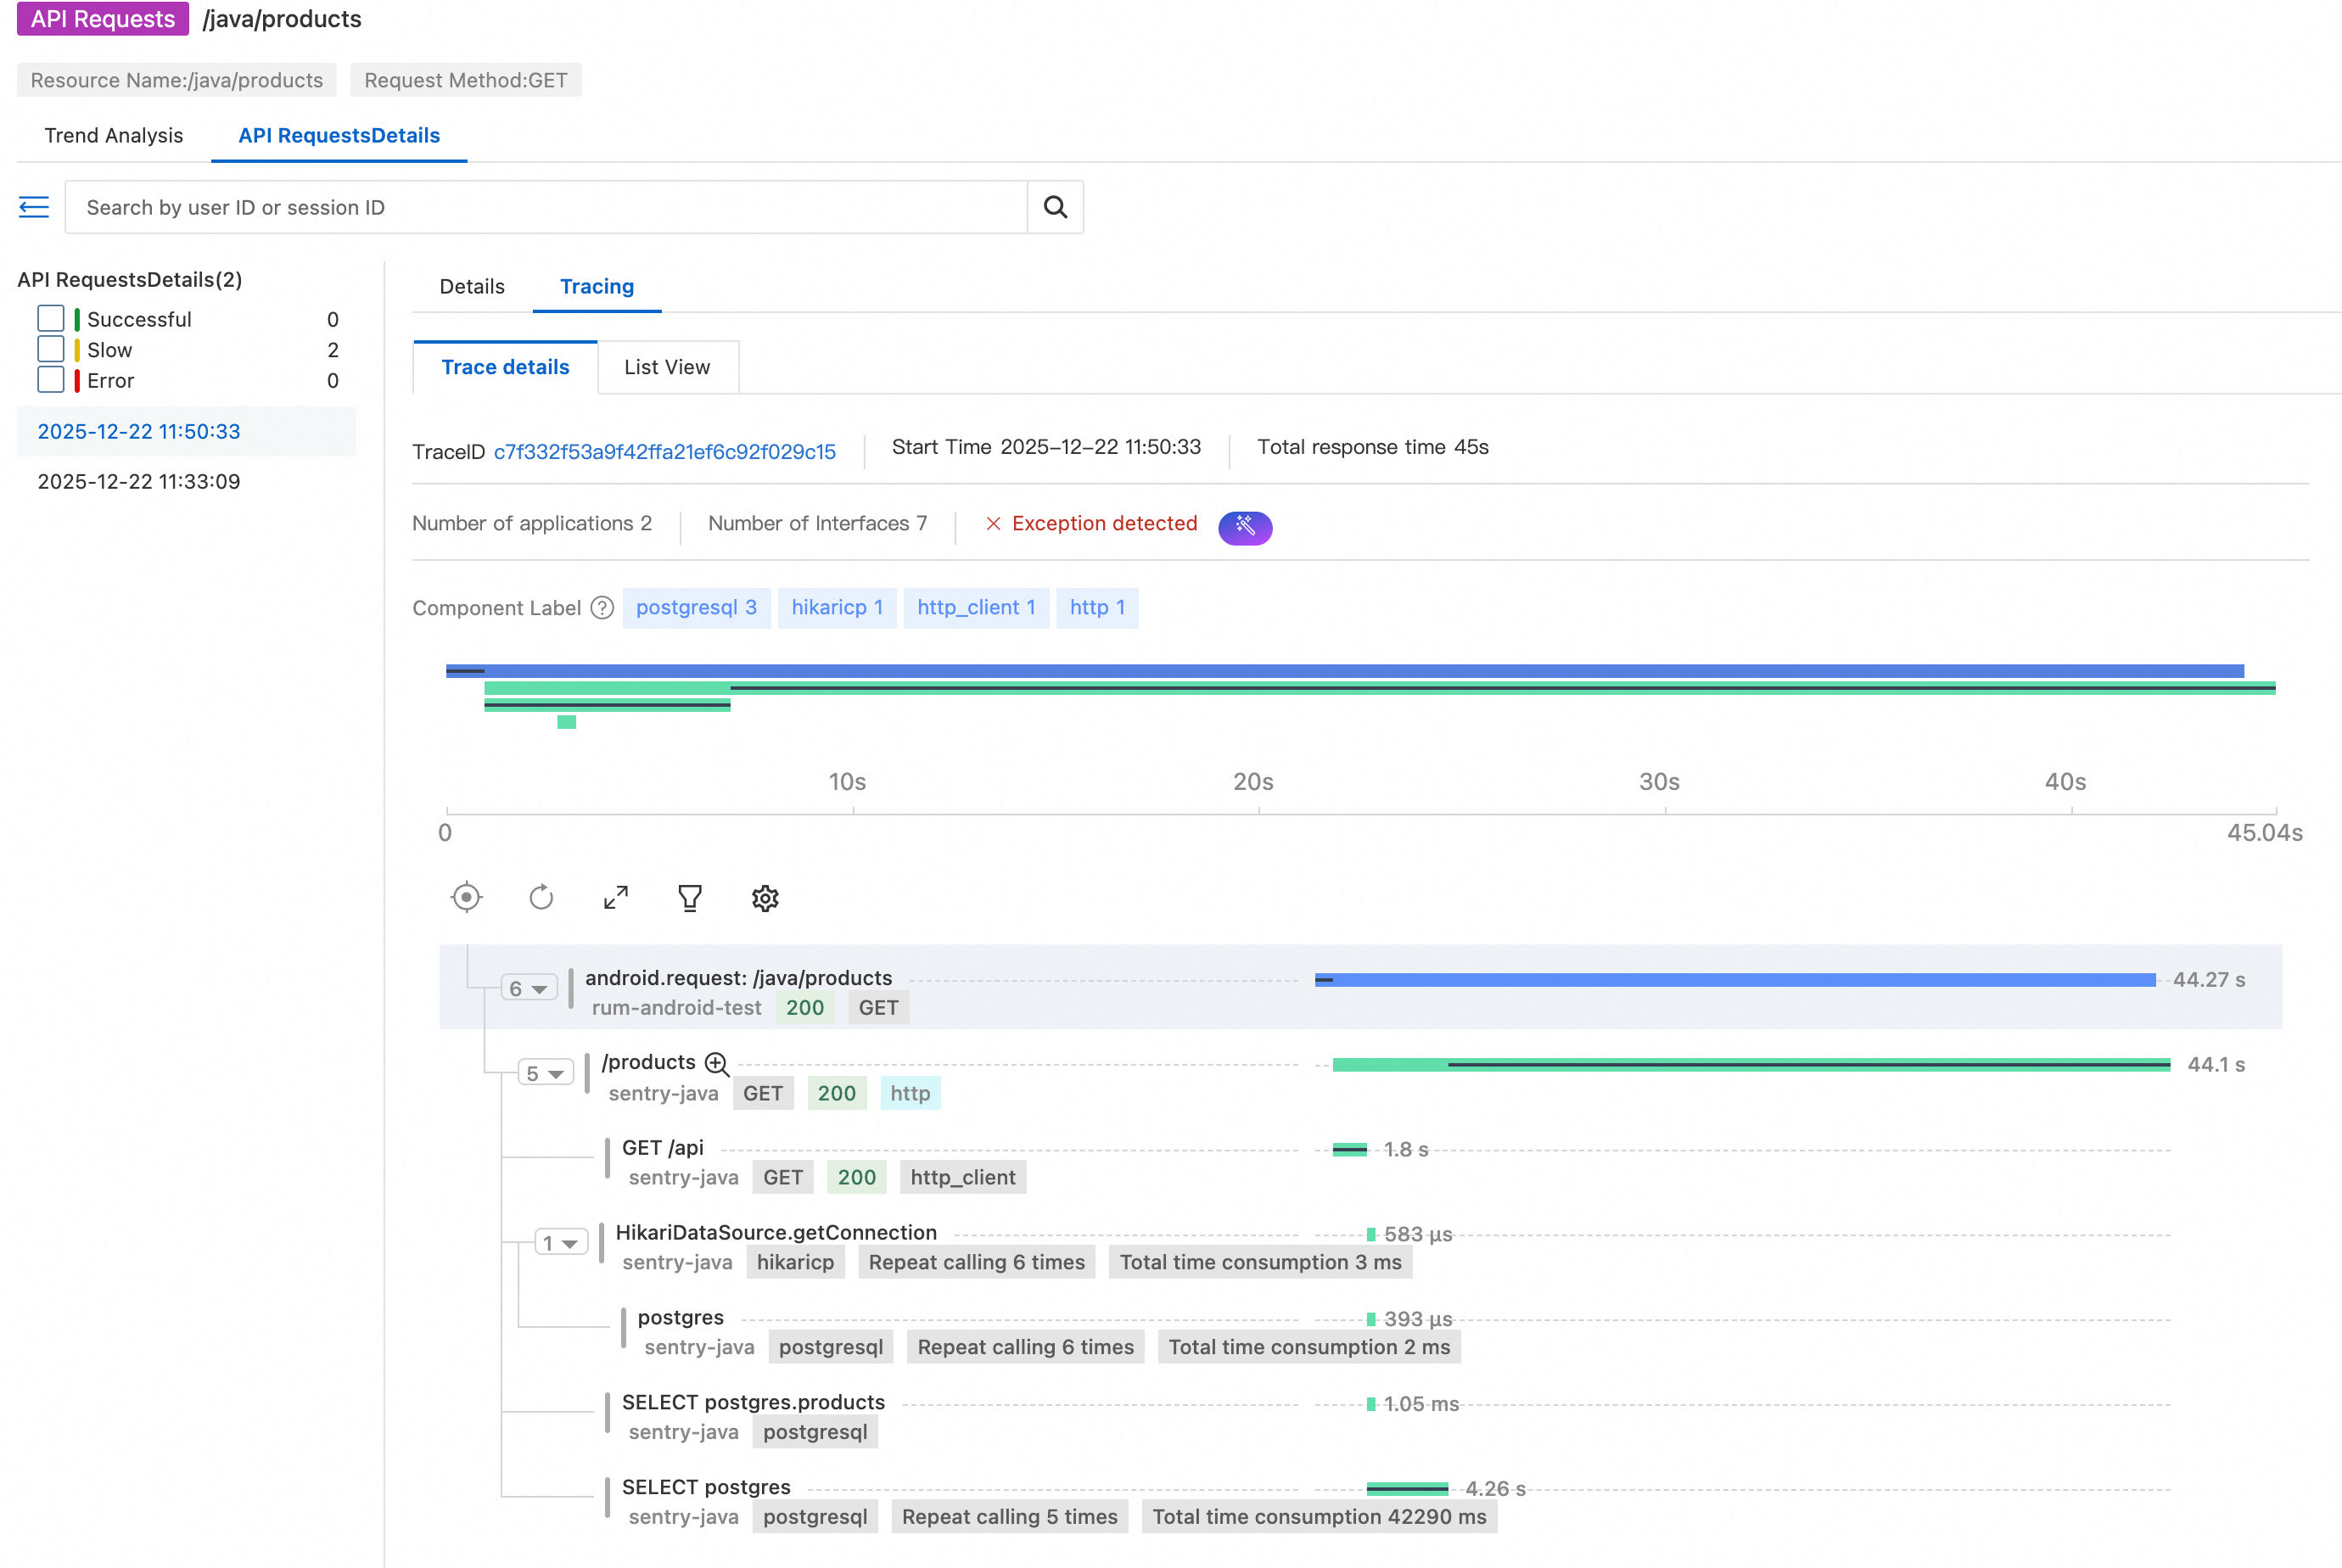
This is the core value of end-to-end tracing: The complete trace from the mobile client to the backend service can be viewed in a single place.
From the waterfall view, we can see that:
● After the mobile client initiates the request, the trace continues seamlessly into the backend service.
● The majority of the latency occurs in the /products endpoint.
● The endpoint takes more than 40 seconds to return a response.
For deeper analysis in server-side application monitoring, we record the trace ID: c7f332f53a9f42ffa21ef6c92f029c15.
Go to Application Monitoring > Backend application > Trace Explorer. Query the trace using the recorded trace ID.

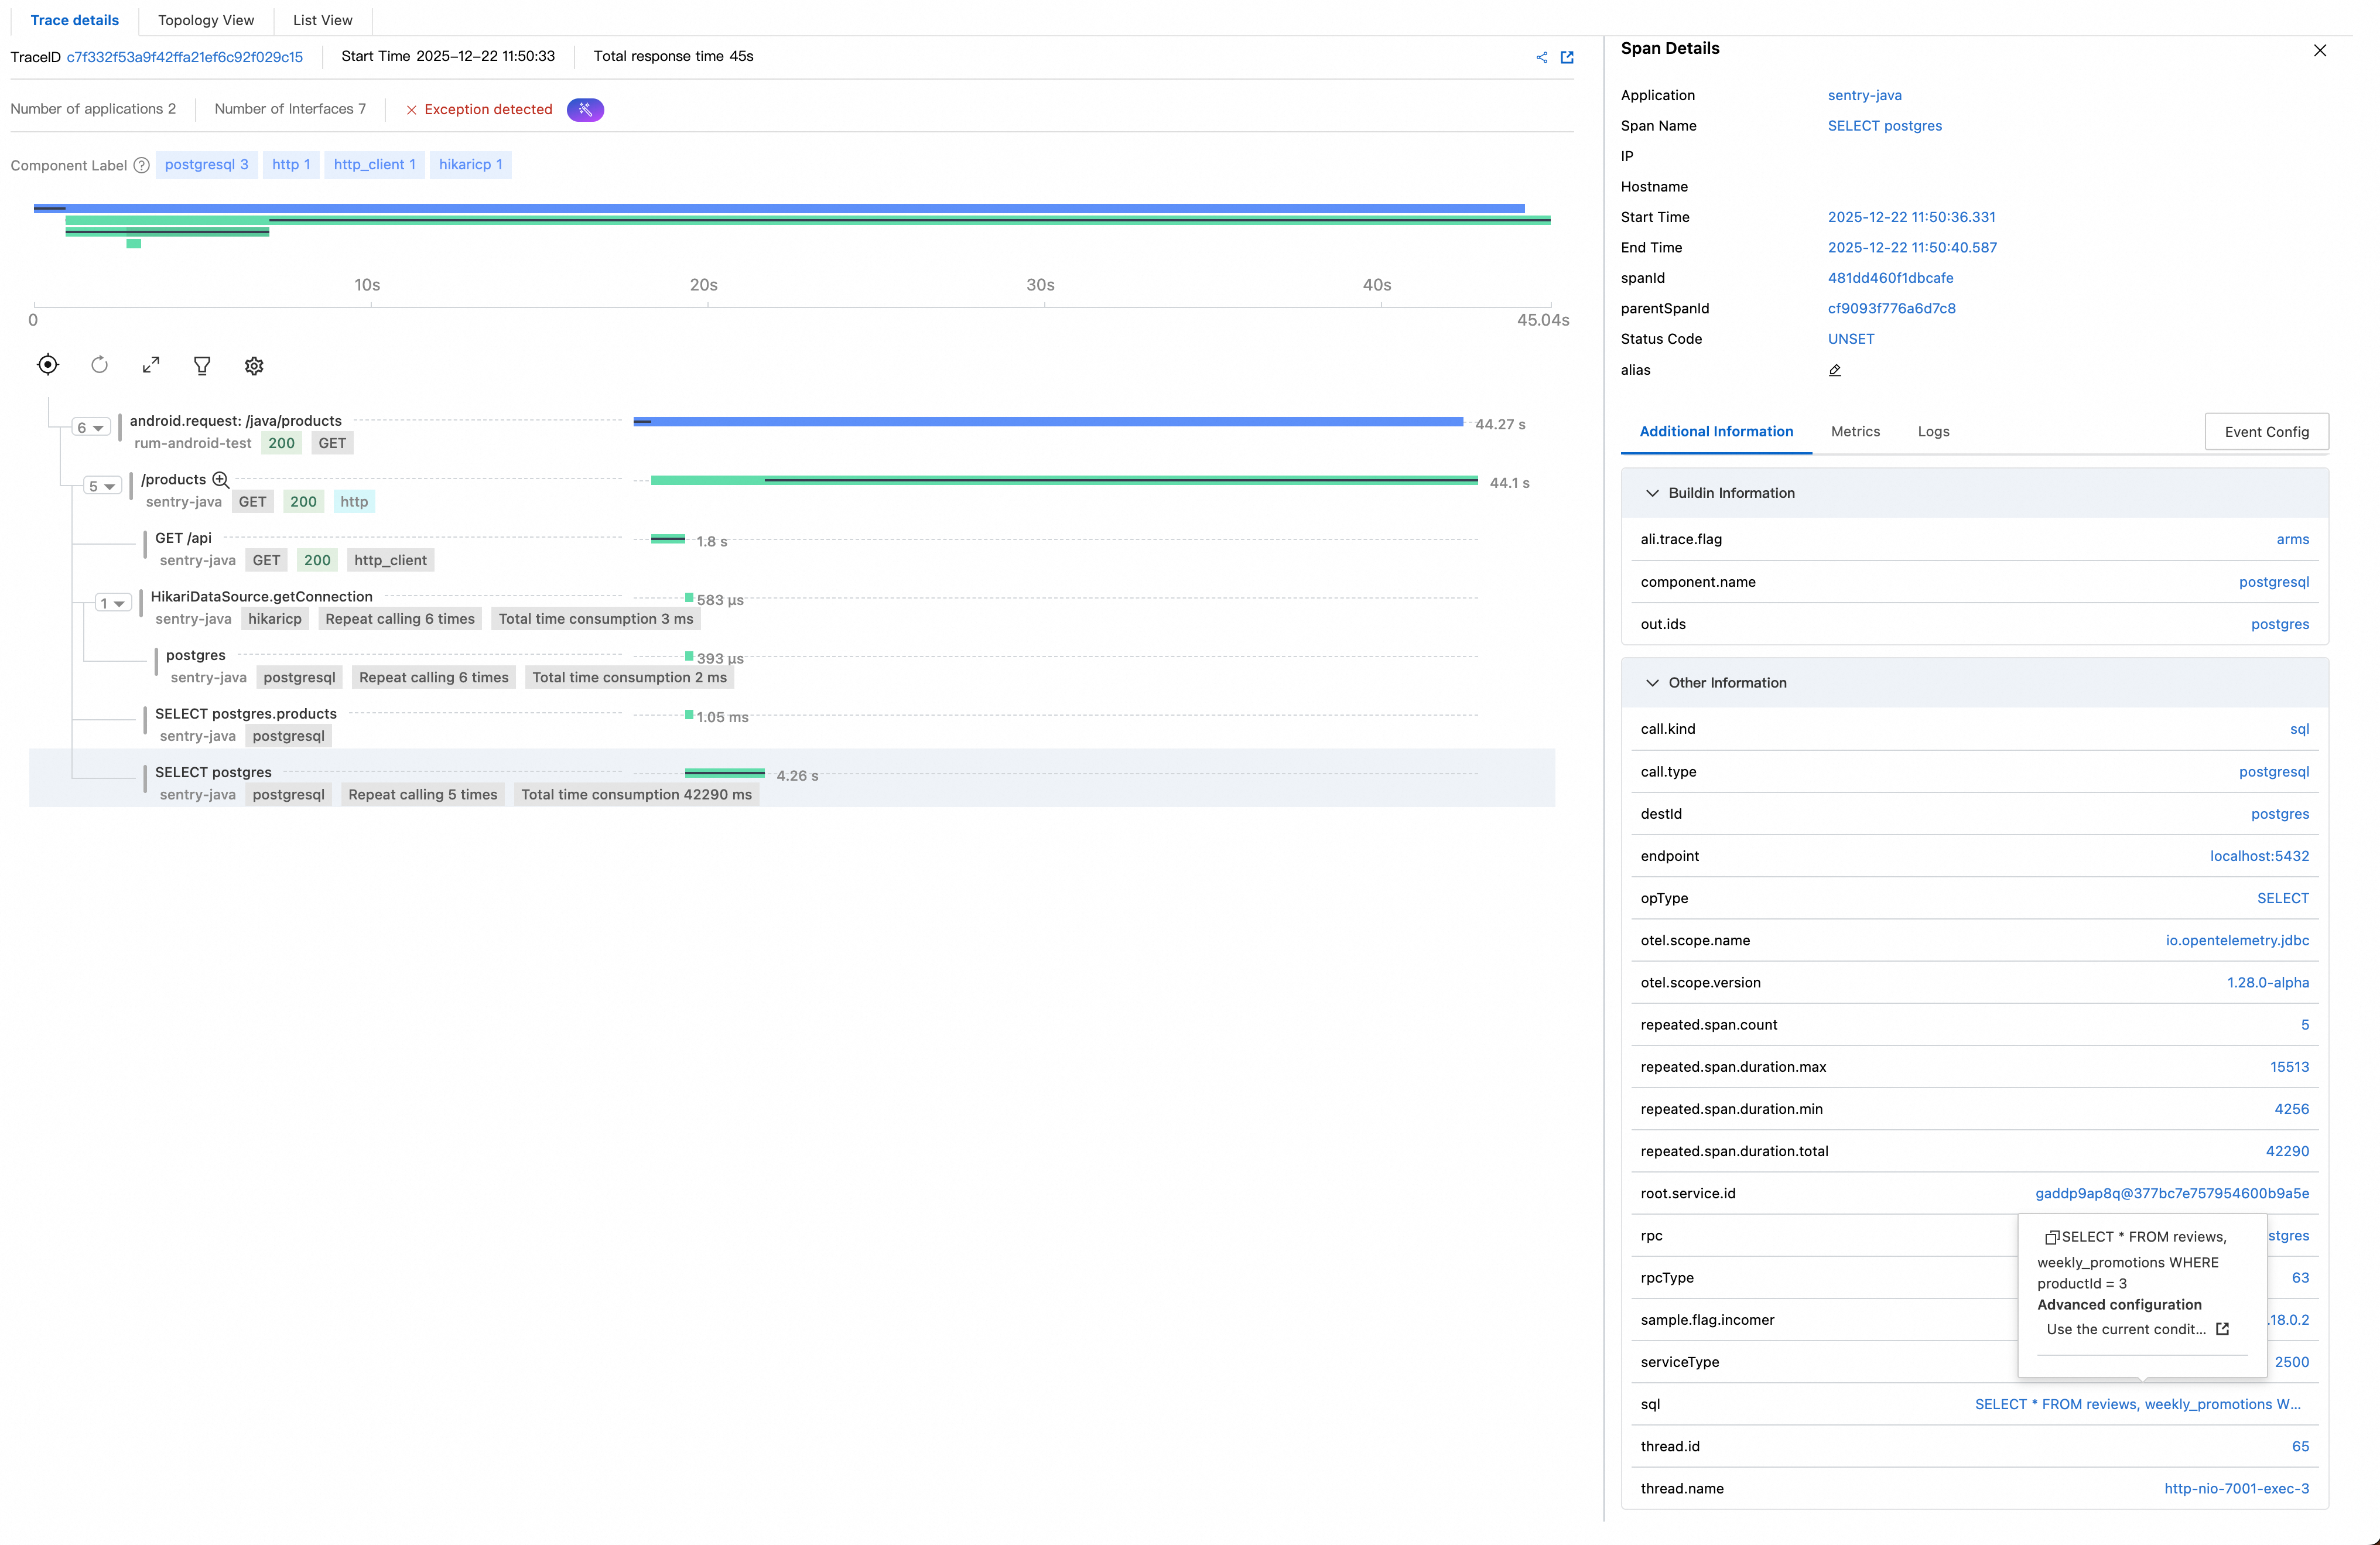
The backend trace reconstructs the execution flow of the /products API operation:
● HikariDataSource.getConnection: executed 6 times, total 3 ms. Database connections are retrieved from the connection pool six times, taking 3 ms in total, indicating that this is not a bottleneck.
● postgres: executed 6 times, total 2 ms. These are lightweight PostgreSQL operations and do not form a bottleneck.
● SELECT postgres.products: Executed 1 + 5 times, total 42,290 ms (about 42.3 s). This is the key finding: The same SQL query related to products is executed five times, averaging about 8 seconds per execution.
● This confirms that the latency is dominated by SQL execution rather than connection handling or network overhead.
Click the final span, and view the executed SQL statements in the details panel on the right:
-- Initial query: Get all product data
SELECT * FROM products
-- N additional queries per product (N+1 pattern)
SELECT * FROM reviews, weekly_promotions WHERE productId = ?
The root cause begins to surface:
SELECT * FROM products is executed to retrieve all product records. This query completes quickly.SELECT * FROM reviews, weekly_promotions WHERE productId = ? query is executed for each product.This is a classic N+1 query problem. Compounding the issue, weekly_promotions is a sleepy view, where heavy operations are performed for each query. Since a large number of products exist, the cumulative time consumed reaches 42 seconds.
The thread name http-nio-7001-exec-3 is recorded for further verification using profiling data.
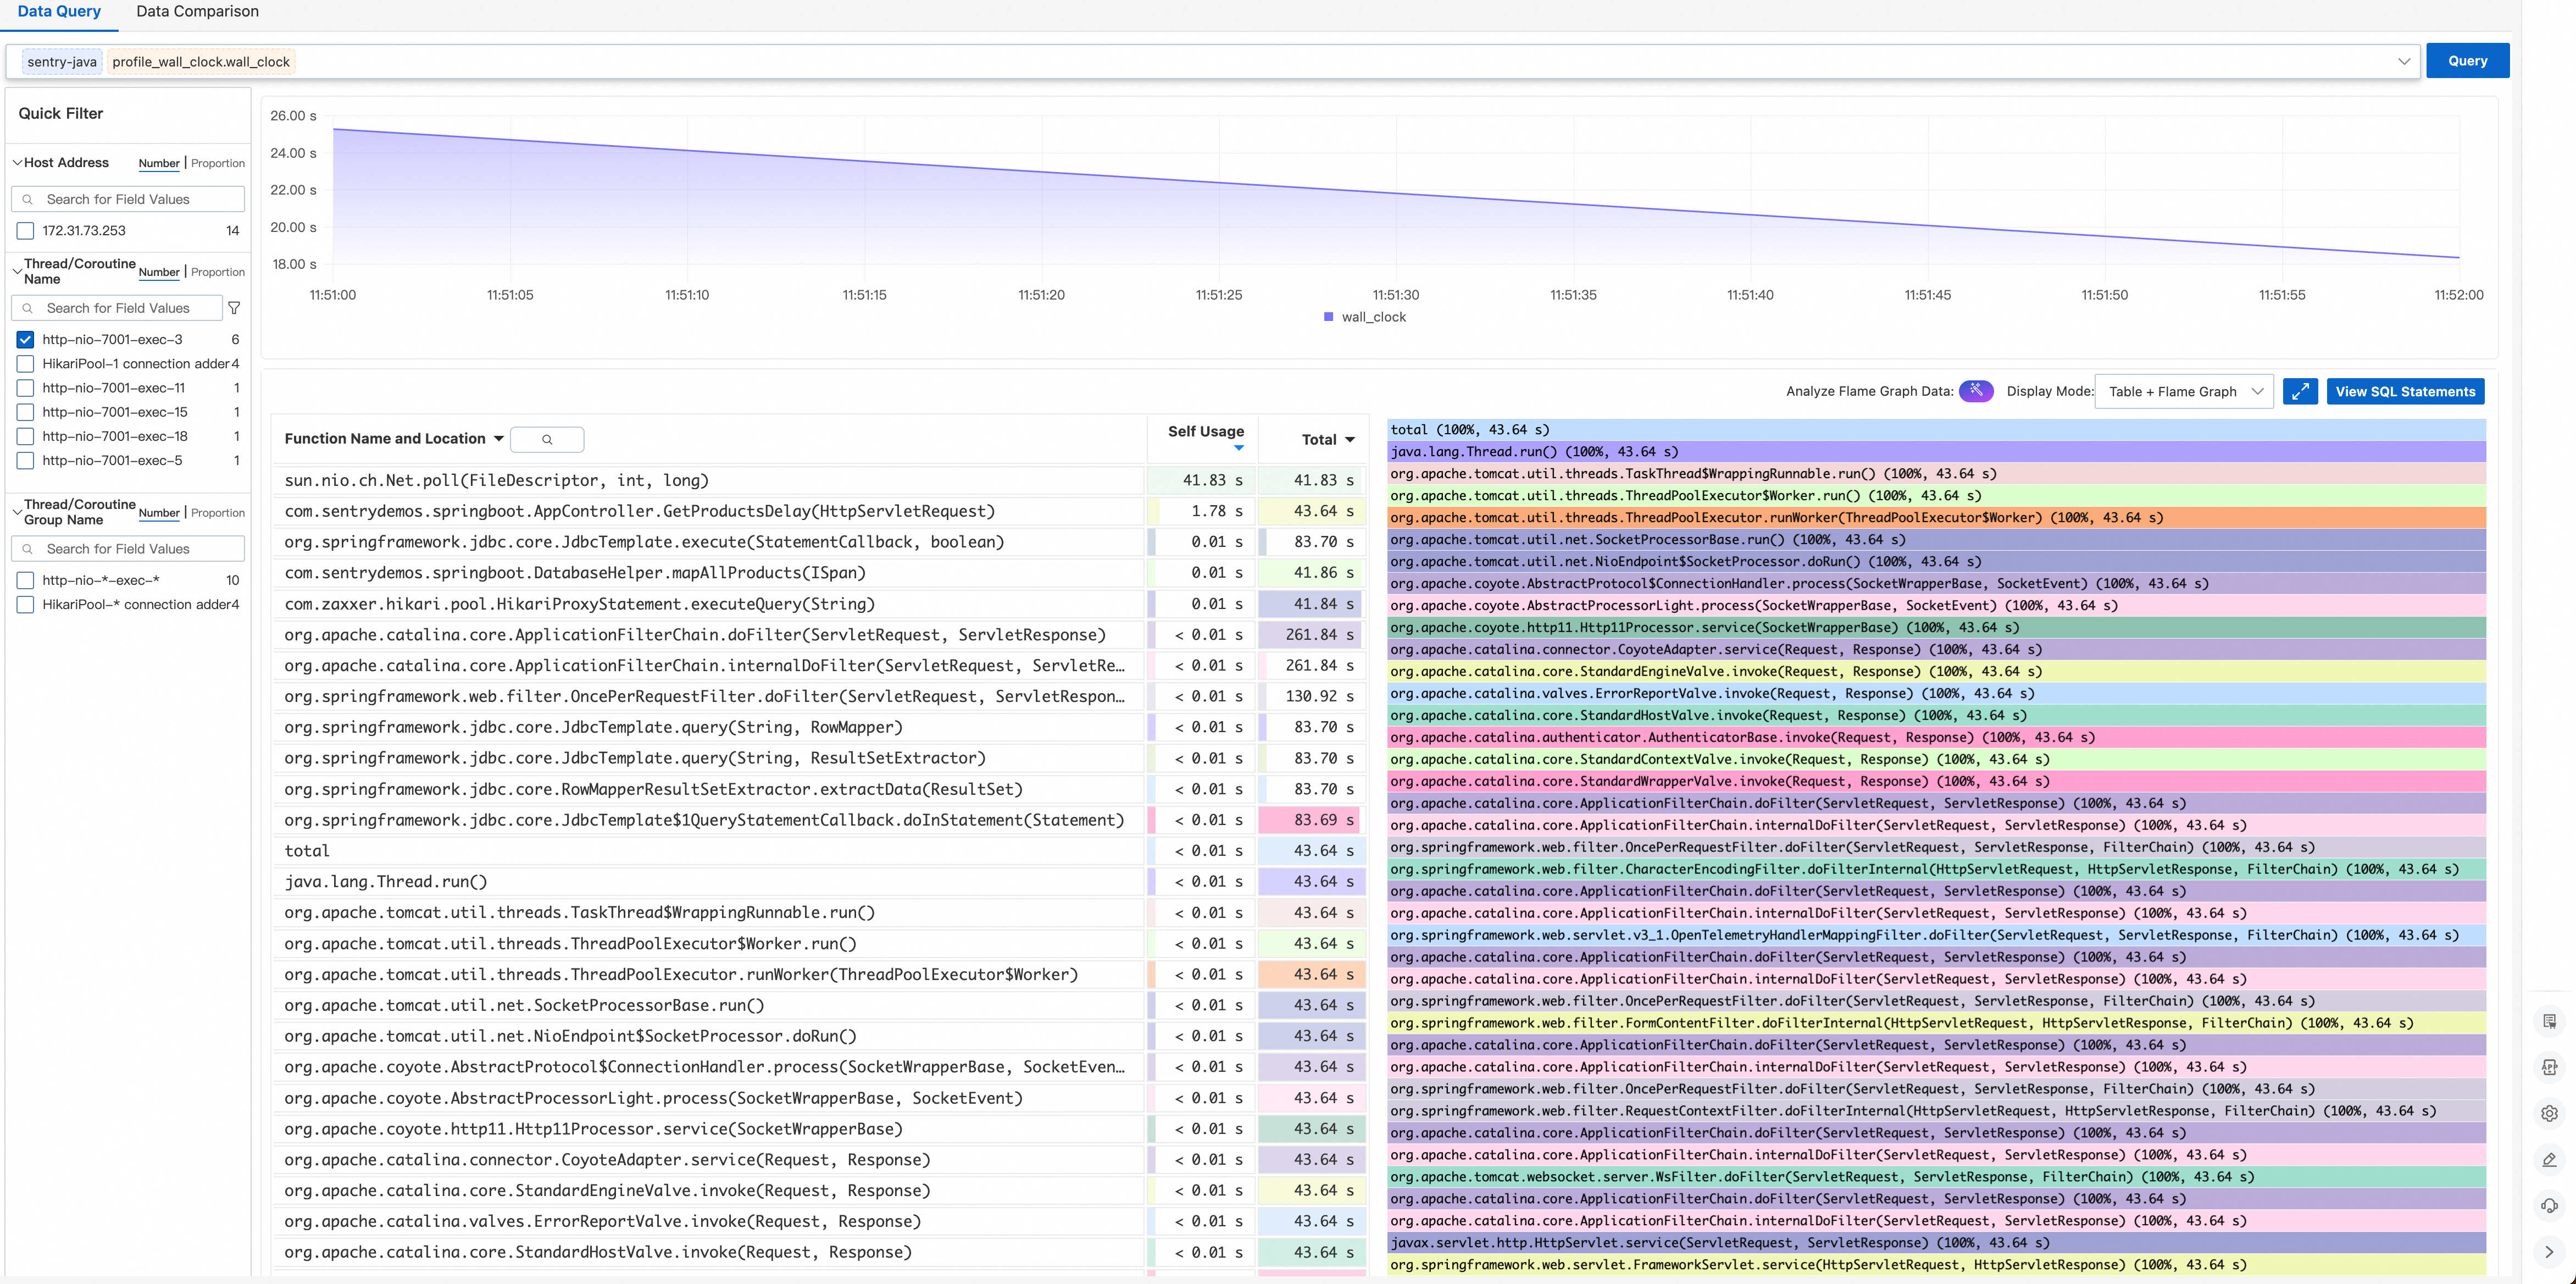
Go to Application Diagnostics > Continuous Profiling to view the profiling data of the backend service.

Filter the data by the recorded thread, and the execution time distribution shows:
● sun.nio.ch.Net.poll(FileDescriptor, int, long) accounts for nearly 100% of total time.
● The thread is spending most of its time waiting for data from the PostgreSQL socket.
The profiling results fully align with the trace analysis: The thread is blocked on slow SQL queries.
Based on the above investigation, the root cause is clear:
Root cause: N+1 queries combined with a sleepy view
1. The application code exhibits an N+1 query pattern:
SELECT * FROM products (1 execution)SELECT * FROM reviews, weekly_promotions WHERE productId = ? (N executions)2. weekly_promotions is a sleepy view with inherently time-consuming query logic.
3. The combination causes the API response time to exceed 40 seconds.
End-to-end tracing eliminates the observability black hole between the client and the server. By injecting standardized trace headers on the mobile client, we establish a unified tracing workflow in which mobile requests and server-side traces share the same trace ID, enabling quick correlation. Issues can be accurately located, with latency clearly visible at every hop from the user's device to the database. This clearly defines fault boundaries and eliminates blame-shifting between client and server teams. As a result, performance improvements are driven by real trace data rather than assumptions. The Alibaba Cloud RUM SDK offers a non-intrusive solution to collect performance, stability, and user behavior data on Android. Developers can get started quickly by following the Android application integration guide. Beyond Android, RUM also supports Web, mini programs, iOS, and HarmonyOS, enabling unified monitoring and analysis across multiple platforms. For support, join the RUM Support Group (DingTalk Group ID: 67370002064).
Building a Unified Entity Search Engine by Using UModel for Observability Scenarios

706 posts | 57 followers
FollowAlibaba Cloud Native Community - February 8, 2025
Alibaba Container Service - November 15, 2024
Alibaba Cloud Native Community - November 24, 2025
Alibaba Cloud Native Community - August 25, 2025
Alibaba Container Service - August 1, 2024
Alibaba Cloud Native Community - January 19, 2026

706 posts | 57 followers
Follow Application Real-Time Monitoring Service
Build business monitoring capabilities with real time response based on frontend monitoring, application monitoring, and custom business monitoring capabilities
Learn More Real-Time Livestreaming Solutions
Stream sports and events on the Internet smoothly to worldwide audiences concurrently
Learn More Real-Time Streaming
Provides low latency and high concurrency, helping improve the user experience for your live-streaming
Learn More Global Application Acceleration Solution
This solution helps you improve and secure network and application access performance.
Learn MoreMore Posts by Alibaba Cloud Native Community