Continuous profiling discovers bottlenecks caused by CPU, memory, or I/O in your Java application at the method level, broken down by class name, method name, and line number. Use it to pinpoint resource-intensive methods, reduce latency, increase throughput, and lower infrastructure costs.
Overhead is minimal. In a benchmark with all features enabled on a mainstream Spring Web application, CPU utilization increased by about 5%, off-heap memory by about 50 MB, and GC and request latency barely changed. For detailed results, see Performance test report of the continuous profiling technology of ARMS agent for Java v4.x.
Prerequisites
Before you begin, make sure that you have:
Application Monitoring Pro Edition with the pay-by-observable-data billing mode. To activate Pro Edition, see Pay-as-you-go. To switch billing modes, see Billing
An application monitored by Application Monitoring with ARMS agent 2.7.3.5 or later. For setup instructions, see Application Monitoring overview. To upgrade the agent, see Update the ARMS agent
An Object Storage Service (OSS) bucket specified in the access control policy of the Virtual Private Cloud (VPC) where your application runs. This bucket stores profiling data. The bucket name follows the pattern
arms-profiling-<regionId>. Replace<regionId>with your region ID. For example, if your application runs in the China (Hangzhou) region, usearms-profiling-cn-hangzhou. If the bucket is not specified, data collection failsOpenJDK or Oracle JDK. Other JDK distributions are not supported
Continuous profiling data is retained for 7 days.
Limits
Linux kernel version
The Linux kernel must be version 2.6.32-431.23.3.el6.x86_64 or later. Run uname -r to check your kernel version.
JDK version
Continuous profiling relies on JVM TI (Java Virtual Machine Tool Interface) to capture method stacks at runtime. This provides CPU utilization and memory usage details at the method level.
Certain JDK versions contain a JVM TI bug (JDK-8283849) that can cause application crashes. The following versions have fixed this issue:
| JDK | Recommended versions |
|---|---|
| OpenJDK | 8u352+, 11.0.17+, 17.0.5+ |
| Oracle JDK | 11.0.21+, 17.0.9+ |
For other JDK versions, internal testing shows crashes occur in rare scenarios. The feature remains available, so you can enable it for specific IP addresses to evaluate stability first. For production workloads, use a recommended JDK version.
Alpine base images are not supported
Continuous profiling depends on debug symbols in JDKs. Alpine base images strip these symbols to control memory usage, which prevents the profiler from collecting data. Use a non-Alpine base image instead.
Enable continuous profiling in the ARMS console
Log on to the ARMS console. In the left-side navigation pane, choose Application Monitoring > Application List.
On the Application List page, select a region in the top navigation bar and click the name of the application.
NoteIcons in the Language column indicate the application language:
 : Java
 : Go
: Go : Python
Hyphen (-): an application monitored in Managed Service for OpenTelemetry
In the left-side navigation pane, click Application Settings. Click the Custom Configuration tab.
In the Continuous profiling section, turn on Main Switch and configure IP white list or Network segment address to specify which instances to profile.
Click Save.
View profiling data
After you enable continuous profiling and your application processes traffic, you can view the profiling data.
In the ARMS console, navigate to Application Monitoring > Application List, select a region, and click the application name.
In the left-side navigation pane, click Continuous profiling.
Select an application instance from the list. Set the time range on the right side of the page.
On the Single View tab, explore the profiling data:
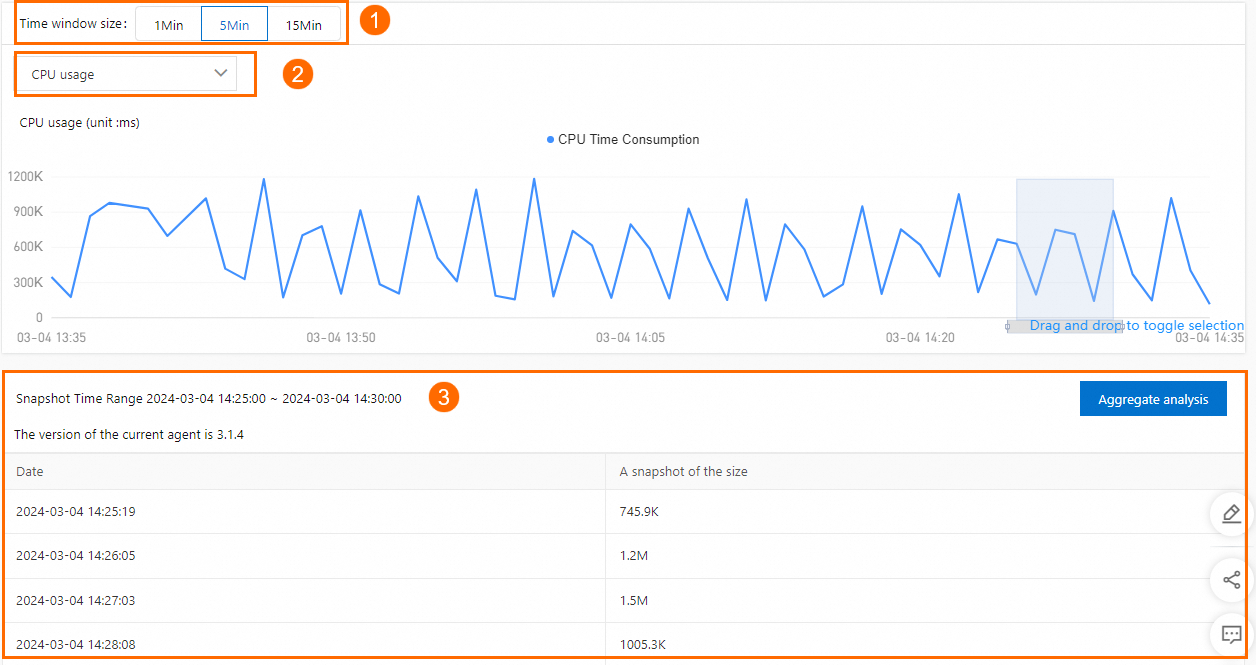
In the Time window size section, select a snapshot duration, then drag on the line chart to narrow the time range.
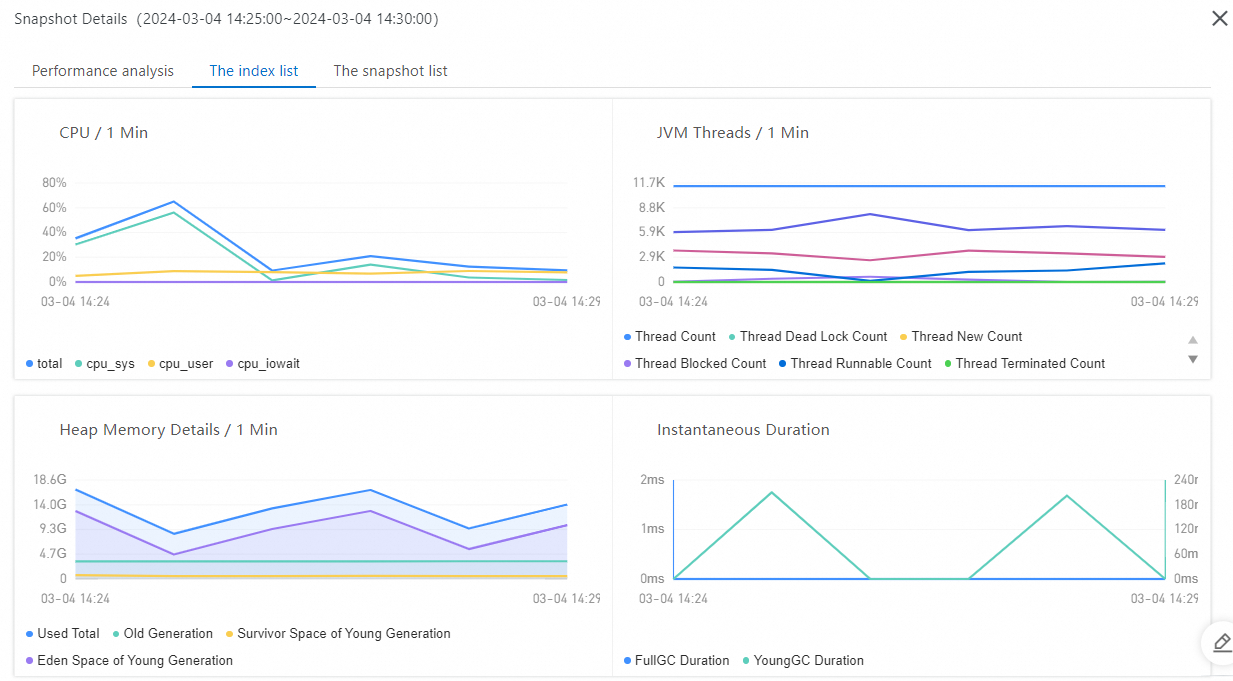
From the drop-down list, select the data that you want to view: CPU, JVM heap, or JVM GC.
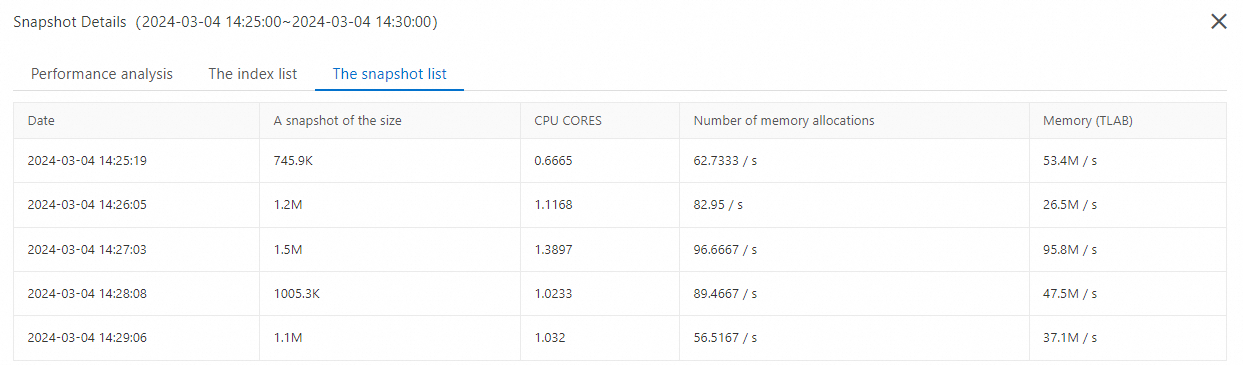
Review the data for the selected time range. Click Aggregate analysis to drill into the snapshot details.
Interpret the profiling results
The aggregate analysis view shows a method-level breakdown alongside a flame graph.
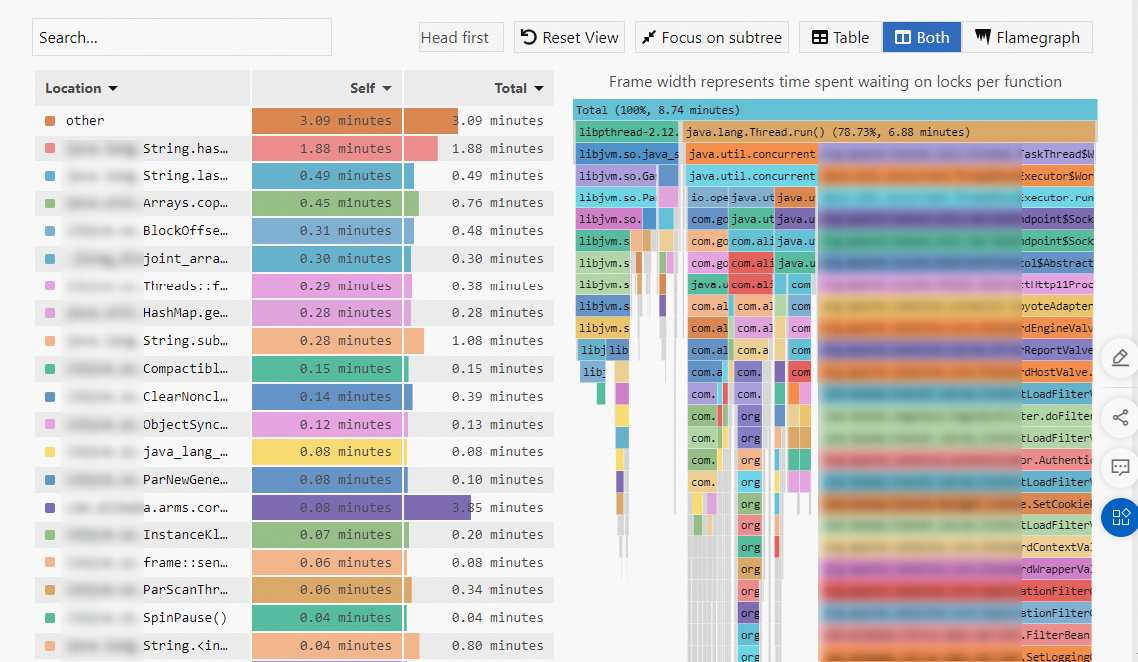
| Column | Description | When to use |
|---|---|---|
| Self | Time or resources a method consumed on its own, excluding child methods. | Find methods that are individually expensive. |
| Total | Time or resources a method consumed including all child methods. | Find call paths that contribute the most to overall resource usage. |
When analyzing hotspot code, focus on the Self column or the widest frames at the bottom of the flame graph. A wide frame at the bottom typically indicates a performance bottleneck -- the wider the frame, the more resources the method consumed relative to the total.
Compare data across time periods
On the Comparison View tab, select two time periods to compare profiling data side by side. This helps identify performance regressions or verify the impact of code changes.
Related topics
Diagnose specific performance issues:
Troubleshoot common issues with continuous profiling.