Interactive Analysis in Quick BI lets business users interrogate live data, reshape views on-the-fly, and surface hidden patterns without writing a single line of code. Drag-and-drop field placement, instant filtering, and contextual tooltips create a fluid “conversation” with the dataset, while five core interactions—drill-down, linkage, navigation, lasso selection, and annotations—turn any dashboard into an exploratory workspace. Because these capabilities run in the browser and leverage Quick BI’s in-memory engine, even non-technical staff can pivot between high-level KPIs and granular records in seconds, accelerating insight cycles and eliminating hand-offs to data teams.
The functionality is fully available across Personal, Advanced, Enterprise, and On-Premises editions, ensuring every organization tier can adopt a consistent analysis experience.
● Feature link: Interactive Analysis

Interactive Analysis equips business analysts with multiple advanced paths to dive beneath the surface of their data:
● Cross-chart Linkage – Synchronized highlighting and filtering reveal relationships between disparate visualizations, helping users grasp multi-dimensional correlations.
● Hierarchical Drill-down – Seamless movement from aggregate views to transactional detail uncovers root causes and emerging micro-trends.
● View Navigation – One-click jumps across reports or modules support holistic storytelling and reduce context-switching friction.
● Lasso Selection – Graphical region picks isolate precise data subsets, streamlining pre-processing and sharpening subsequent analyses.
● Key Annotations – Visual call-outs on critical metrics or outliers focus attention and ensure stakeholders absorb the headline insights instantly.

Within each chart’s Analysis Panel, Quick BI offers rich configuration options so users can tailor the interaction style and aesthetics to business needs. Notably:
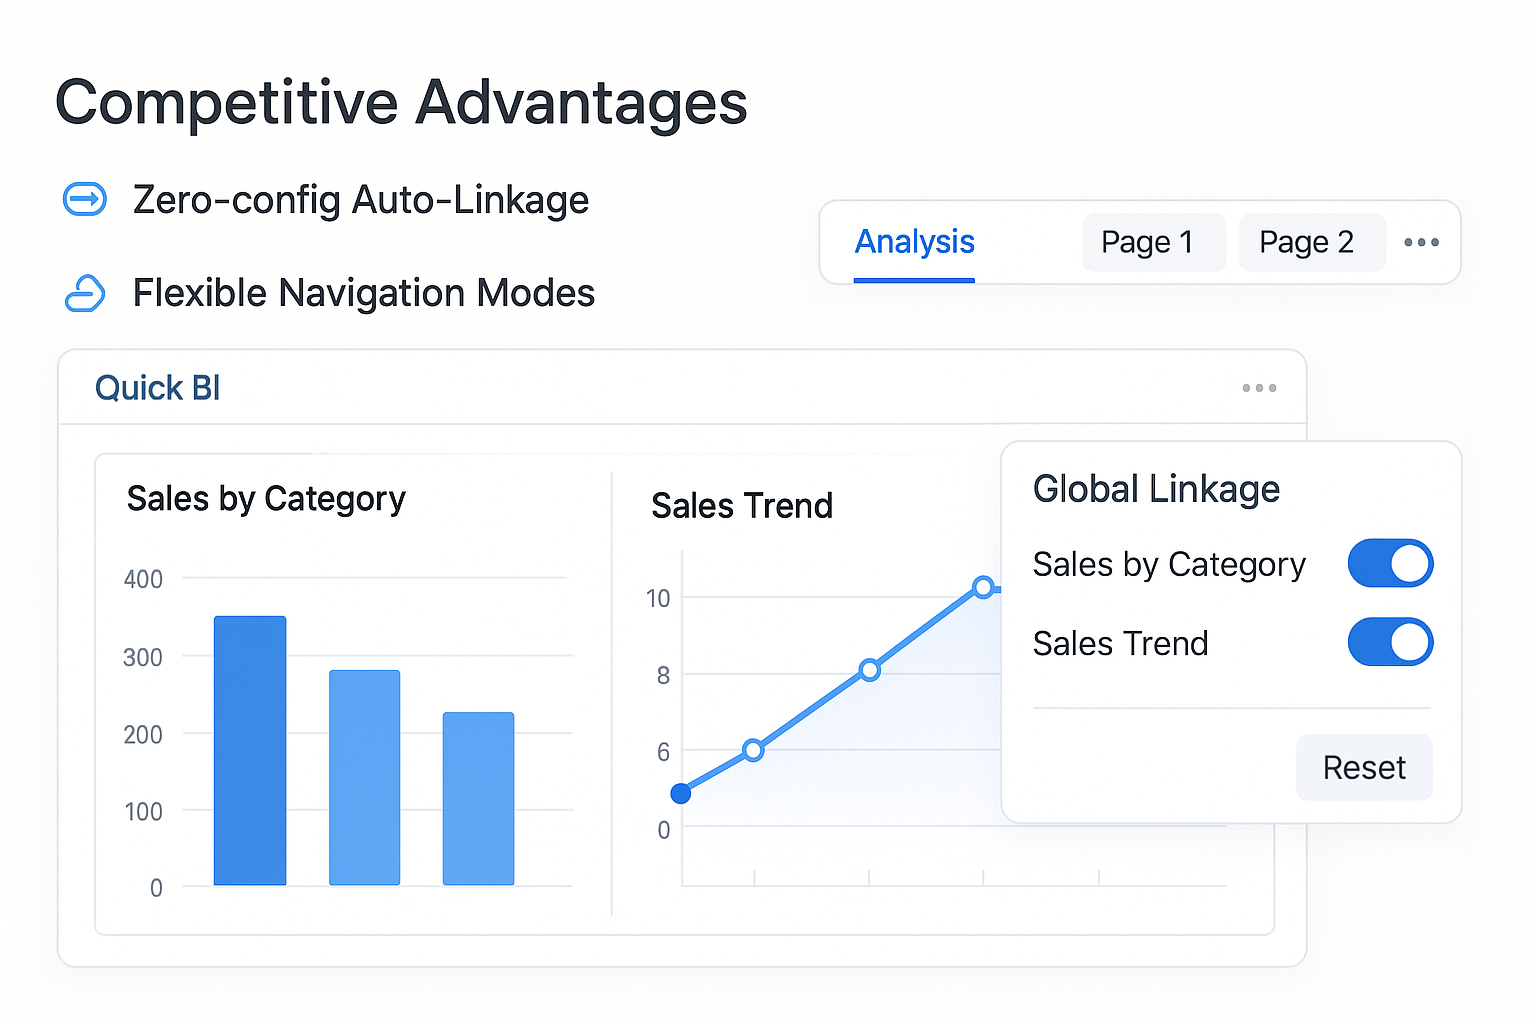
● Zero-config Auto-Linkage: When charts share the same dataset, relationships are detected automatically—no manual wiring required. A global linkage panel shows active states and provides a one-click reset, shortening the analytic path.
● Flexible Navigation Modes: Analysts can route parameters to another view within the same workbook, to a different page, or even to an external application module—enabling seamlessly integrated, end-to-end workflows.
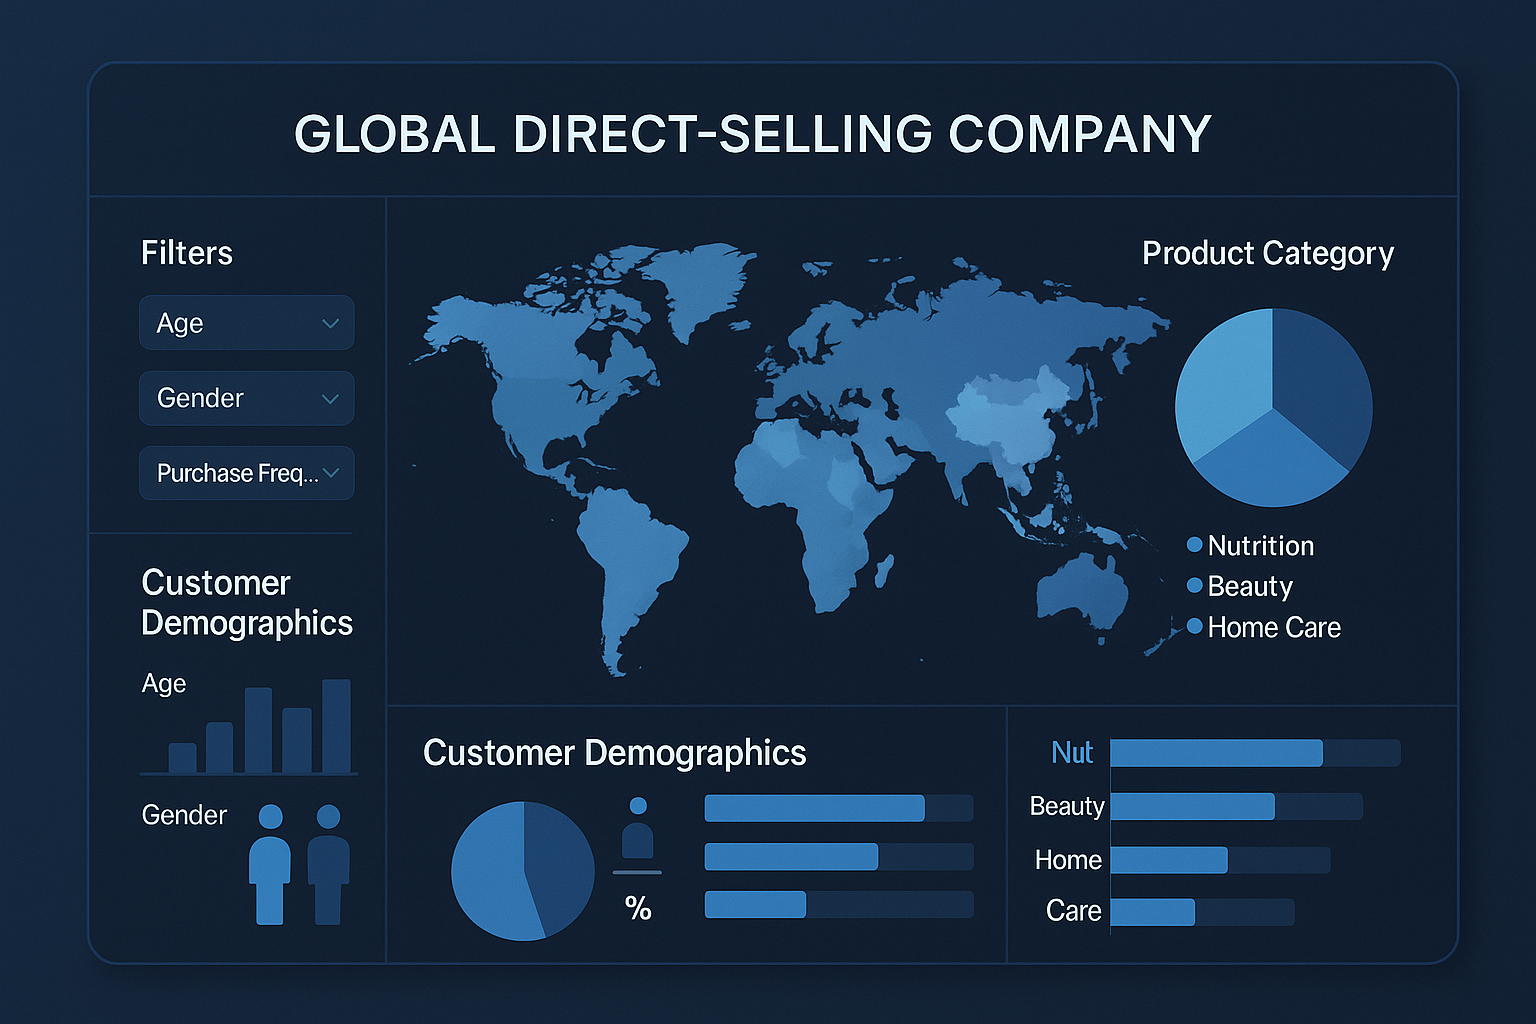
As a global direct-selling leader, Amway’s analysts build dashboards that tightly link geography, product category, and customer demographics. Auto-linkage lets them compare regional preferences or pinpoint target segments in moments, freeing time to uncover emerging trends rather than configuring interactions manually.
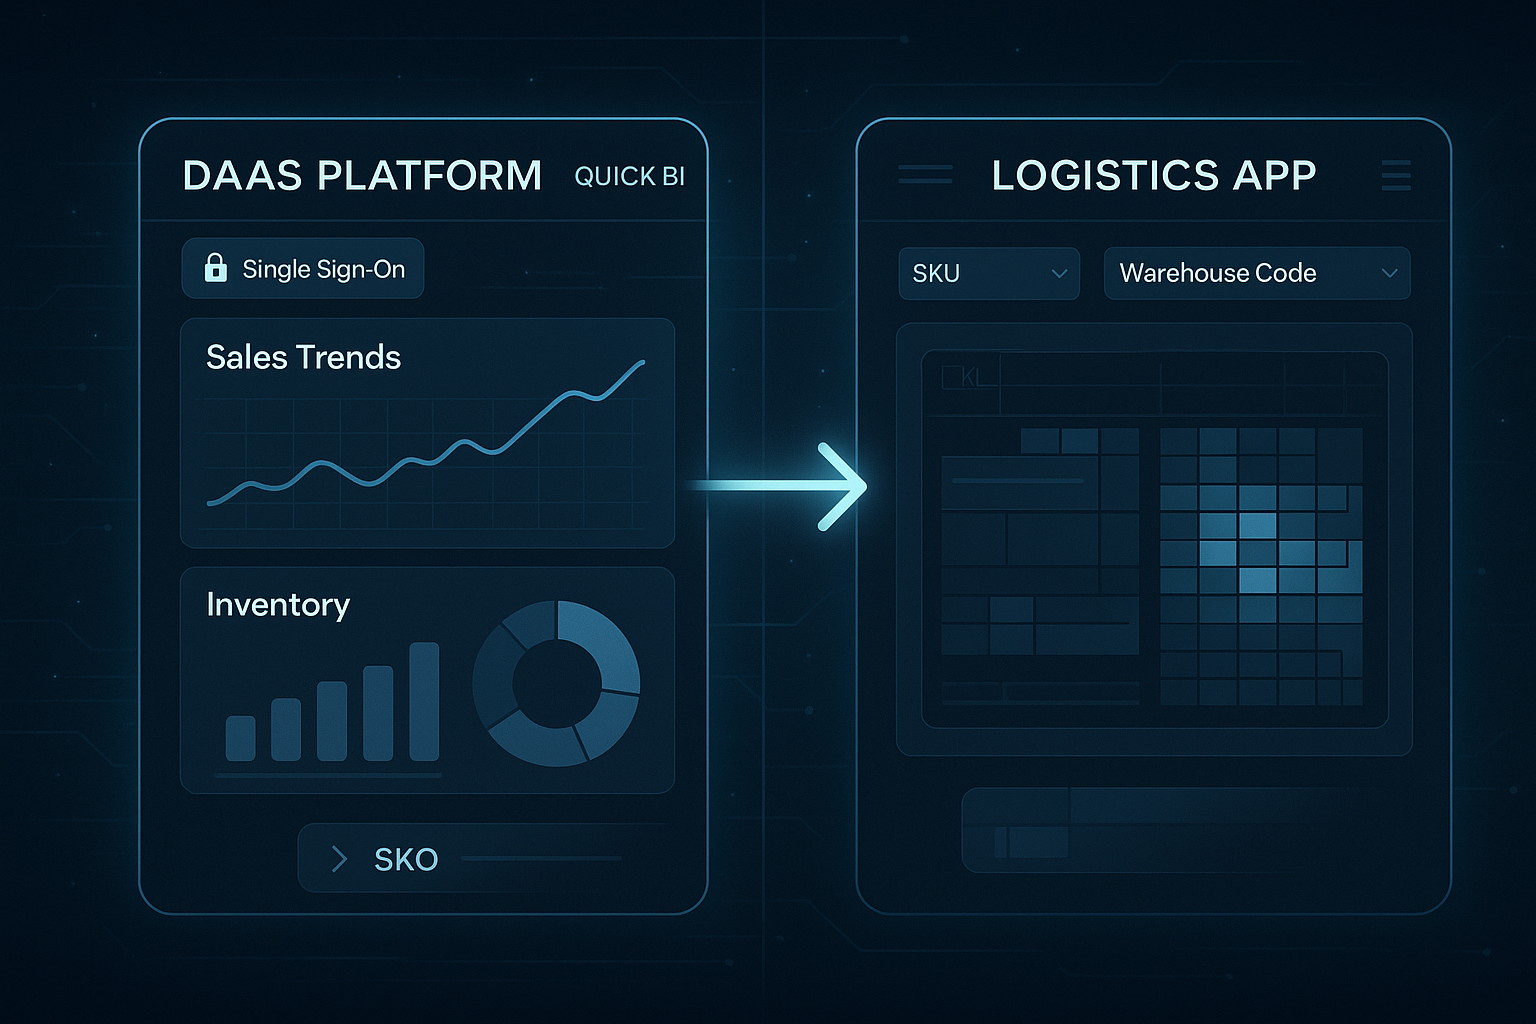
Haier’s DaaS platform embeds Quick BI to enable cross-system deep dives. Through SSO, a click on a Quick BI chart can open the firm’s proprietary application—passing parameters like SKU or warehouse code—to filter data instantly within the external system. Decision-makers move from sales history to inventory posture to demand forecast in one fluid journey.
For both enterprises, Quick BI’s Interactive Analysis module transformed static reporting into an agile decision cockpit. By unifying interactive exploration and multi-system navigation, the tool distilled vast data volumes into actionable insight, empowering leadership with fast, evidence-based strategy formulation.


1,539 posts | 516 followers
FollowAlibaba Cloud Community - April 2, 2026
Alibaba Cloud Project Hub - November 18, 2025
Alibaba Clouder - July 15, 2020
Alibaba Cloud Project Hub - November 12, 2025
Alibaba Cloud Community - July 11, 2025
Alibaba Clouder - February 2, 2021
1,539 posts | 516 followers
Follow QwenWork
QwenWork is dedicated to helping employees strengthen their professional competitiveness in the AI era and to enabling enterprises to improve organizational effectiveness.
Learn More Token Plan
Build more, spend less. One plan, every modality.
Learn More Big Data Consulting for Data Technology Solution
Alibaba Cloud provides big data consulting services to help enterprises leverage advanced data technology.
Learn More Big Data Consulting Services for Retail Solution
Alibaba Cloud experts provide retailers with a lightweight and customized big data consulting service to help you assess your big data maturity and plan your big data journey.
Learn MoreMore Posts by Alibaba Cloud Community

