
By Liuxing
Since it was founded, Alibaba's Data Experience Technology team has been dedicated to setting a benchmark for experience technologies in the data field. After years of development, Alibaba has formed a two-phase experience technology architecture for user products. This article focuses on the team's insights into SQL editors, business intelligence (BI) platforms, data visualization, digital art, and data security and presents the team's technological achievements and future development path.
In the era of the digital economy, data is as important as oil. Big data can be characterized by 4Vs: volume, variety, velocity, and value. Specifically, big data involves a large volume of data, many types of data, high processing speed, and high commercial value. Proper use and accurate analysis of the data provides a great deal of value to enterprises.
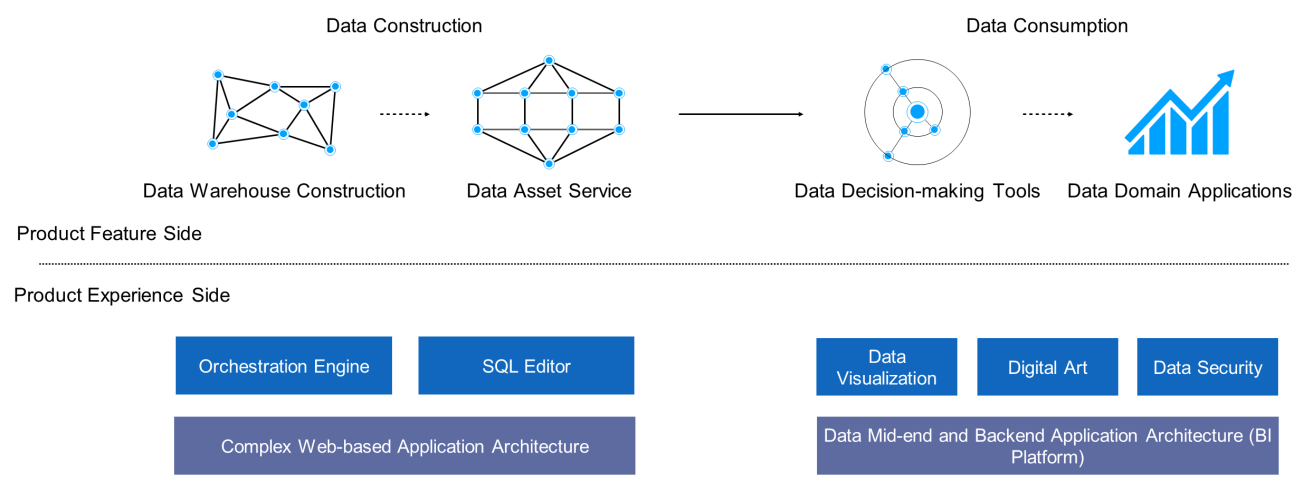
On the data construction side, the Alibaba Data Experience Technology team has constructed a large-scale web application architecture, such as the iron redux library of the TypeScript solution and the API service Pont. We have also developed a service orchestration engine and SQL editor at the upper layer to enhance the user experience at the tool layer. On the data consumption side, we are committed to core capabilities such as building data reports based on BI products. The upper-layer features, such as data visualization, digital art, and data security, all have made in-depth contributions to various fields.
Editors are an important partner for developers in the pipeline running from data collection to processing, management, and application. In the frontend field, editors belong to the high-complexity domain. In particular, the SQL editor is vertical construction in this domain. In the editor design process, we have performed in-depth analysis and optimization in the areas of syntax understanding and context understanding.
To learn a new language, it is possible to go through the dictionary in alphabetical order to learn all the words and phrases in a language. Or, you can talk with other people and learn the words and phrases they use. As the learner talks with a wider range of people, the learner develops greater speaking skills
This is also true of the syntax understanding process used by the editor. The editor analyzes the syntax based on production of the language or trains a model based on samples and then recognizes the syntax by using the model. The definition of production of a language can be thought of as the dictionary for this language. This illustrates all lexical and grammatical aspects in detail and clearly depicts the boundaries. SQL has a relatively simple syntax and a good structure. Therefore, the production-based analysis solution is suitable for SQL. In contrast, for languages with complex syntax or high flexibility, such as Python and Shell, providing keywords suggestions after production-based analysis are not helpful for improving the development efficiency in actual applications. Instead, you need to train a model based on the historical data of business scenarios to suggest code snippets that contain business meanings.
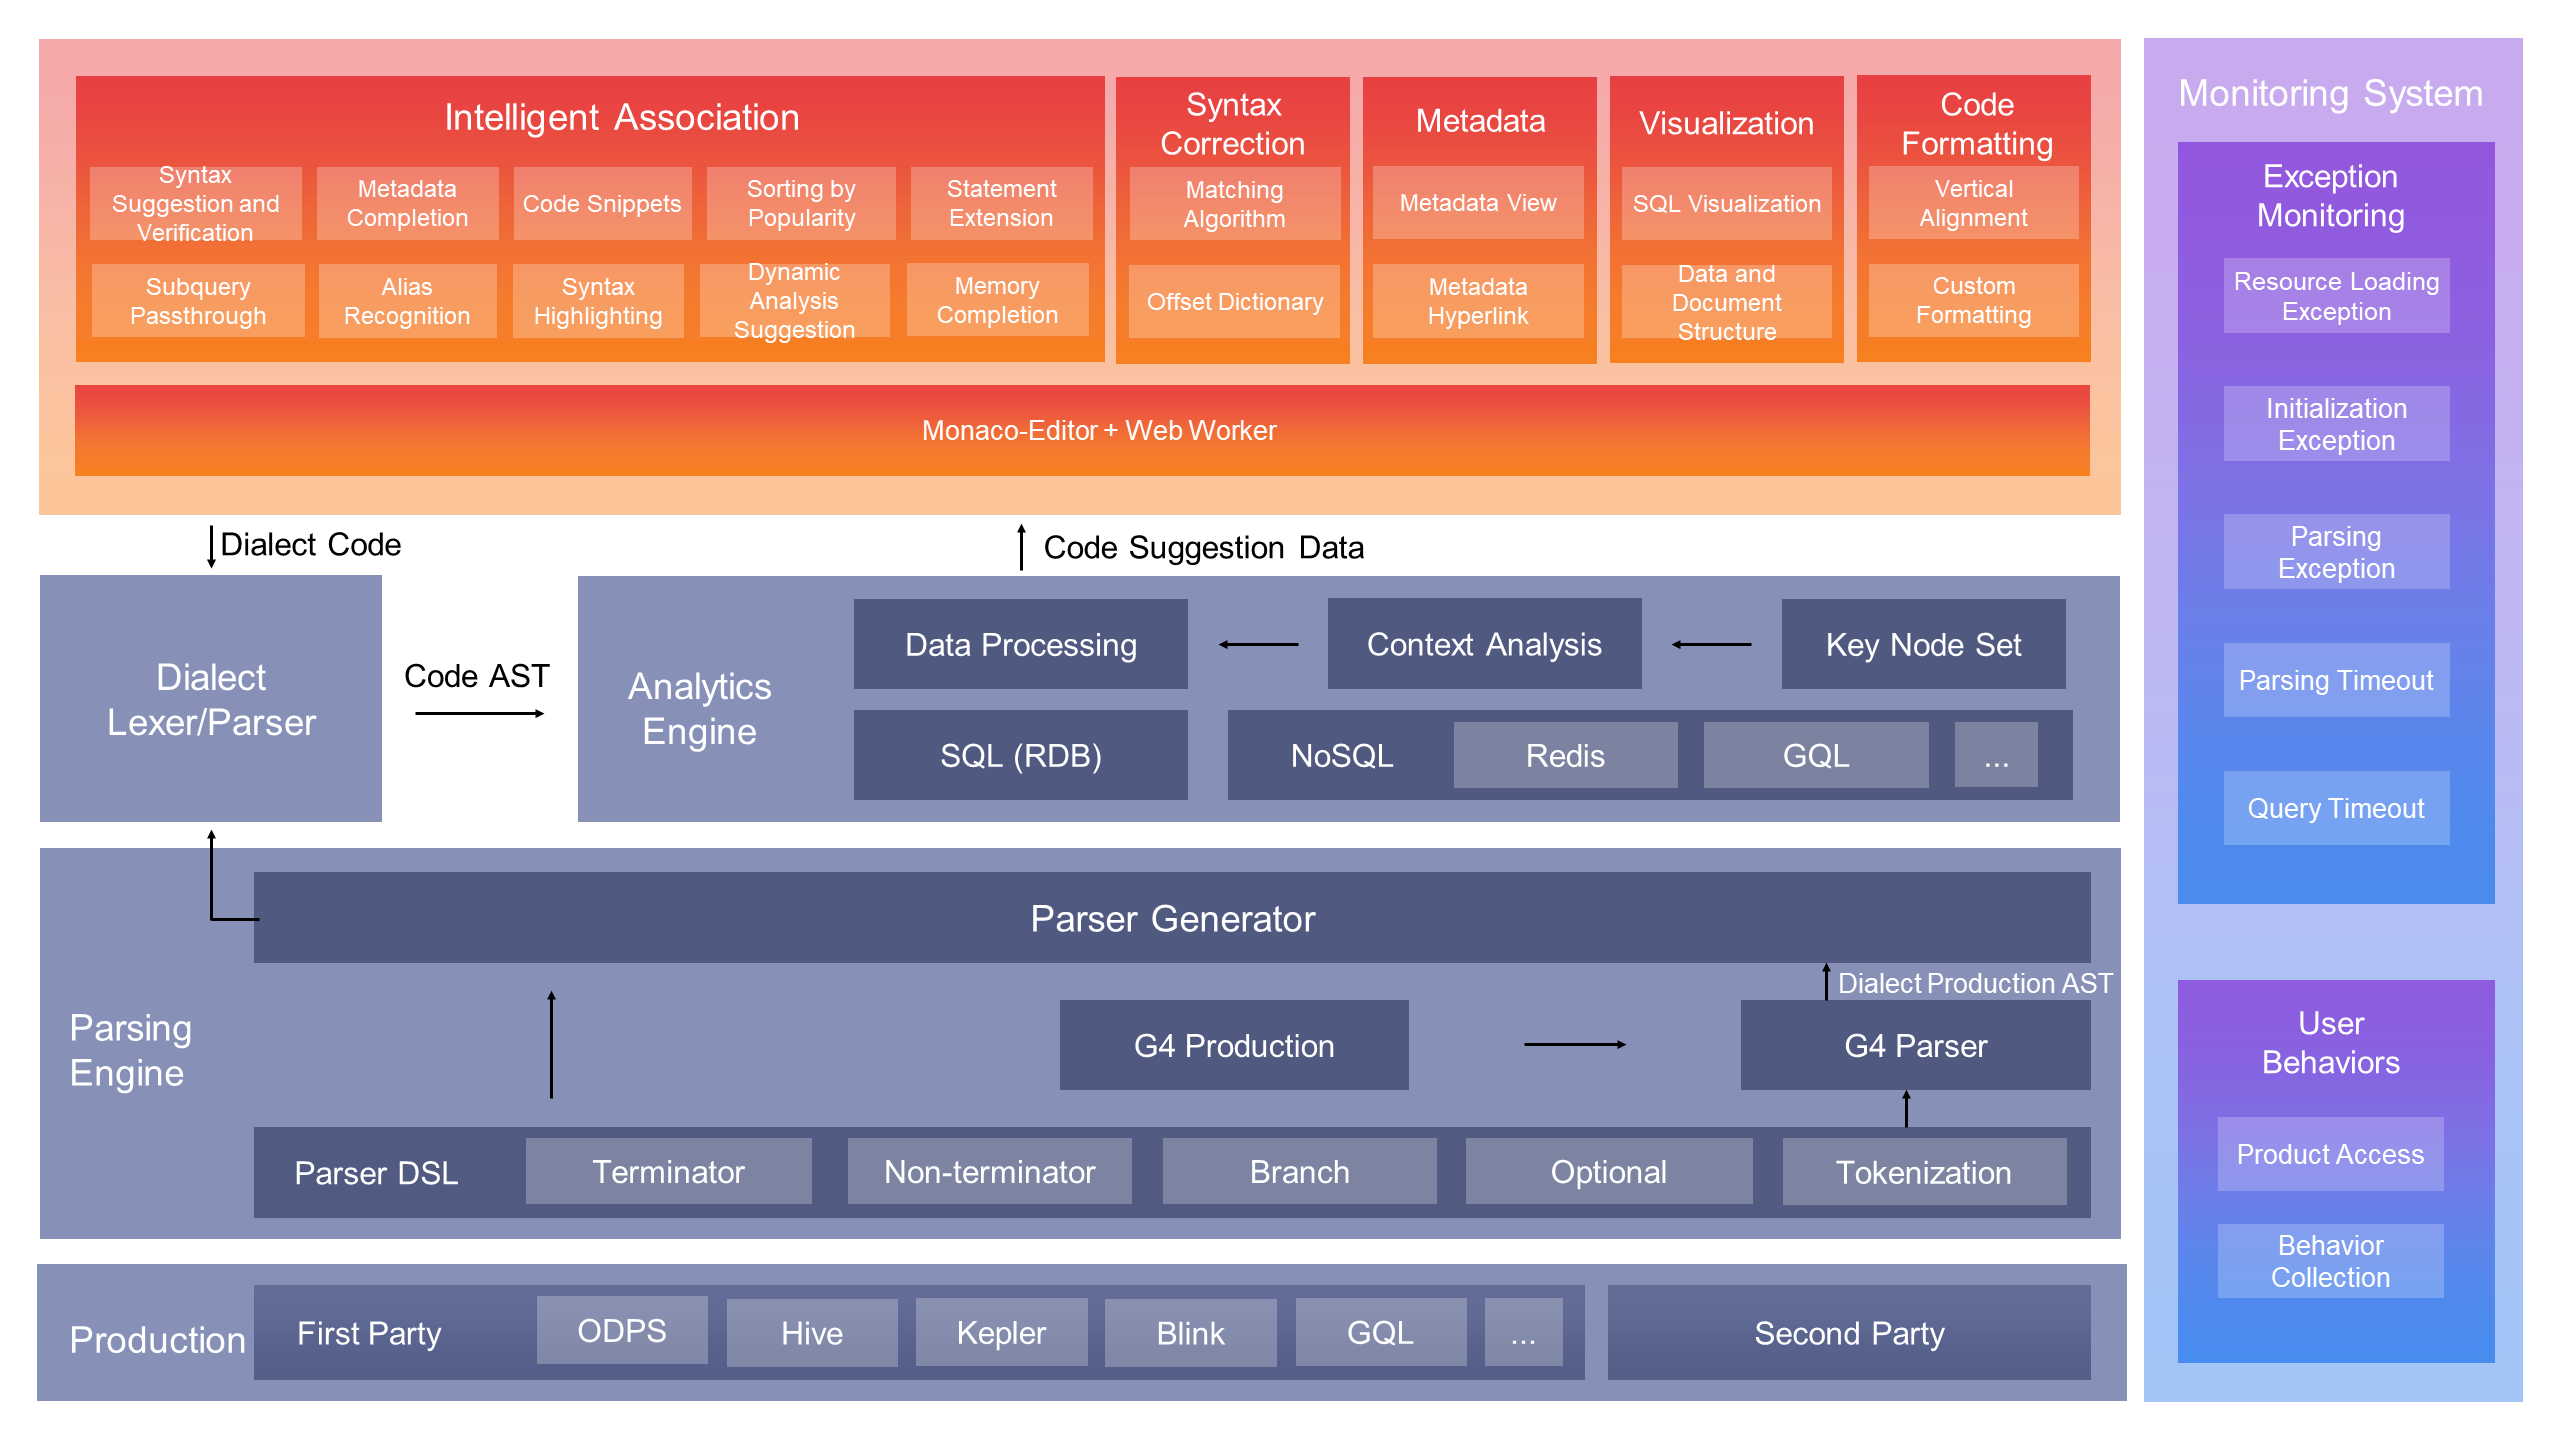
Architecture Diagram
Syntax understanding is the most fundamental capability of the editor. Different editor schemes have different implementations. When we are designing and implementing editor schemes, we attach greatest importance to high scalability, easy maintenance, and high performance.
The products equipped with the editor usually have some customization requirements, such as support for variable syntax, injecting global variables, adjusting the priority of suggestions, and adding shortcut key operations. Although the results are presented on the UI in all cases, the solutions for meeting these requirements vary. Therefore, we designed a three-layer architecture for the editor, including the production layer, the parser layer, and the component UI layer. We also defined API specifications to ensure that capabilities can be decoupled and scaled between different layers.
To meet requirements, we inevitably need to modify production of the language. Any negligence in this process may result in ambiguous syntax or left recursive syntax, resulting in parsing exceptions, incorrect suggestions, or an endless loop. Therefore, we need to track the parsing process for user input to find out the clause that fails to match target production and then check whether production is correctly defined. As a result, production debugging becomes one of the core syntax extension tasks.
The control over suggestion accuracy and the design of suggestion rules complement each other to ensure high performance. You can always find a syntax definition that LL(k) cannot recognize, but LL(k +1) can. To meet performance requirements, we cannot infinitely increase the backtracking step size while achieving a certain accuracy.
In most cases, we need to develop the feature in Python and Shell by using the TRANSFORM clause or user-defined functions (UDFs) to supplement the poor process control capabilities of SQL. We will also use machine learning solutions to support syntax suggestions in Python and Shell.
To draw a final conclusion, the editor needs to further analyze the context of the syntax based on an understanding of the syntax. Syntax parsing is actually the process of converting user input into an abstract syntax tree. In other words, the context that the editor needs to understand is all on the tree. However, when we empowered the context understanding capability on the editor, we found that the biggest challenge lay not in the implementation of the analysis logic, but in the replication and mass production of the analysis logic. Because businesses require the support for a large number of dialects, which are somewhat different in terms of syntax. We not only need to have similar capabilities for understanding the context of different dialects, but also need to avoid stove-piped development. After analysis, we found that the implementation of the understanding of each type of context focused on defining several key terminators and non-terminators. Therefore, we built a finite state machine based on these key nodes. When a new dialect accesses the editor, the editor provides the state machine with a mapping relationship to indicate the mapping between key nodes. In this way, the context understanding capability is replicated and mass produced. The establishment of this mechanism represented the exposure of context understanding capabilities, which we mentioned when discussing exposing the capabilities of the editor.
Context understanding also requires data analytics capabilities. The data profiling capability allows the editor to predetect some common data quality problems that may occur during data development and then provide suggestions and guidance during development. This avoids a waste of computing resources that would otherwise result from the conventional data governance process. Let's look at an example of data skew governance. When a user's task failed, the editor performed data profiling and analysis and found that the failure was caused by data skew. Data skew lasts for a period of time. During this time, the user performed a development operation that involved the field that caused data skew. The editor provides a suggestion for the heat value information to instruct the user to redefine the code. In addition, other types of data quality problems, such as brute force scanning, inconsistent field types on both sides of a join operation, and other map join optimization scenarios, can also be avoided based on detection and suggestions during development.
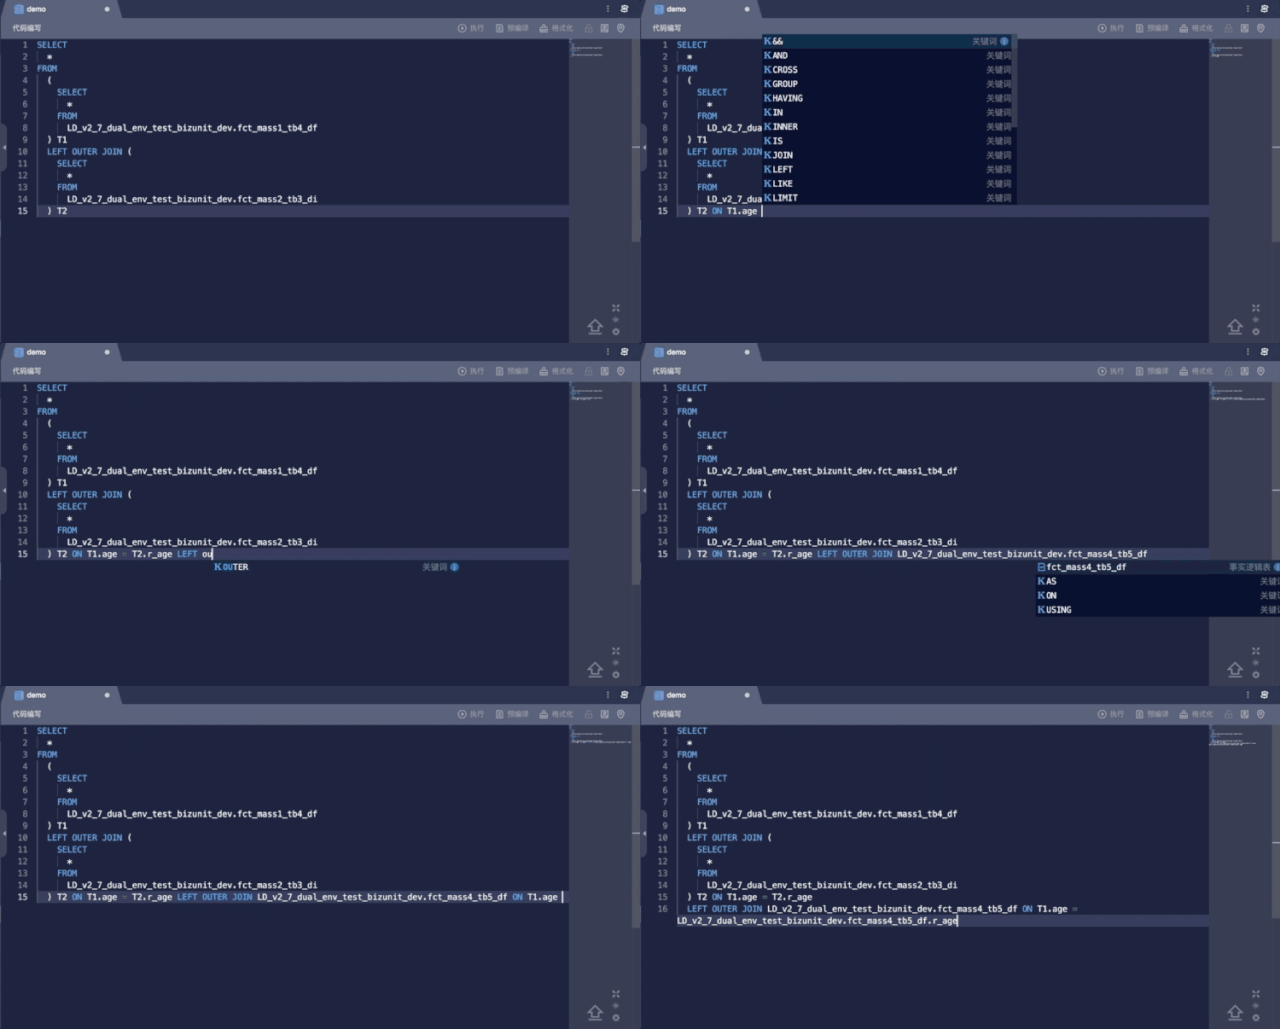
Syntax Suggestion

Alias Recognition

Keyword Correction
The BI platform is a mid-end and backend application architecture that helps us make better use of data to improve decision-making quality. It is developed based on a large number of frontend data applications. At the upper layer, the BI platform supports Quick BI, Quick A+, and other data products and gathers and develops the core capabilities of data analytics.
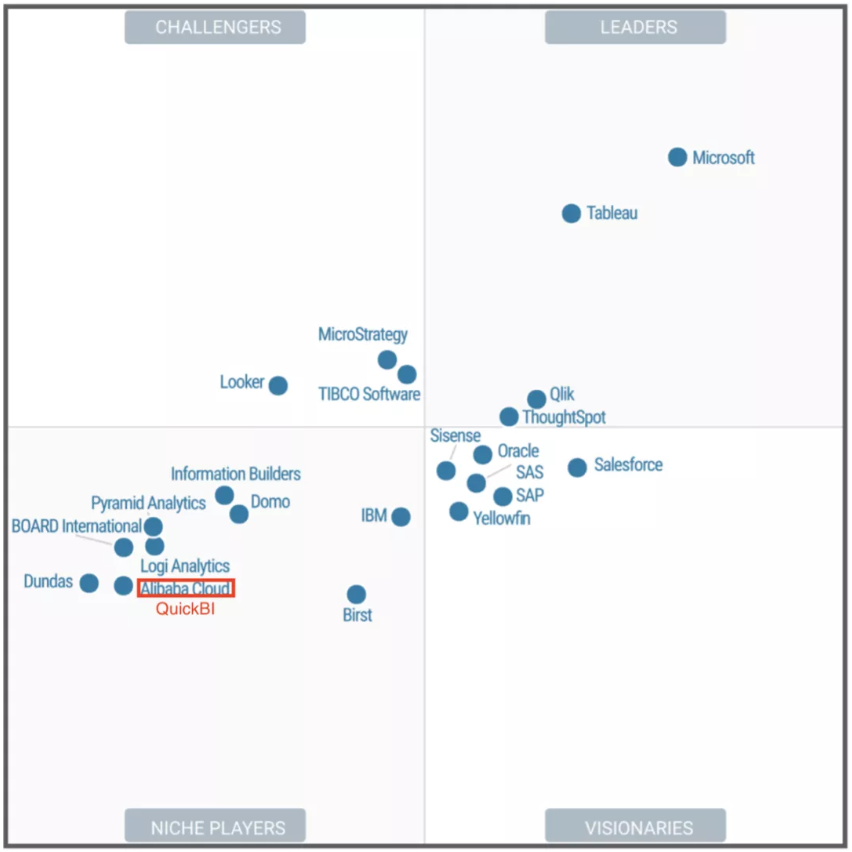
Quick BI is the core of the BI platform and is a leading data mid-end product. In 2019, it became the first and only Chinese product to be included in Gartner's BI Magic Quadrant. BI is a typical interaction-intensive analysis scenario. The entire BI analysis pipeline includes data ingestion, data modeling and processing, report creation, interactive analysis, access sharing, and integration.
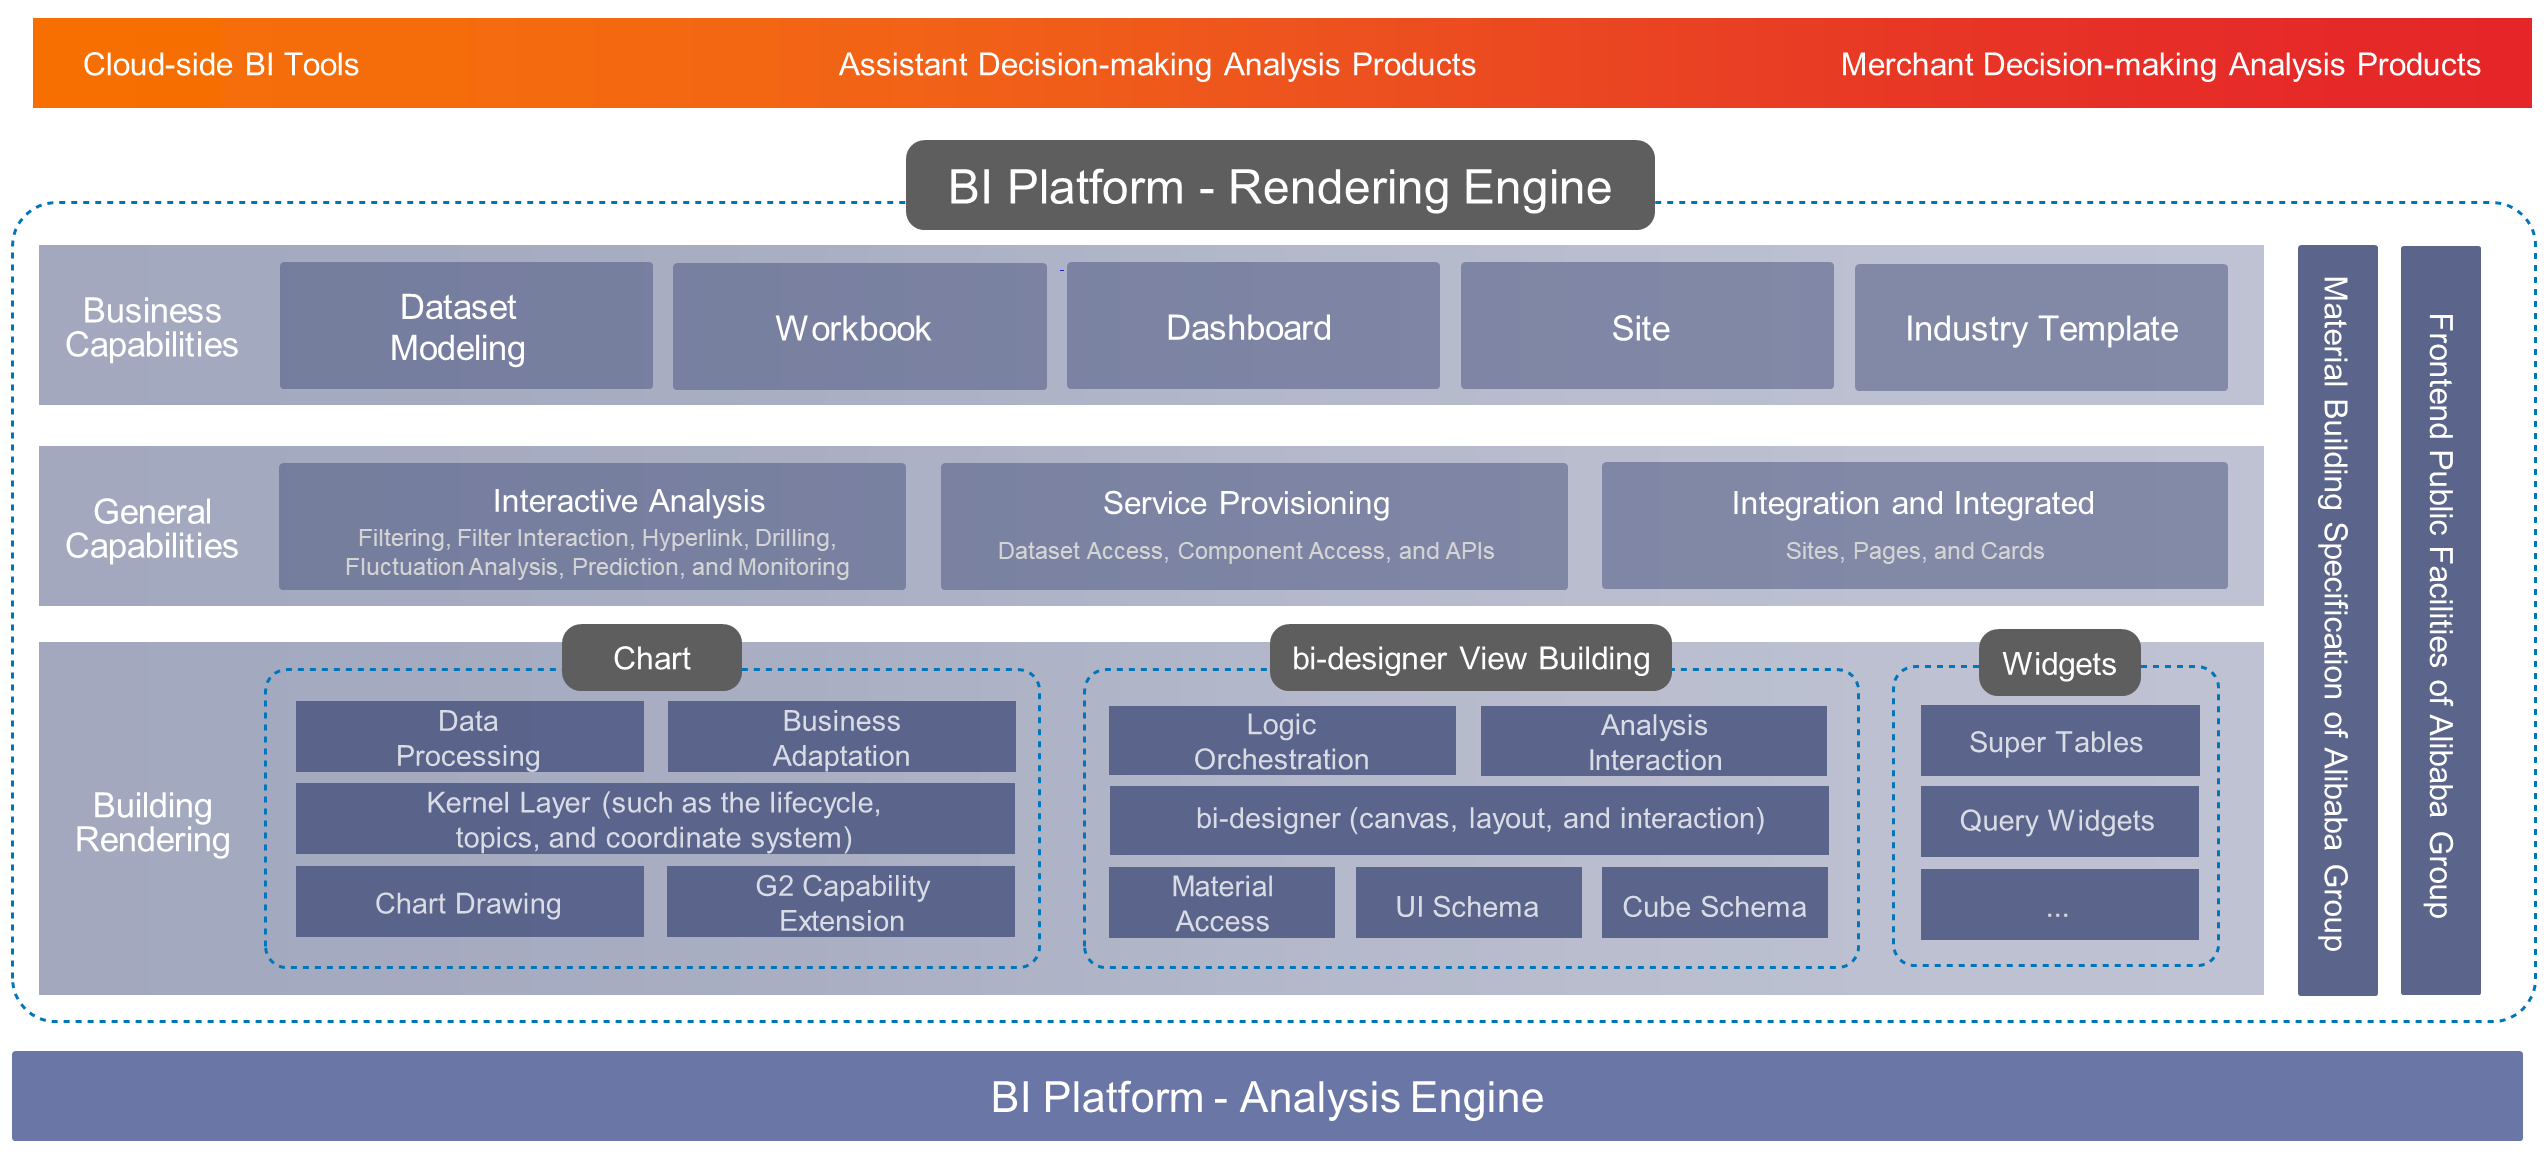
BI is a highly challenging building scenario. Its building capability is as important to Alibaba's Data Mid-end as water and air to humans and largely determines the competitiveness of the Data Mid-end. Business personnel can only use many products by building various capabilities. This interaction method is just like the rich client interaction methods provided by PowerPoint. The loading of millions of data entries is a constant performance challenge. In addition, single-page projects and the connection to the open ecosystems of independent software vendors (ISVs) involve engineering challenges. Therefore, we abstracted the rendering engine kernel bi-designer and added support for internal and external quick iterations of BI products.
We have introduced bi-designer into the low-code engine organization of Alibaba Group as a member of the core architecture team, focusing on building capabilities in the data field. We are submitting proposals to extend protocols for the Alibaba low-code engine and standardize the bi-designer to integrate its code with the AliLowCodeEngine.
Specifically, the data construction engine bi-designer has the following features:
Naturally, three sets of layout capabilities are required for our three types of business scenarios:
The bi-designer is equipped with these layout capabilities through the plug-in mechanism, allowing seamless switching between streaming layout, tile layout, and free layout so that different layouts can be provided for different products. The free layout adopts the highly realistic simulation solution provided by Keynote as well as features such as adsorption, alignment, combination, and locking. The tile layout has also been optimized to improve the user experience for height adaptation and smart drag and drop for width and height adjustment.
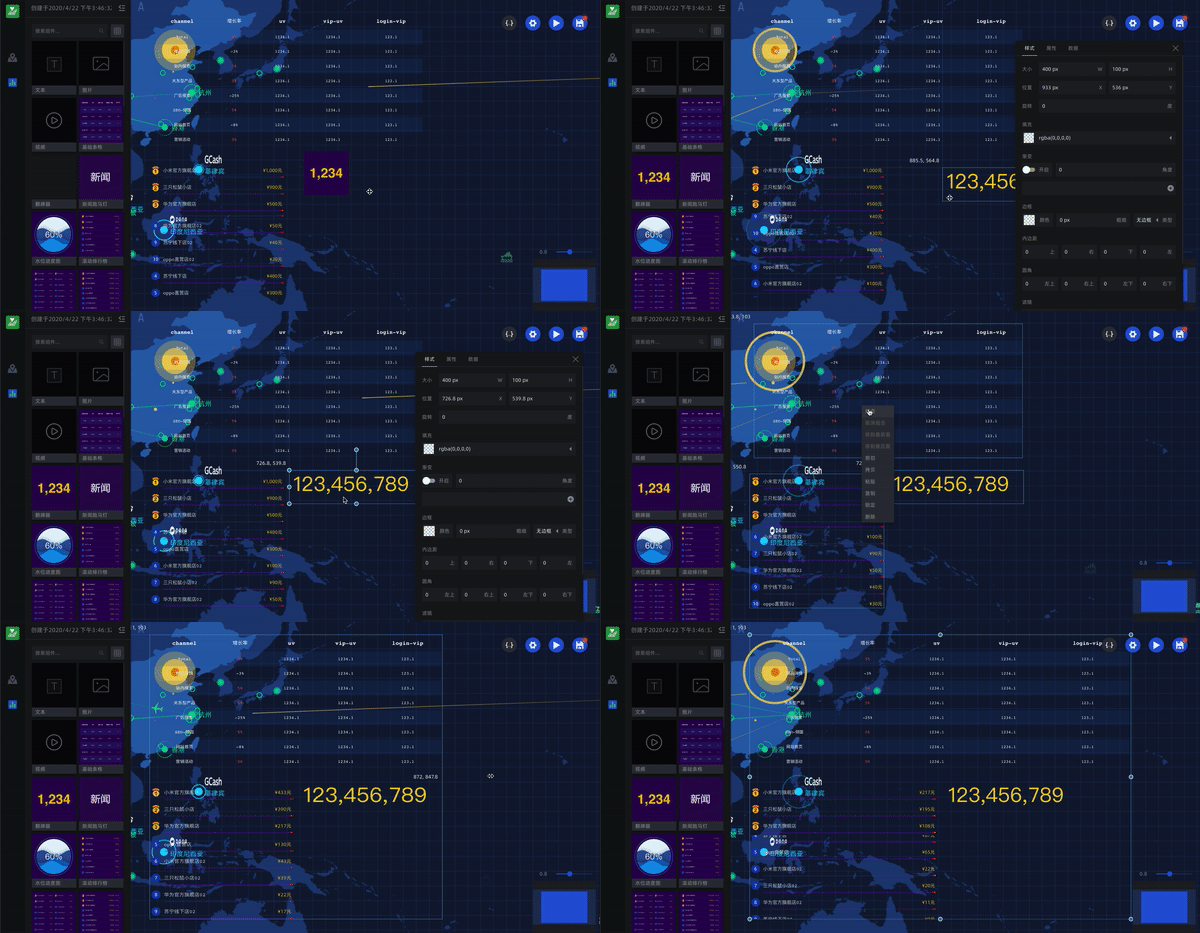
BI building has a powerful runtime analysis capability. For example, data entries that belong to the same dataset are automatically associated based on the online analytical processing (OLAP) data model and a click or box selection operation on the chart can trigger queries and automatic filtering on other components.
To configure simple filter interaction, you need a set of runtime parsing capabilities. The bi-designer provides a runtime event mechanism runtimeConfig to map any component configuration to a complex event association result. For example, you can click a chart to control the changes of attributes in the chart, click a data acquisition parameter to control the changes of the data acquisition parameter, and click a filter condition value to control the changes to the filter condition value. The bi-designer also provides a built-in data model to process acquired data and perform many-to-many association, filter interaction, and value synchronization on the acquired data based on filter conditions. A line chart or any other component registered on the platform can provide display and filtering capabilities.
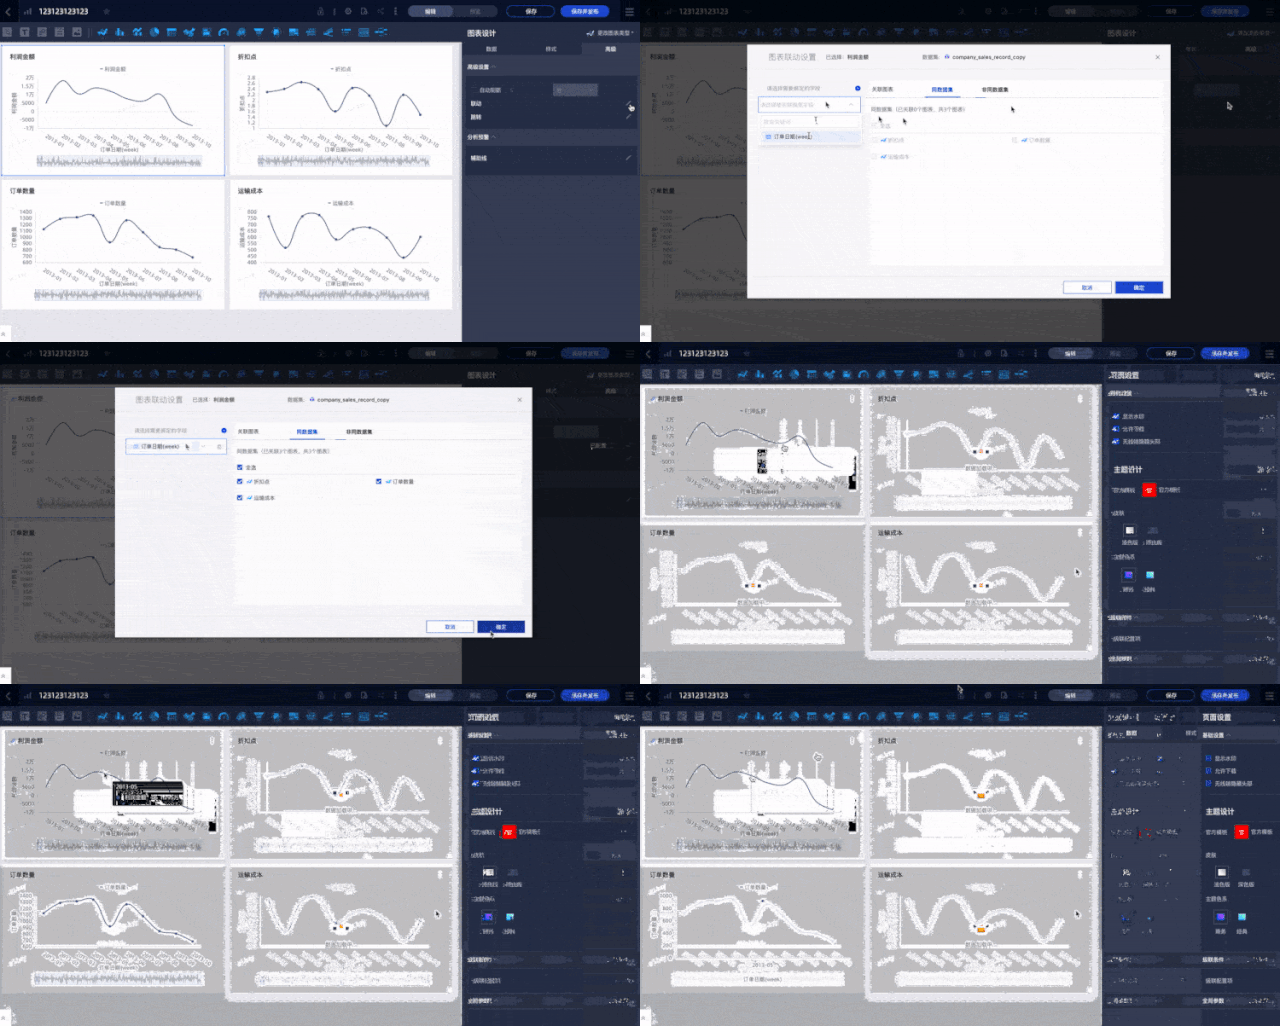
In most BI scenarios, millions of data entries are involved. When we optimized a lot of components, such as virtual scrolling and data sampling, we also enabled the rendering engine of bi-designer to render components on demand.
We also specially optimized data acquisition scenarios. A lazy-loaded component does not block data acquisition, but only blocks the rendering of the component. In this way, the data of the component can be loaded soon after the component appears, freeing you from the need to acquire the data.
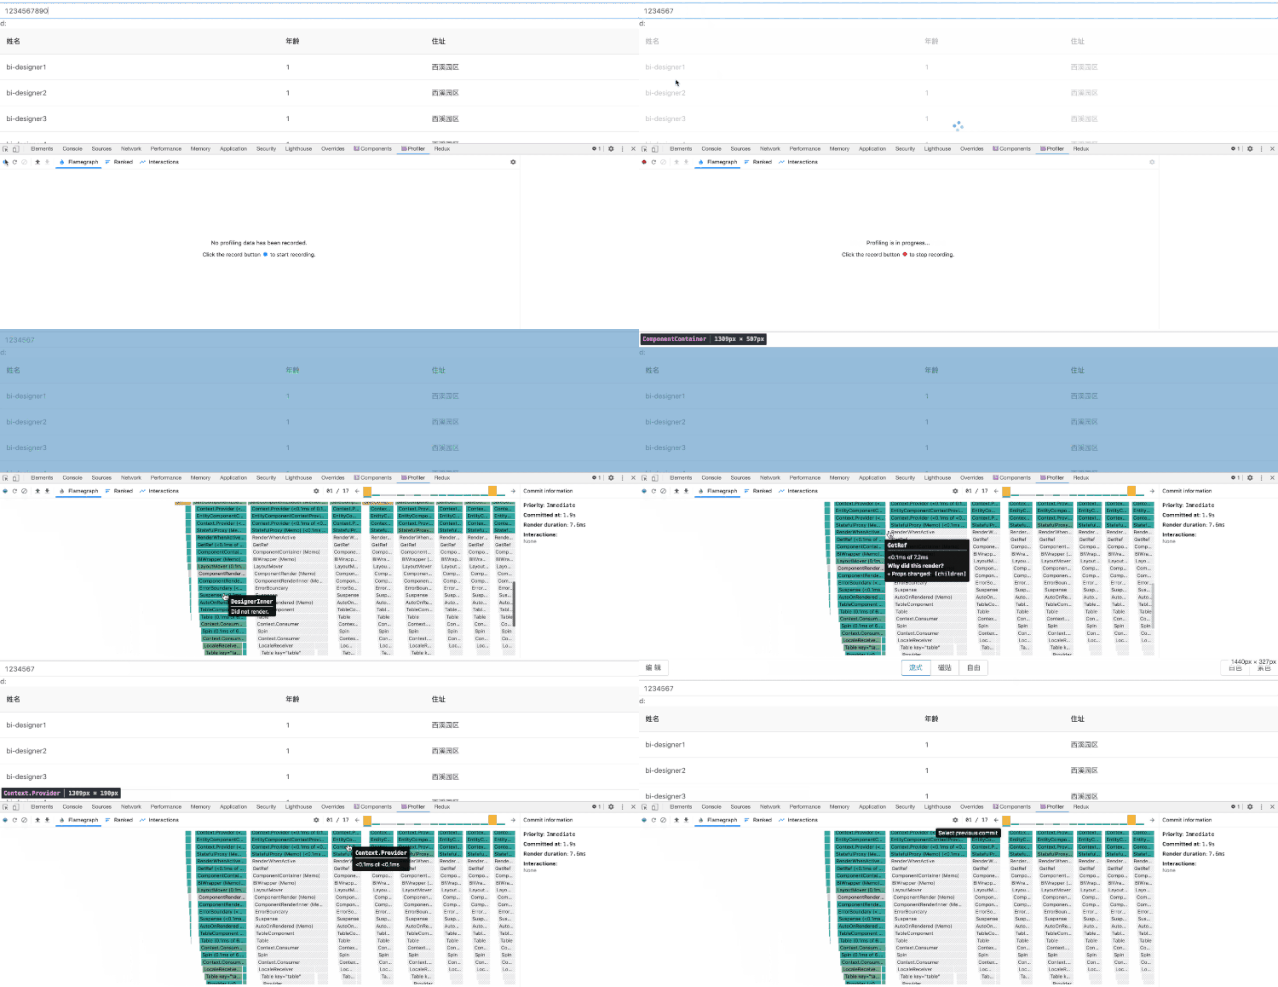
Both Alibaba and the cloud market are eager to integrate BI reports into existing systems. Integrating several reports or designers into existing systems has gradually become a trend. We developed bi-open-embed and integrated bi-designer capabilities into it, allowing the rendering engine to be easily integrated into any platform. We abstracted three common middle layers on the client and server sides: PostMessageProxy, router, and Embed API. The three layers define message distribution, instruction receiving, and instruction execution, respectively. The underlying layer on the server side connects to the bi-designer engine and the client side connects to access-party applications.
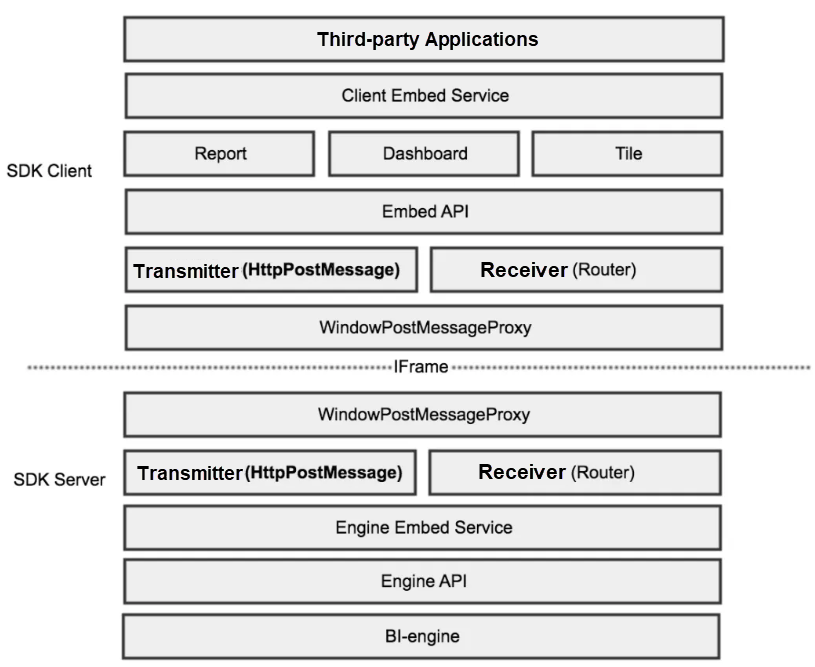
In the integrated field, we have also made great efforts in component security isolation. Starting from when a component is packaged, the build tool is used to isolate the formats of the component. Then, JavaScript (JS) environment variables are isolated when component scripts are loaded. In addition, when we designed the Embed API, we started from the permission system and ended with control over the report module, the filtering module, the topic module, and other modules. The Embed API allows you to dynamically pass in data acquisition parameters to influence the report data acquisition results.
This year, we also concentrated on developing the low-code capability on the data construction platform. Low-code includes no-code and low-code. No-code allows you to build general scenarios based on models or standardized templates without defining the code. Based on no-code, low-code allows you to implement more customized business logic by using little business logic code, such as code for variable binding or event actions. Low-code has wider applicability than no-code.
When we built the mid-end and backend of Alibaba Group, we described low-code business protocols by using Low-Code Definition Languages (LCDLs), which mainly include the application LCDL, page LCDL, and component LCDL. Based on these three core protocols, we developed the following pluggable core modules:
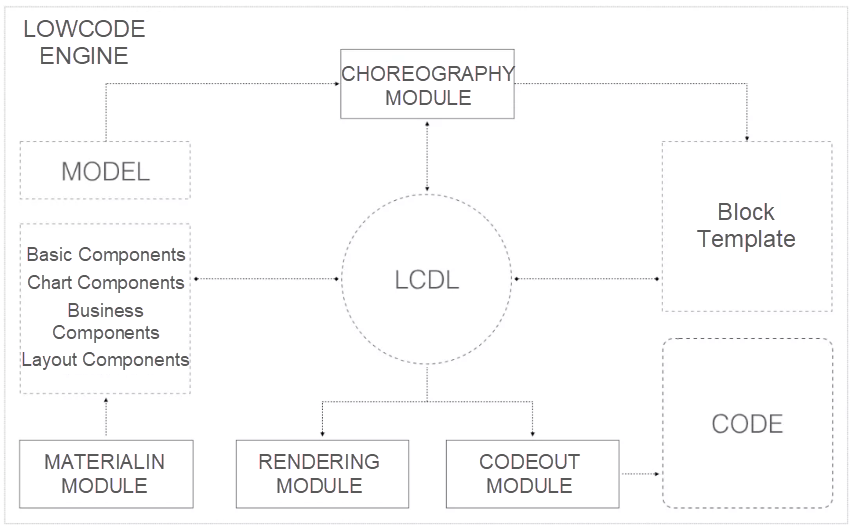
Data building scenarios are vertical and driven by data models. Therefore, low-code is was a major need for a long time. However, as the data mid-end business grows and the data teams from Hema Fresh, Cainiao, Local Life (Bendi Shenghuo), Ele.me, and other business units (BUs) in the Alibaba economy are joining in, the demand for building data products with low-code capability is growing. Therefore, we joined the low-code engine organization of Alibaba Group as the core team this year to build data products with the organization. We output building capabilities for data scenarios to the organization and obtain the low-code engine capabilities from the organization.
When we are processing information, our visual sense is much faster than our other four senses. In the book named "Information Is Beautiful", the author compares the visual sense to the bandwidth of computer networks, with the processing speed reaching 1250 MB/s. The author ranks the sense of touch as the second fasted and compares it to a USB port, with a processing speed reaching 125 MB/s. The author compares hearing and smell to a disk, with a processing speed of only 12.5 MB/s. The author ignores the sense of taste. Data visualization allows you to visualize obtained data after you cleanse key data. Just as when presenting a delicious dish to diners, this process requires a great deal of imagination.
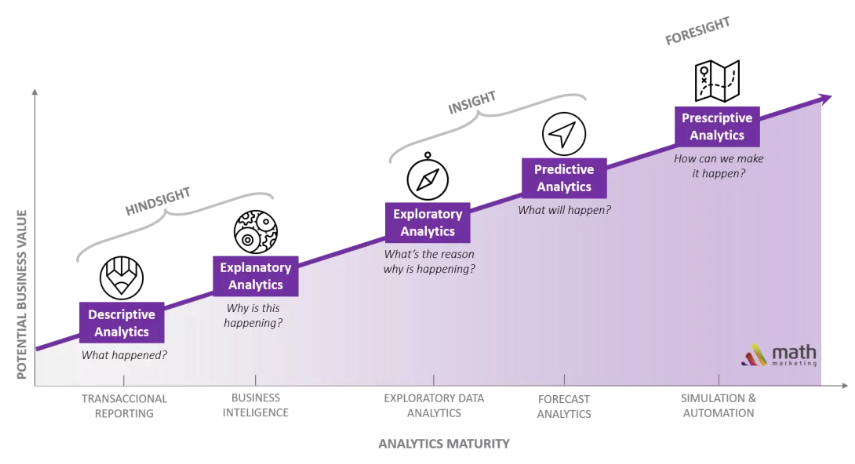
Visualization has always been an important step in data analytics. Studies on visualization in the industrial community and those in academia have a high degree of overlap. Visualization separated from analysis has no soul. As shown in the preceding figure, which is sourced from a research company, data analytics has undergone a series of development phases, ranging from descriptive analytics to explanatory analytics, exploratory analytics, predictive analytics, and prescriptive analytics. Prescriptive analytics is the final phase of data analytics. This phase can tell us what we can do, which is similar to the final phase of artificial intelligence (AI).
Matched capabilities are available in the previous phases of visualization. This fact is not common knowledge. Visualization not only resolves the problem of how to display data, but also tells you how to transfer information or even how to transfer more effective information.
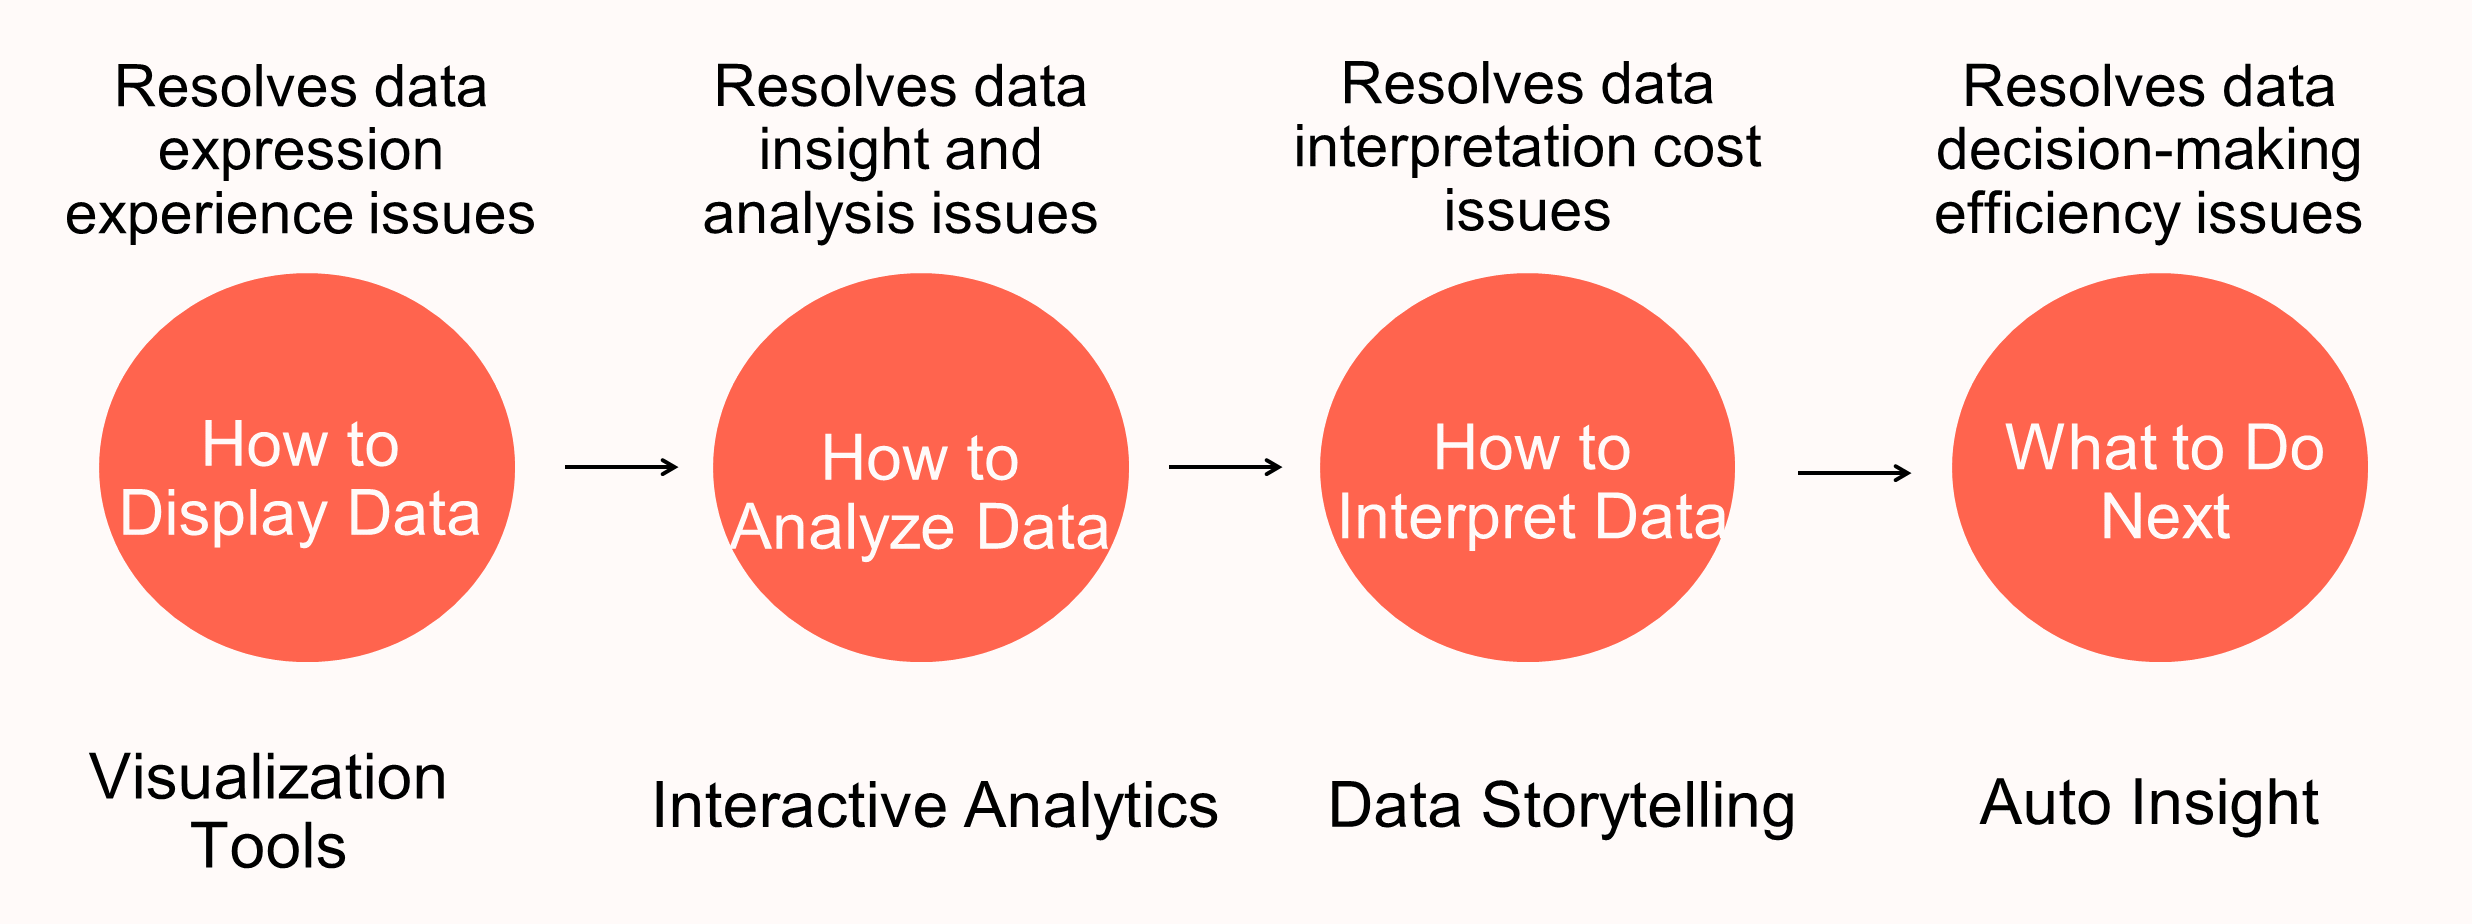
Our team has distributed products in all these four phases. Visualization tools are also our foundation. Based on the development of BI tools, we built visualization capabilities for the overall data team and built a complete base layer based on D3 and G2. With business capabilities at the tool layer, BI products provide comprehensive interactive analytics capabilities. The standard mapping between the upper-layer graphic syntax and the data model allows us to implement the visual kernel by using one set of architecture, greatly enhancing the capabilities of the basic library at the kernel layer.
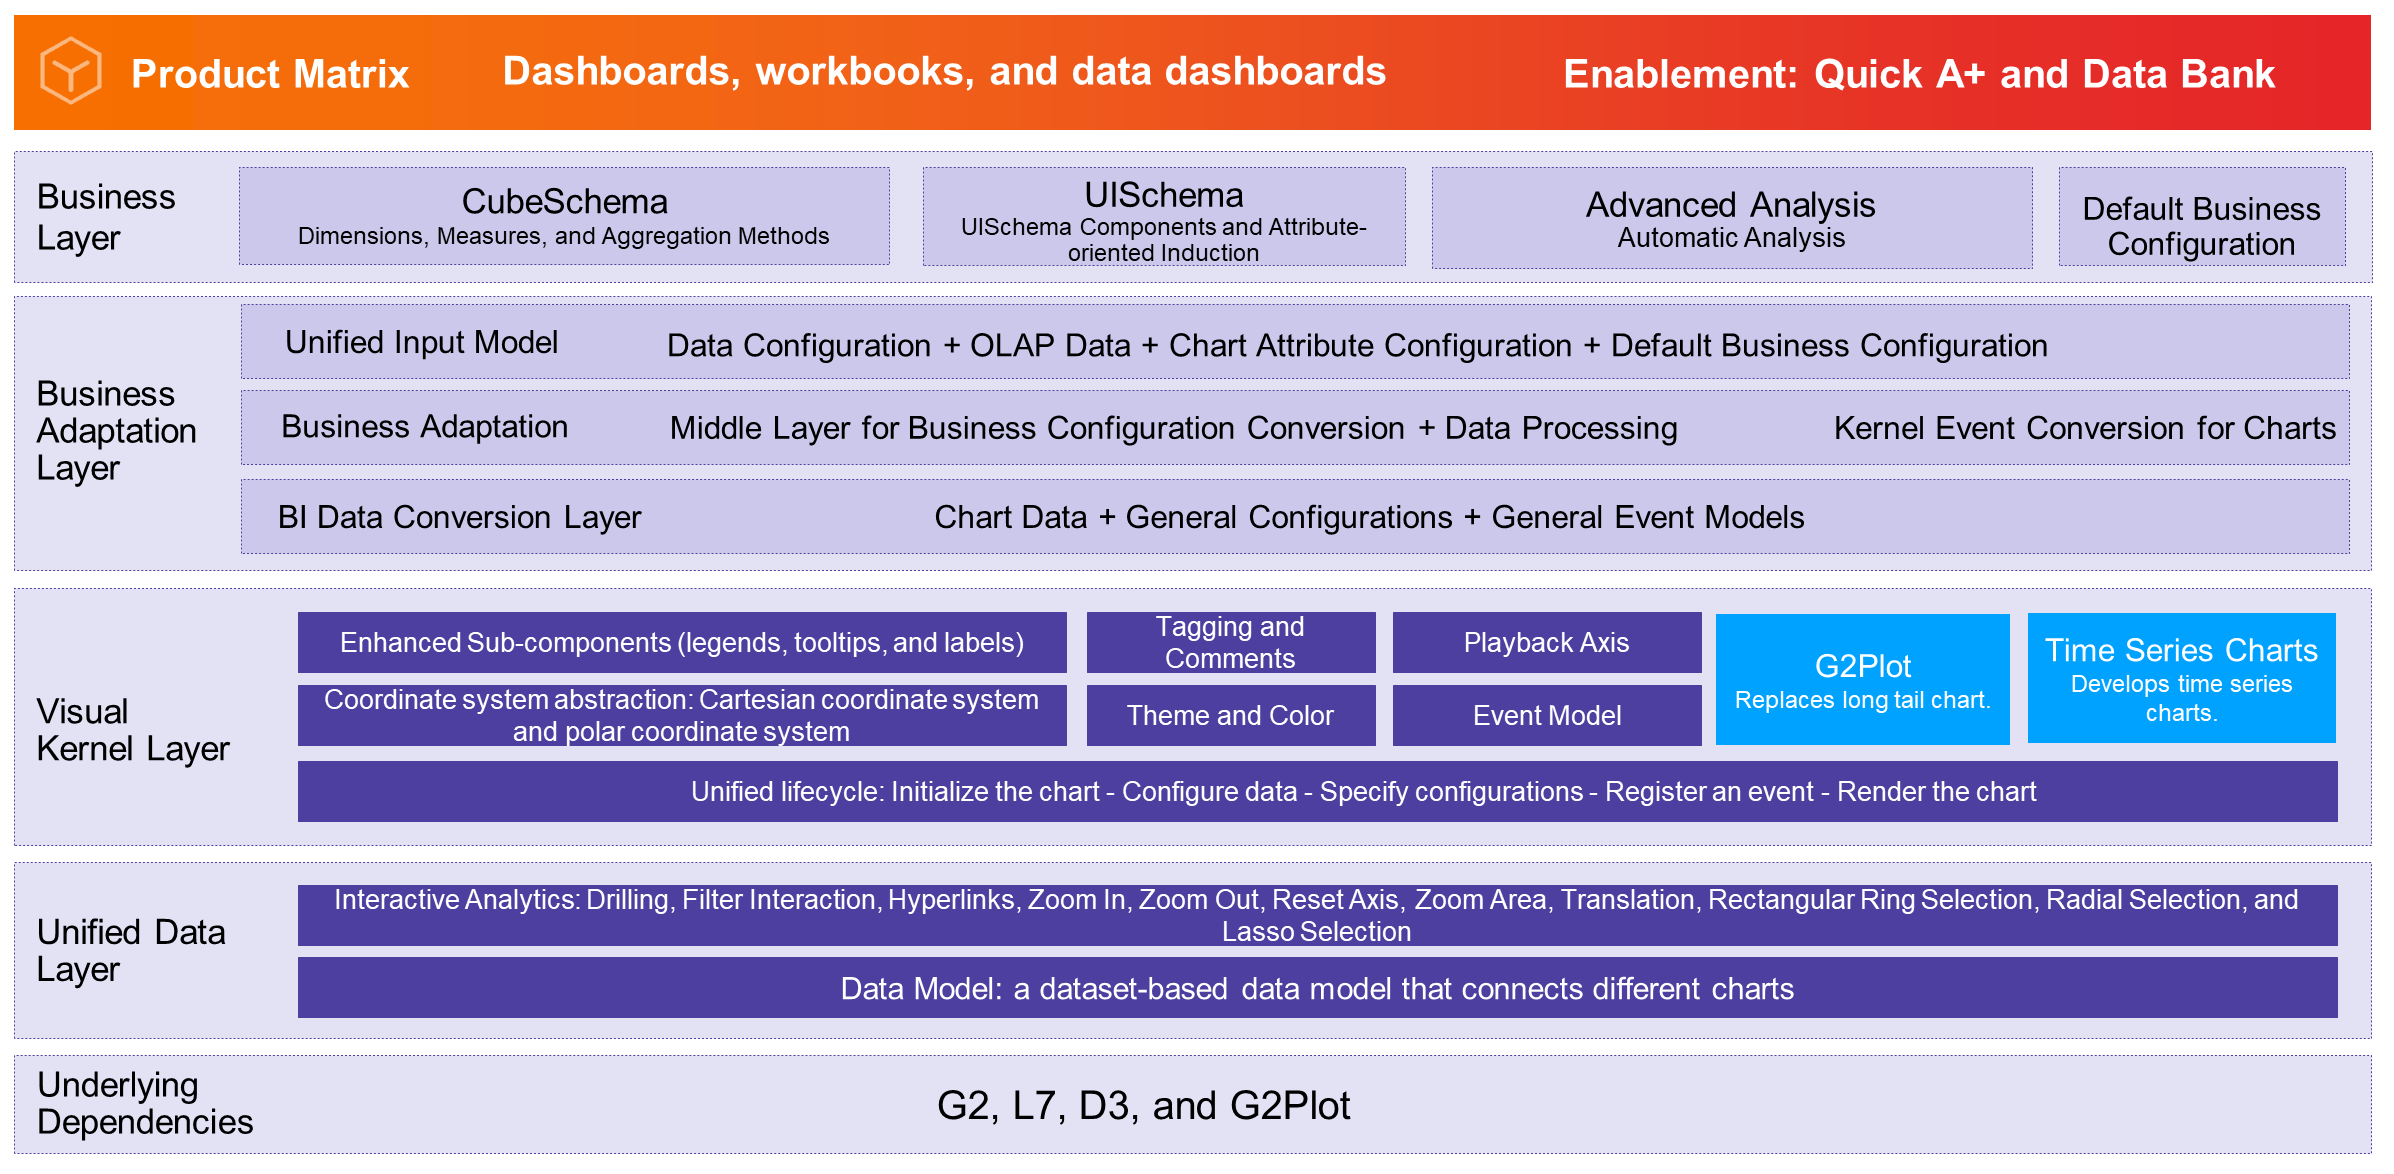
BI is applicable to a variety of visualization scenarios. Quick BI supports over 40 types of charts, including line charts, column charts, stacked area charts, bar charts, pie charts, Sankey diagrams, leaderboards, metric trend charts, and other scenario-based charts.
How to develop and extend these charts faster has long been the problem that we wanted to resolve. Therefore, we abstracted the common chart layer charts-bi to process data in a unified manner, manage default configurations of charts, handle limit cases of charts, and perform native rendering on sub-charts and subcomponents such as legends and tooltips. Although the underlying chart rendering layer is based on G2, our BI scenario-based charts are one of the most widely used G2 scenarios in Alibaba Group and we are also deeply involved in the co-construction of the visualization infrastructure.
After more than a year of hard work, 2019 Quick BI scored 4.7 points out of 5 points on data visualization in the Gartner Quadrant Report, surpassing Microsoft's Power BI and second only to Tableau. As the report shows, Quick BI is recognized for its outstanding data visualization capabilities. It supports rich chart types and Excel-like reports. It also provides specialized features for parameterized data acquisition and form-based write-back.

Intelligent visualization is a cross-border field. Automatic insight, visual design, and visual configuration recommendations are all developed are all parts of the development of intelligent visualization. Gartner predicts that enhanced analysis capabilities will define the future of data analytics. For common users, data insight is very costly. Users need to try to find regular metrics, and then verify or even discover rules by using a visualization method. This trial-and-error method results in high costs. Therefore, automatic insights can be considered as supplements to users' basic business insights.
Automatic insight can automatically analyze the characteristics of the datasets provided by a user, cleanse the data, automatically match the data based on insight types to find knowledge hidden in the datasets, and provide this knowledge to the user. As this pipeline is continuously optimized, the era of manual analytics will gradually give way to automatic insights. Then, users will be able to find the most effective information with a single keystroke.
In recent years, the trend of industry-university-research (IUR) integration has been remarkable. Microsoft's Power BI has made great achievements in this field. Having cooperated with Microsoft Research Asia (MSRA) to launch Quick Insight (QI), Microsoft is one of the pioneers of automatic insight. This year, our team has implemented the automatic insight feature on the internal BI tool, providing more intelligent data decision-making tools for business assistants.
In the future, the description of the real data world should not be static, but must really change. We need to present a pattern of change during the changes, but this feature is still lacking in modern data analytics. In the future, we will make more efforts in the areas of data storytelling and automatic insight. We will develop data visualization capabilities, taking them from static interactive analysis to dynamic interactive analysis. In addition, we will explore more effective information from the data to assist users in making decisions.
If BI and data visualization are tools that help you discover information from data, digital art is the medium that displays and spreads your data stories. Data dashboards, interactive devices, web pages, and rich media are all extensions of data visualization. We keep exploring more novel forms and forward-looking technologies to let you make your stories vivid and touching and stand out from the crowd.
Our team has closely cooperated with User Experience Design (UED) to design and develop dashboards and interactive display areas during Double 11 and at Pavilion 9 for many years. Our products have supported many senior receptions and external visits for the PR and GR departments of Alibaba Group and assisted BU teams to develop data visualization, BI, dashboards, display content, and propagation content.

In this process, we accumulated a set of solutions from data processing algorithms to the rendering engine, the visualization framework, and to the building platform.
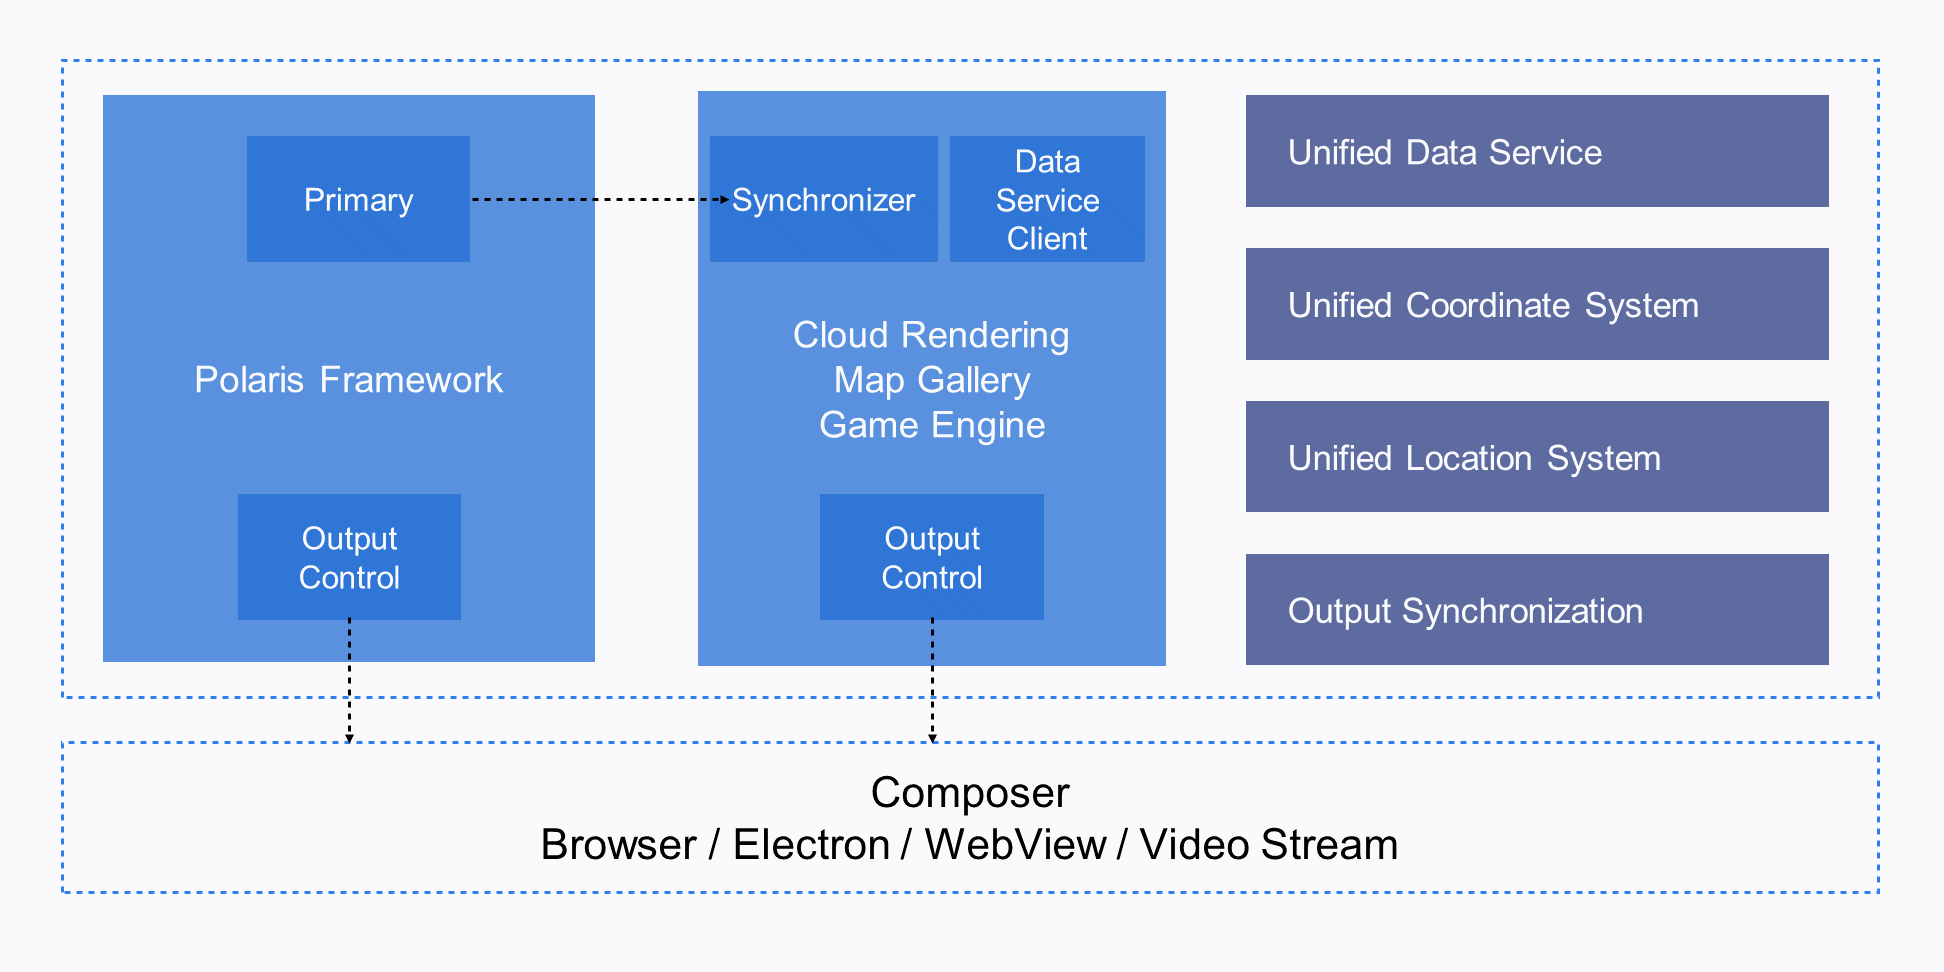
To meet the presentation requirements for different scenarios and content and give full play to the advantages of different rendering platforms, we added native support to cross-platform rendering in the rendering framework.
We used a unified set of data sources and data algorithms, unified geospatial specifications, and unified camera state definitions to ensure that the rendering results output by different rendering architectures are aligned. Then, we merged the content of different rendering architectures by providing real-time stream ingestion and WebView so that the content rendered and output by multiple platforms is merged.
Heterogeneous rendering allows us to integrate the real-time data visualization capabilities of Polaris, the detail production and rendering capabilities of UE4, the rich visualization tools at G2, and AMAP's massive map data into one piece of interactive real-time rendering content in a single scenario.
Web platforms always carry our core technologies and product forms regardless of the technology trends. We firmly believe that web platforms have untapped powerful performance. Due to the compromise in device performance and compatibility, users are used to considering 3D on Web as a "degraded solution" that only needs to be available. However, the application field of web technologies has undergone tremendous changes and infrastructure and hardware devices are constantly upgraded. Modern Web3D rendering engines should not always follow the game engines that were used ten years ago.
Our rendering technologies are always based on three.js, which indicates the JavaScript 3D library. This 3D library serves as a benchmark WebGL engine and its powerful community is supporting our rapid development. When we attempted to break down the restrictions of WebGL, we chose to keep all the upper-layer design and scenario definitions of three.js. We rewrote the rendering layer while ensuring compatibility with most APIs provided by three.js and plug-ins provided by the community. Ultimately, we implemented a WebGL2 engine with the most complete functionality at that time. In this way, the performance was significantly improved and we implemented large scenes where hundreds of millions of vertices were rendered in real time on a browser. In addition, we introduced the efficient general-purpose graphics processing unit (GPGPU) to implement particle animation, which is more complex.

From WebGL2 to underdeveloped WebGPU, the web 3D rendering capability is no longer limited by the graphics API, but is limited by the rendering pipeline and graphics algorithms. If you do not upgrade the rendering pipeline, upgrading the graphics API does not produce qualitative changes.
In 2019, we made a bold attempt to directly implement the high-definition rendering pipeline of a desktop game engine on WebGL2 and use it during the Double 11 Shopping Festival.
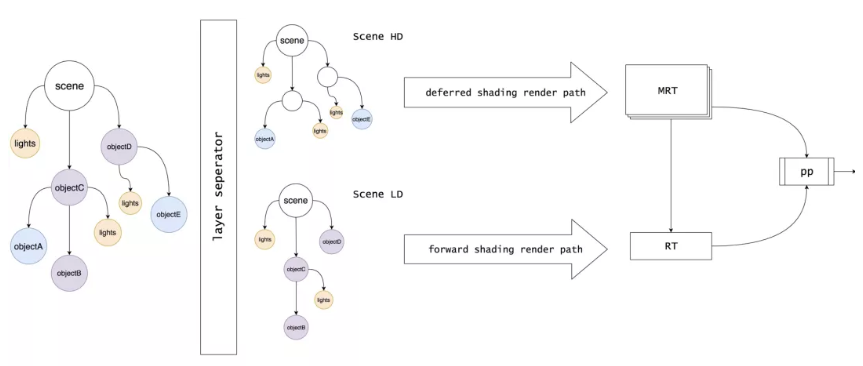
Referring to the rendering pipeline design of a mature game engine, we rendered different components of a scene by using multiple types of rendering paths. For materials that do not fully support deferred shading or incompatible existing components in the library, we perform pre-rendering or incomplete deferred rendering. In particular, we adopted the complete deferred shading pipeline in basic scenes. In the deferred shading pipeline, powerful performance control is implemented in the shading phase and the complete GBuffer unlocks many screen space algorithms. In this way, we can efficiently perform complex calculations such as Screen Space Ambient Occlusion (SSAO) and Screen Space Reflections (SSR) and even run the algorithms smoothly on notebook computers.

The HD rendering pipeline raises the web-based rendering capabilities to a new level, making it possible to introduce many new technologies. We can learn the strengths from the latest achievements in the academic, gaming, and film and television fields, instead of being limited by the ancient algorithms developed during the initial development period of the real-time rendering technologies. The HD rendering pipeline will also be the only rendering pipeline that is capable of exploring the potential of WebGPU in the future.
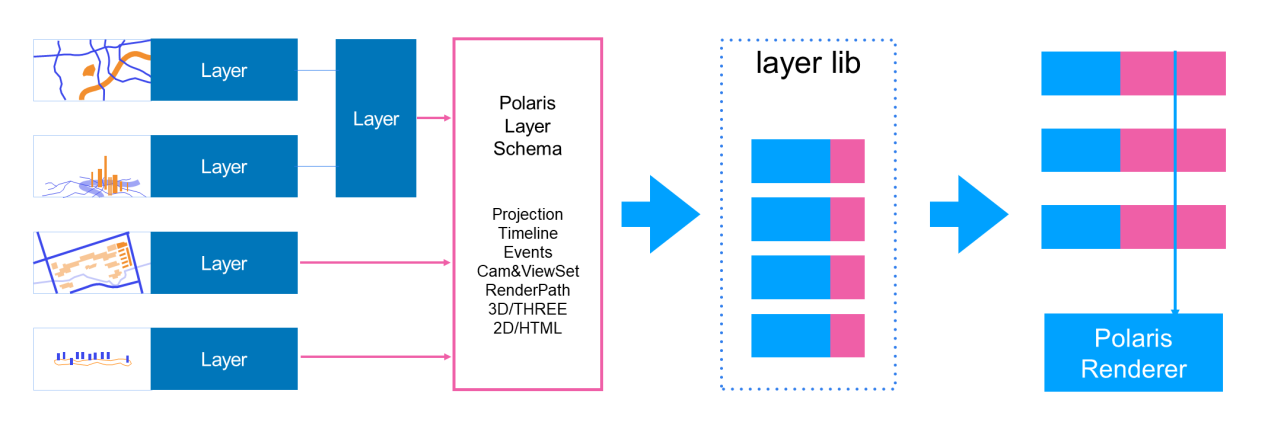
Although 3D data visualization scenarios are complex and scattered, most of them are closely related to geographic data. To improve development efficiency and service capabilities, we designed the lightweight geographic information system Polaris based on the general scenario definition of three.js. We simplified the development of all visual effects and business logic to layer development. You can freely overlay, combine, and inherit schema-compliant layers and then deliver the layers to be rendered by the Polaris renderer. We also developed a layer component library with hundreds of 3D components.
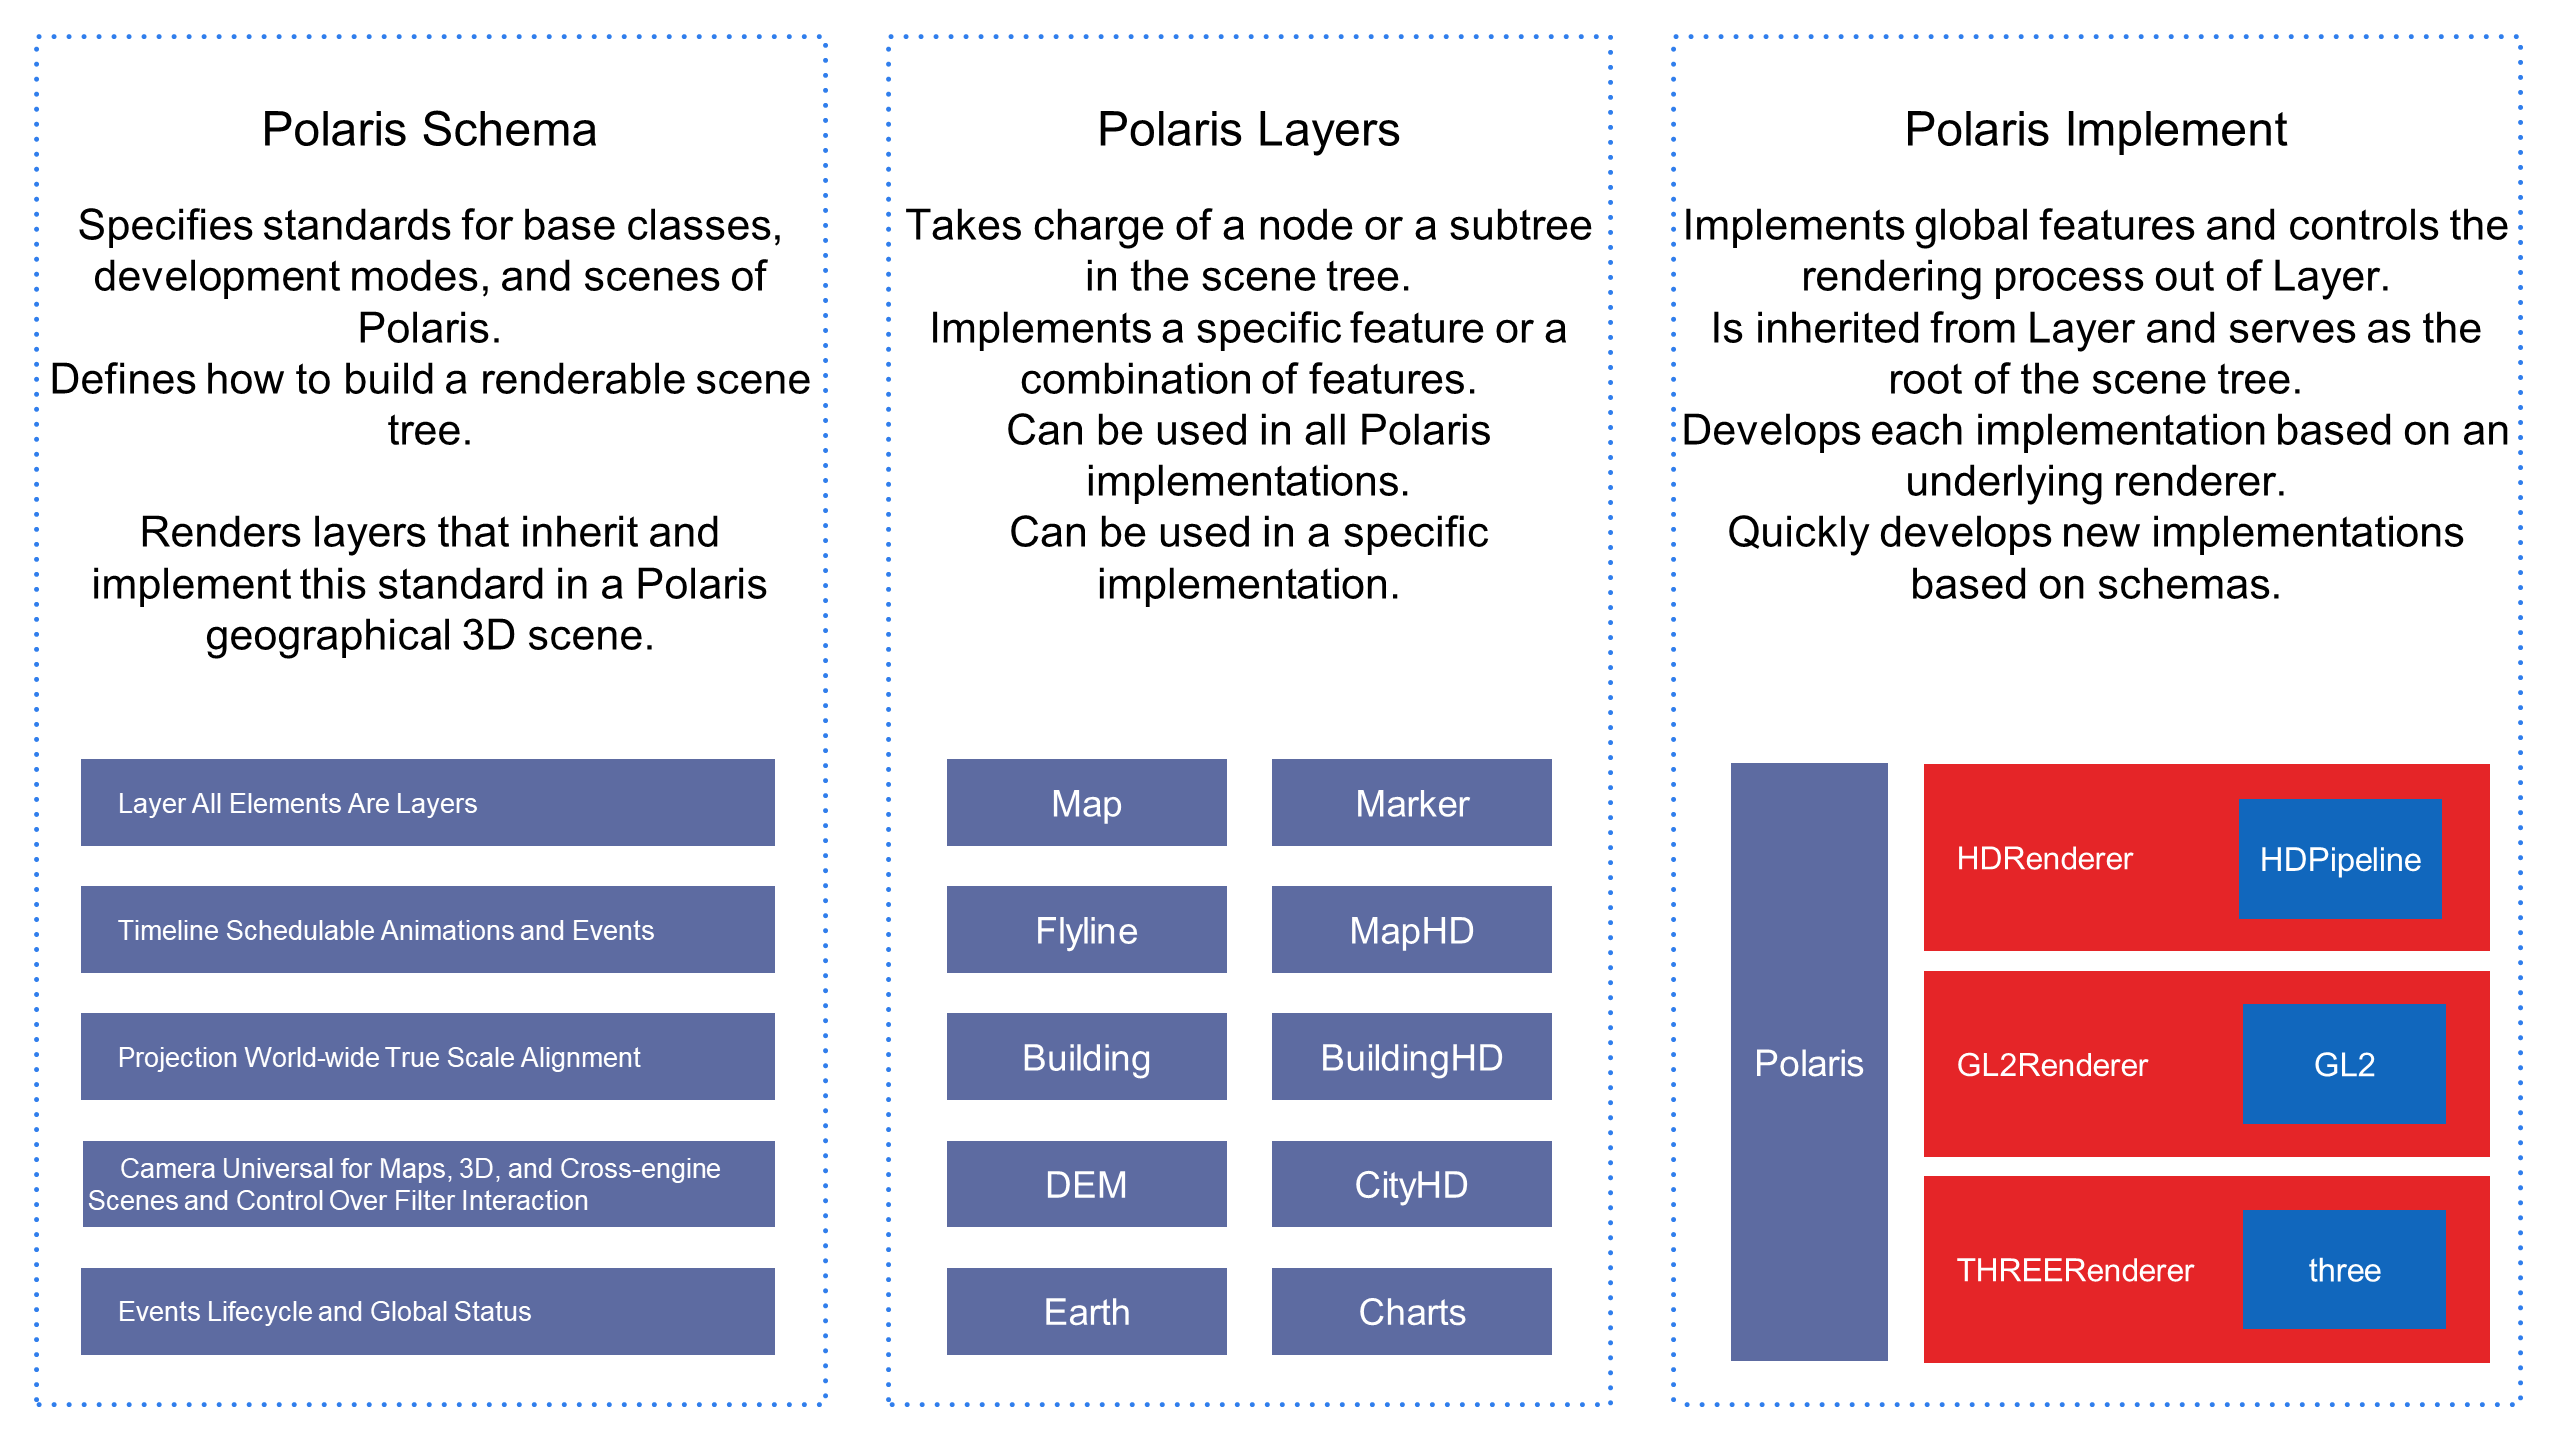
In Polaris, we built the world based on the real scale and geographical locations. As in Google Earth, you can draw 3D scenes from the galaxy to the earth, to a country or region, and then to the inside of a certain building in a certain city and then connect all the scenes by using a long shot, to form a coherent data story. The final result is anything but a separate chart in a PPT file.
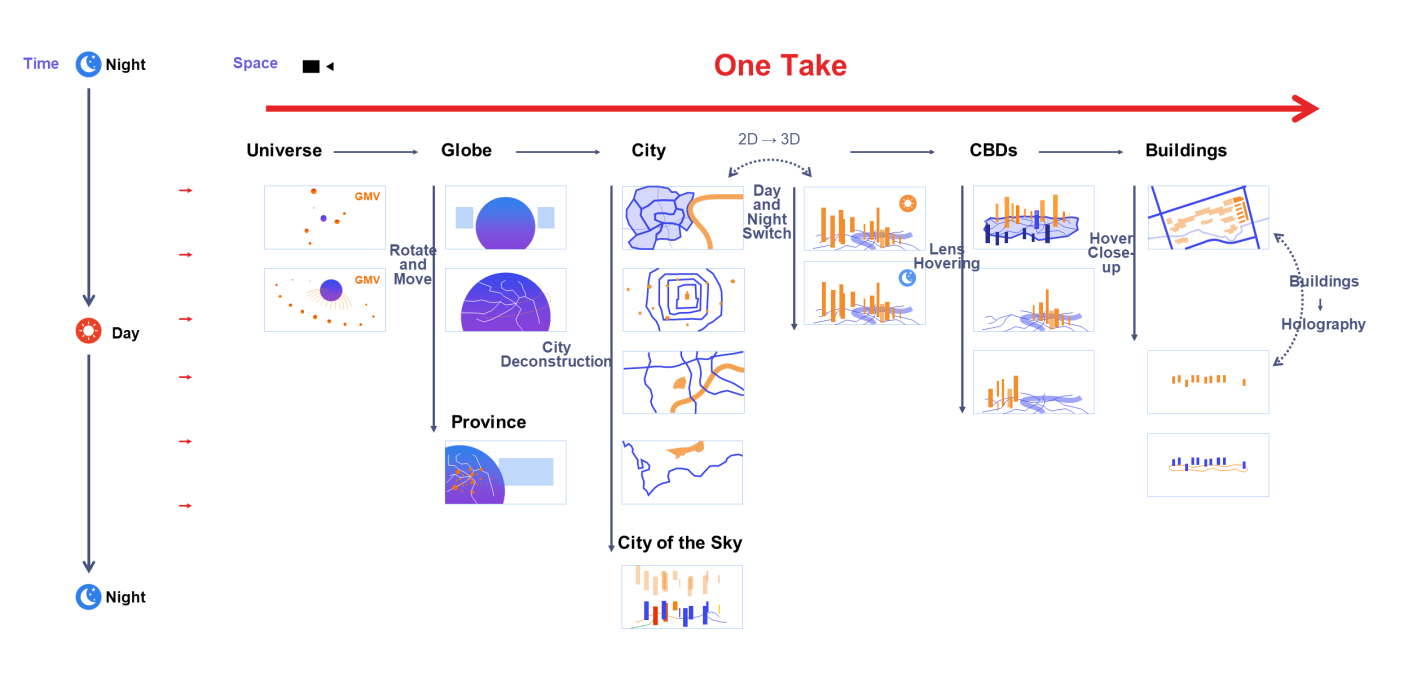

Building a 3D space means processing a large amount of raw geographic data layer by layer. The processing procedure often starts from the raw geographic data of AMAP. After the raw data is filtered, simplified, and elevated, a 3D model is formed. Then, the 3D model is refined and matched by using algorithms to generate architectural details. Terrains and elevations are generated based on the digital elevation model (DEM). For close-up areas, you need to manually make a high-precision model and then align the model with the geographic space by using algorithms. For urban landscapes, you can generate decorative content such as heavy traffic, billboards, and neon lights by using algorithms.
All these processes involve large amounts of data input and complex computing logic. We have generated scenario data for more than 30 cities and all provinces in different business scenarios. However, due to the constant changes in data sources and scenario building requirements, manual management will be a huge challenge for us. To address this issue, we built a geographic data algorithm service to provide equivalent services for UE4 and web rendering platforms.

Data products provide expressive data visualization capabilities and efficient data interpretation capabilities. However, they also incur various data security risks. The data may include transaction data or industry trend data. If such data is leaked and used by criminals, severe losses to Alibaba Group and customers may be caused. Therefore, security defense plans must be available in all production phases of data products.
For the entire data security system, the pipeline from data production to data query requires data masking and privacy differentiation. The frontend is the last phase in which a data product is displayed to users and interacts with users. The frontend is also the last phase of data security assurance in the entire production pipeline. We need to cooperate on building data security for the whole pipeline, ensuring that security is guaranteed before, during, and after events.
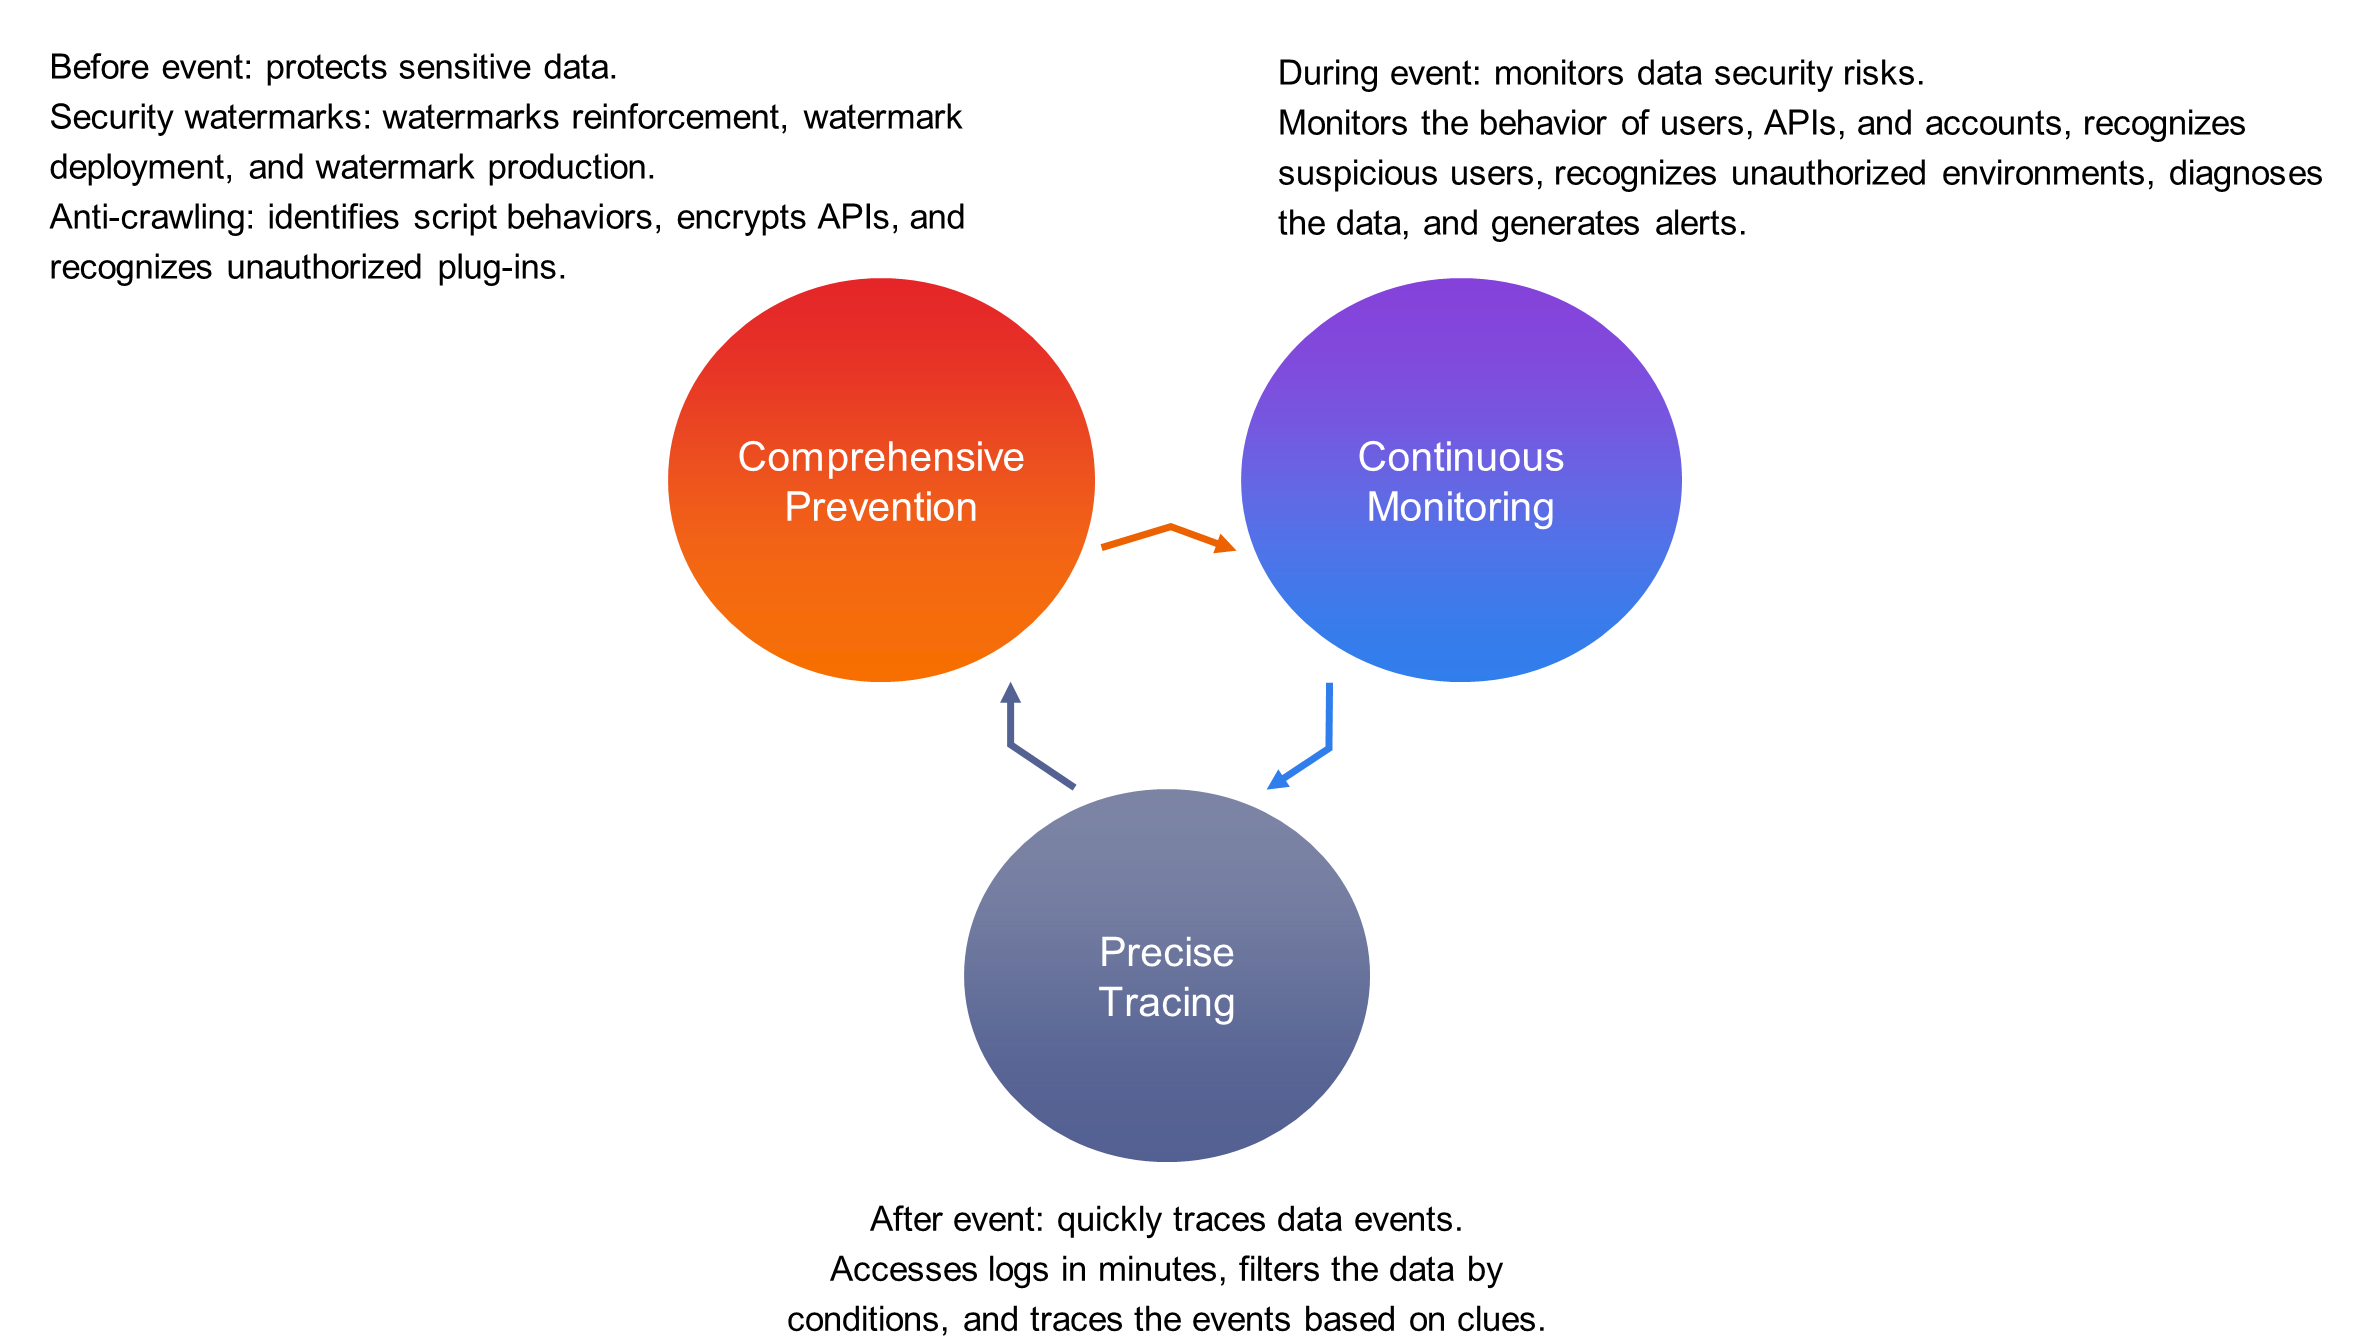
Digital watermarks play a role in warnings and deterrence, reminding visitors that the data displayed in the product is confidential information and cannot be spread. In addition, digital watermarks help trace a case afterward. After a visitor takes a screenshot of a page and propagates the screenshot, the watermark allows you to accurately pinpoint the person who is involved in the case, and assist in the detection of the case. The conventional webpage watermark scheme is to directly draw watermark information on the client to cover the document flow or use a watermark as the background. However, anyone with a little frontend knowledge can delete or even tamper with the watermark information by using a browser's debugger. To avoid this issue, we need to ensure the authenticity and stability of the watermark.
Watermarks are mainly produced in two ways. A plaintext watermark is a watermark image generated based on readable information such as the user name or warning information. This type of watermark primarily serves as a warning. An encrypted watermark is co-built by our team and security experts. It encrypts watermark information into image solutions of different forms. A typical encrypted watermark has integrated the principle of digital document watermarks. These encrypted watermarks include lattice watermarks, hidden watermarks, and emboss watermarks. This type of watermark cannot be tampered with and is mainly used to track cases.

Watermarks are encrypted in the production process and cannot be decrypted, which resolves the problem of watermark tampering. In the watermark deployment process, you need to protect your watermark from being deleted. We can defend against the following common watermark deletion methods:
1) Network intervention: Prevent pages from obtaining watermark resources, including images and SDKs. Obfuscate binary image streams and delivered SDK resources with business code to ensure that the watermark deployment and business logic execution occur concurrently and cannot be interrupted separately.
2) Environment and DOM intervention: Modify and delete the DOM to hijack and verify the DOM of the browser and key native APIs. This step ensures that modifications to the DOM can be listened to and restored. If the DOM cannot be restored, the business logic is interrupted.
3) Integrated deployment: For important data, render the data based on canvas or images instead of rendering the DOM. In this case, the data information and watermark information are merged into one atomic node and cannot be deleted separately.
4) Information differentiation: Deploy multiple watermark plans on the pages of each data product. Deploy both visible watermarks and invisible watermarks to ensure that unauthorized users cannot completely delete watermarks from the pages.
In addition to the preceding defense measures, we are also studying the production and deployment of new types of watermarks. We aim to strengthen watermarks and reduce the visual interference of watermarks on products in a more essential manner. Edge watermarks and lineage watermarks are the most feasible approaches. In particular, edge watermarks are produced and deployed on the client and the edge watermarks and page content are integrated in an intensified way.
For data products, monitoring is not only an important part of production security, but also a guarantee of data security. Monitoring usually focuses on JS errors and API errors. However, data products require monitoring of the data logic. For example, if real-time data suddenly shows a sharp drop in profits when a user is analyzing business data, the user may panic.

We have finished the infrastructure construction of the monitoring platform Clue and are carrying out vertical construction in many data scenarios:
Data disclosure always leads to the growth of a black market. Cybercriminals crawl data APIs by using third-party plug-ins and summarize and reverse the data without authorization. To provide a legal basis for cracking down on the black market, we need to check the browser environment of the products. In this scenario, we will add digital fingerprints to some native APIs and pinpoint unauthorized plug-ins by performing feature matching.
The timeliness and accuracy of alerts are the most important factors for the monitoring platform. In terms of data display, if some trend data for major customers drops to zero, a problem must have occurred. However, for some niche customers or industries, the decline in some metrics to zero may be a normal event. Therefore, we need to abstract multiple characteristics of metric information, industry information, and major promotion information and optimize the alerting model. We need to continuously optimize the alerting model by using the alert feedback mechanism and dynamically adjust the alert thresholds based on model prediction to gradually increase the accuracy of alerts.
Disclaimer: The views expressed herein are for reference only and don't necessarily represent the official views of Alibaba Cloud.
What Is Cloud Native and How to Design Cloud-native Architecture

2,593 posts | 791 followers
FollowNick Patrocky - February 5, 2024
Nick Patrocky - February 17, 2024
Lana - March 24, 2023
Shane Duggan - March 8, 2023
Neel_Shah - April 24, 2025
Alibaba Cloud Community - July 25, 2022

2,593 posts | 791 followers
Follow Big Data Consulting for Data Technology Solution
Alibaba Cloud provides big data consulting services to help enterprises leverage advanced data technology.
Learn More Big Data Consulting Services for Retail Solution
Alibaba Cloud experts provide retailers with a lightweight and customized big data consulting service to help you assess your big data maturity and plan your big data journey.
Learn More Security Center
A unified security management system that identifies, analyzes, and notifies you of security threats in real time
Learn More Data Lake Formation
An end-to-end solution to efficiently build a secure data lake
Learn MoreMore Posts by Alibaba Clouder