Quick BI interactive analysis lets you drill down, link, and jump across dashboard data to pinpoint issues and uncover correlations.
Function Introduction
Quick BI supports the following interactive features:
|
Interaction type |
Description |
|
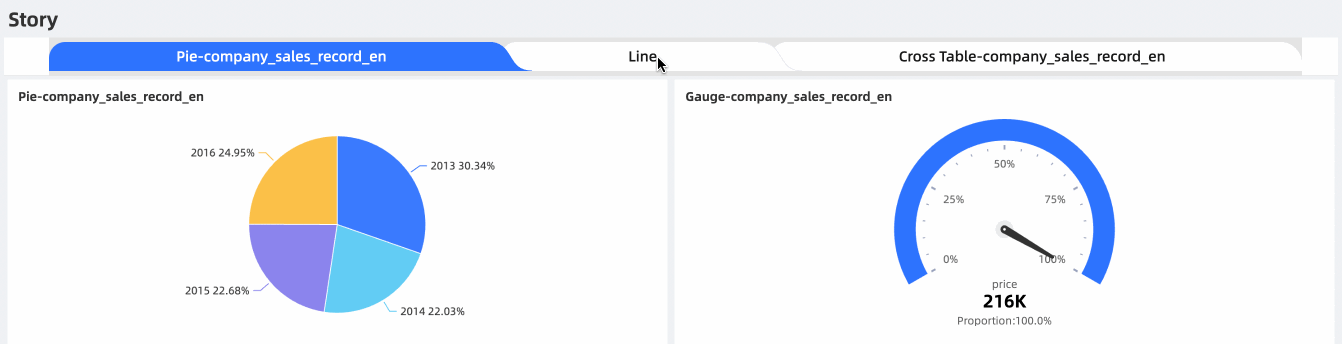
Story Builder presents dashboard charts as storylines, showing the overall analysis approach in a single report. For example, in a project that requires periodic attention, you can use Story Builder to add data views and insights for each stage, helping stakeholders track the latest status and trends. |
|
|
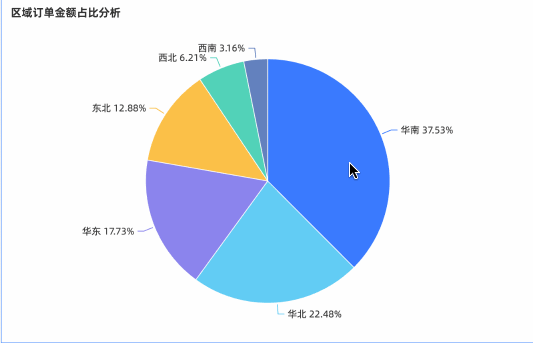
Analysts typically start from the high-level dashboard view to identify the direction of business problems, then drill down into detailed data to locate specific issues. For example, in a sales dashboard you can drill down by geographic dimension from area to province to view sales in each province. |
|
|
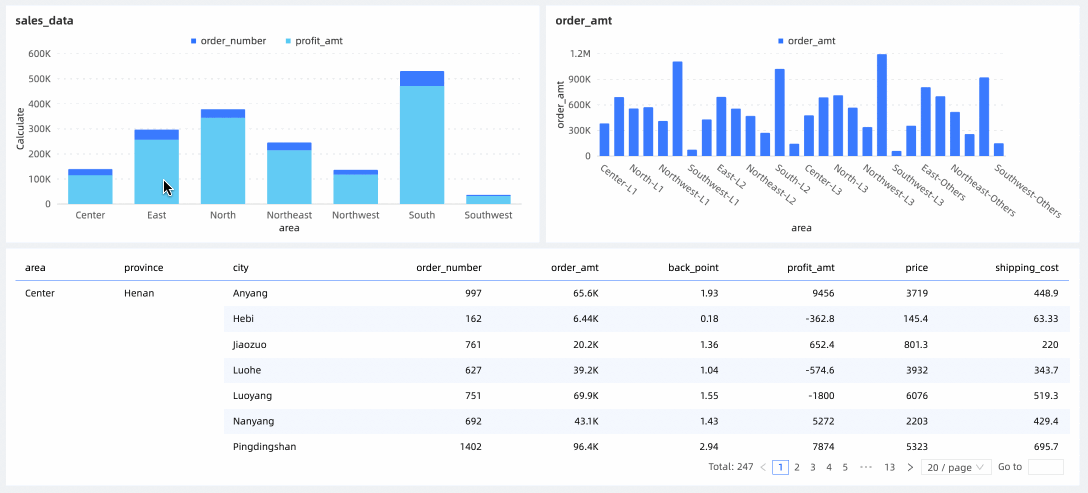
Linking dynamically updates one or more charts when you interact with or select conditions in another chart. For example, in a sales dashboard you can select the East China region on a map chart to link other charts and view related metrics such as sales and transportation costs. |
|
|
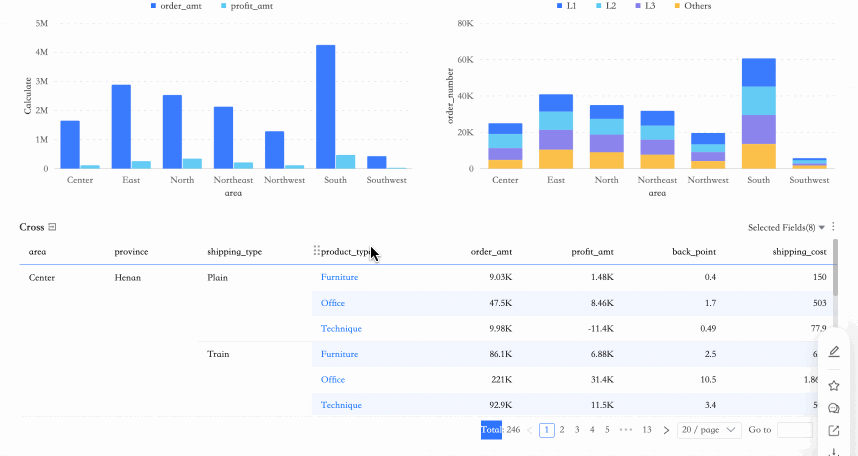
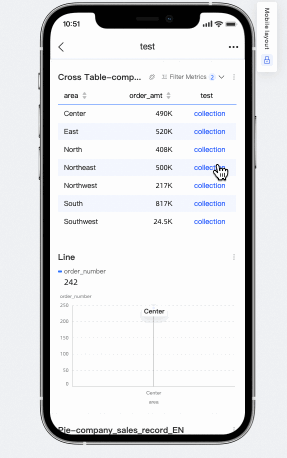
Click a data point in the current dashboard to navigate to another chart, dashboard, or external link for detailed information about that data point. For example, in a sales dashboard you can click office supplies to jump to the order profit details report, which then displays only orders with the product type of office supplies. |
|
|
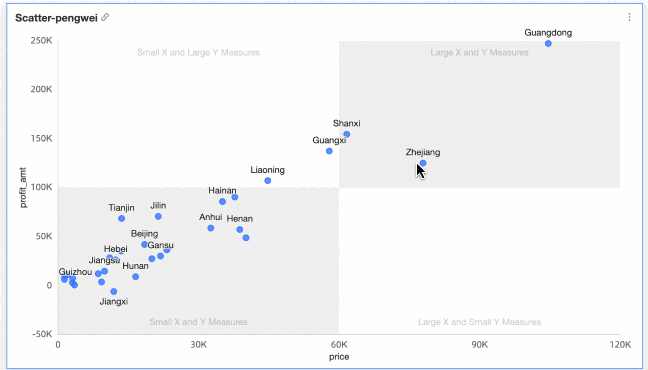
Circle selection lets you select multiple data points and cells at once for further analysis, such as view only, annotation, linking, and drilling down. For example:
|
|
|
Cross tables support data entry events. After you add a data entry event to a cross table, you can write data directly to the target database. |