By Zhizhen
The storage and query of time series data is critical in Prometheus-based monitoring practices, especially those with large-scale time series data, and there are many problems. The native Prometheus system does not provide a satisfactory answer to how to deal with long-period queries with large amounts of data. In response, ARMS Prometheus recently launched the downsampling function, attempting to solve this problem.
Prometheus and Kubernetes, as a pair of golden partners in the cloud-native era, are the standard configuration of many enterprise operating environments. However, to adapt to the development and evolution of business scale and microservices, the number of monitored objects will increase as well. In order to more completely reflect the status details of the system or application, the granularity of indicators is more detailed, and the number of indicators is increasing. In order to find trend changes in longer periods, the retention period of indicator data is bound to be longer. All these changes will lead to explosive growth in the amount of monitoring data, which puts immense pressure on the storage, query, and calculation of observation products.
We can take an intuitive look at the consequences of this data explosion through a simple scene. For example, suppose we need to query the changes of CPU usage on each node of my cluster in the past month. When my cluster is a small-scale cluster with 30 physical nodes, with each node running an average of 50 PODs that need to collect indicators, we need to process a total of 3050 = 1500 collection targets according to the default 30-second collection interval. However, each sampling point will be captured 606024/30 = 2880 times a day. There will be 1500 2880 30 =130 million times of index capture in a month's cycle. Let’s take Node exporter as an example. The number of samples captured and spit out by a bare metal machine is about 500, so there will be about 130 million 500 = 65 billion sampling points generated by this cluster in a month. However, in real business systems, the situation is often not ideal, and the actual number of sampling points often exceeds 100 billion.
In order to deal with this situation, we must have some technical means to optimize the cost and efficiency of storage/query/calculation while ensuring the accuracy of the data as much as possible. Downsampling is one of the representative ways to go.
The premise of downsampling is that the data processing conforms to the associative law, and the merging of the values of multiple sampling points does not affect the final calculation result. The time series data of Prometheus conforms to this feature. In other words, downsampling means reducing the resolution of data. The idea is straightforward. If the data points within a certain time interval are aggregated into one or a group of values based on certain rules, the sampling points are reduced, the amount of data is reduced, and the pressure of storage query calculation is reduced. So, we need two inputs: time interval and aggregation rules.
For the time interval of downsampling, based on empirical analysis, we delineate two different downsampling time intervals: five minutes and one hour. If you add the original data, you will get data with three different resolutions and automatically route query requests to data with different resolutions based on query conditions. As ARMS Prometheus provides longer storage duration options in the future, we may add new time interval options.
For aggregation rules, various operator functions can be summarized into six types of numerical calculations through the analysis of Prometheus's operator functions:
Therefore, for a series of sampling points in a time interval, we only need to calculate the aggregation feature values of the six types above and return the aggregation values of the corresponding time interval when querying. If the default scape interval is 30 seconds, the five-minute downsampling method aggregates ten points into one point. The one-hour downsampling method aggregates 120 points into one point. Similarly, the number of sampling points involved in the query decreases by order of magnitude. If the scape interval is smaller, the effect of reducing the sampling points is significant. On the one hand, the reduction of sampling points reduces the reading pressure of TSDB. On the other hand, the calculation pressure of the query engine decreases simultaneously, thus effectively reducing the query time.
For other open-source/commercial time series data storage implementations, some of them have optimized and improved long-time span queries through the downsampling function. Let's learn about it.
The storage capability of open-source Prometheus has always been criticized. The open-source Prometheus does not directly provide the downsampling capability. However, it provides the Recording Rule capability. Users can use the Recording Rule to implement DownSampling. However, this will generate a new timeline. The storage pressure is increased further in high-base scenarios.
As a well-known high-availability storage solution for Prometheus, Thanos provides a comprehensive downsampling solution. The component that executes the downsampling function in Thanos is the compactor, which will:
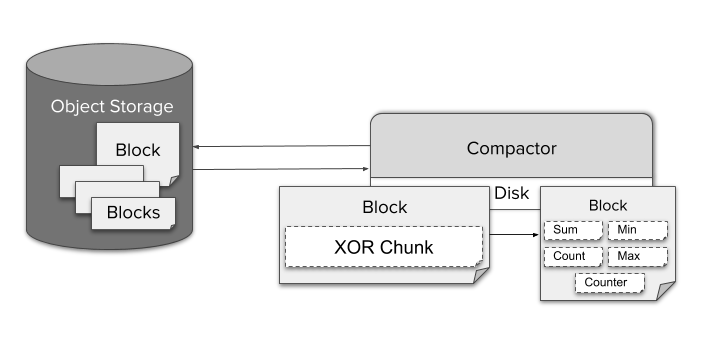
The eigenvalues after downsampling include sum/count/max/min/counter and are written to special aggrChunks data blocks. When making a query:
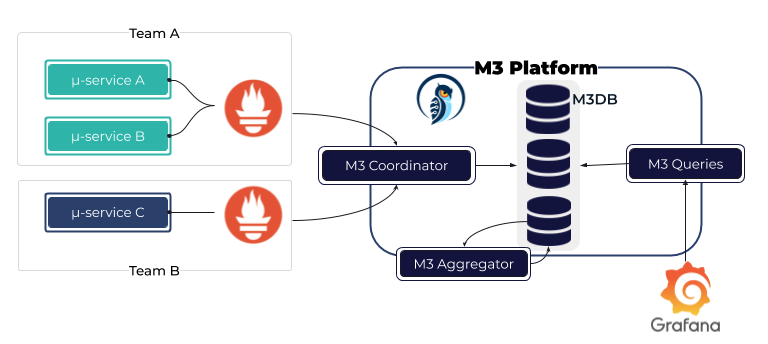
The M3 Aggregator is responsible for streaming aggregate metrics before they are stored in M3DB and specifies the storage duration and sampling interval of the calculation window based on storagePolicy.
M3 supports flexible data intervals and more feature values, including histogram quantile functions.
Victoria Metrics has only launched the downsampling function in the commercial version, but the open-source version has not been revealed. The open-source version of InfluxDB (earlier than v2.0) uses the Recording Rule method to downsample raw data that has already been downloaded by executing continuous queries outside the storage medium. Context does not support downsampling.
ARMS Prometheus processes TSDB storage blocks. The backend automatically processes raw data blocks into downsampled data blocks. On the one hand, ARMS Prometheus achieves better processing performance. On the other hand, it does not need to care about parameter configuration rules and maintenance for end users. This reduces the O&M burden as much as possible.
This feature has been launched in some regions of Alibaba Cloud and has started the targeted invitation experience. This feature will be integrated and provided by default in the upcoming ARMS Prometheus Advanced Edition.
After we have completed the downsampling at the sampling point level, has the long-term query problem been solved? No. Only the most primitive materials are stored in TSDB, and the curves seen by users need to be calculated and processed by the query engine. We are faced with at least two problems in the process of calculation and processing.
Regarding the first question, ARMS Prometheus intelligently selects an appropriate time granularity based on users' query statements and filter conditions to balance data details and query performance.
Regarding the second question, we can conclude that the density of collection points has a huge impact on the result calculation. However, ARMS Prometheus shields the differences at the query engine level, and users do not need to adjust PromQL. This impact is mainly reflected in three aspects: the impact between the duration of the query statement, the impact between the step of the query request, and the impact on the operator. We will explain the impact of these three aspects and the work done by ARMS Prometheus in these three aspects.
We know that during the query of an interval vector in PromQL, a time duration parameter is included to frame a time range for calculation results. For example, in the query statement http_requests_total{job="prometheus"}[2m], the specified duration is two minutes. When calculating the result, the queried time series is divided into several vectors every two minutes, which later are passed to the function for calculation, and the results are returned separately. Duration directly determines the input parameter length that can be obtained during function calculation, and its influence on the result is clear.
In general, the interval between collection points is 30s or less. As long as the time duration is greater than this value, we can determine that there will be several samples in each divided vector for calculation results. After downsampling, the data point interval becomes larger (five minutes or even one hour). At this time, there may be no value in the vector, which leads to intermittent function calculation results. As such, ARMS Prometheus automatically adjusts the time duration parameter of the operator to ensure the duration is no less than the downsampling resolution. Each ventor has a sampling point to ensure the accuracy of the calculation result.
The duration parameter determines the length of the vector during PromQL calculation, while the step parameter determines the step of the vector. If the user is querying on Grafana, the step parameter is calculated by Grafana based on the page width and query time span. Take my personal computer as an example. The default step is ten minutes when the time span is 15 days. For some operators, since the density of sampling points decreases, the step may also cause the calculation result to change. The following is a brief analysis, using taking increment as an example.
In normal cases (the sampling points are uniform, and no counter is reset), the calculation formula of the increase can be simplified to (end value - start value) x duration /(end timestamp - start timestamp). For general scenarios, the interval between the first/last point and the start/stop time does not exceed the scrape interval. If the duration is much larger than the scrape interval, the result is approximately equal to (end value - start value). Let’s assume there is a set of downsampled counter data points:
sample1:    t = 00:00:01   v=1
sample2:    t = 00:59:31   v=1
sample3:    t = 01:00:01   v=30
sample4:    t = 01:59:31   v=31
sample5:    t = 02:00:01   v=31
sample6:    t = 02:59:31   v=32
...
Let’s assume the query duration is two hours, and the step is ten minutes We will obtain the split vector below:
slice 1:  Starting and ending time 00:00:00 / 02:00:00  [sample1 ...  sample4]
slice 2:  Starting and ending time 00:10:00 / 02:10:00  [sample2 ...  sample5]
slice 3:  Starting and ending time 00:20:00 / 02:20:00  [sample2 ...  sample5]
...
In the original data, the interval between the start-end point and the start-end time does not exceed the scrape interval. In the data after downsampling, the interval between the start-end point and the start-end time can reach the maximum (duration - step). If the value of the sampling point changes smoothly, the calculation result after downsampling will not be significantly different from the calculation result of the original data. However, if the median value in a slice interval changes sharply, the change will be enlarged according to the calculation formula above (end value - start value) x duration/ (end timestamp - start timestamp) so that the final displayed curve fluctuates more drastically. This result is considered normal, and irate is applicable in scenarios where indicators change dramatically (fast-moving counter), which is consistent with the recommendations in the official documentation.
The calculation results of some operators are directly related to the number of samples. The most typical one is count_over_time, which counts the number of samples in the time interval, and downsampling will reduce the number of points in the time interval. Therefore, this situation requires special processing in the Prometheus engine. When downsampling data is found to be used, new computational logic is taken to ensure the correct result.
Users can feel an increase in query speed, but we need to compare two queries to see how much it increases.
The test cluster has 55 nodes and a total of 6000 + pods. The total number of sample points reported per day is about 10 billion, and the data storage period is 15 days.
The following statement can be used to query data:
sum(irate(node_network_receive_bytes_total{}[5m])*8) by (instance)The network traffic received by each node in the cluster is queried. The query period is 15 days.
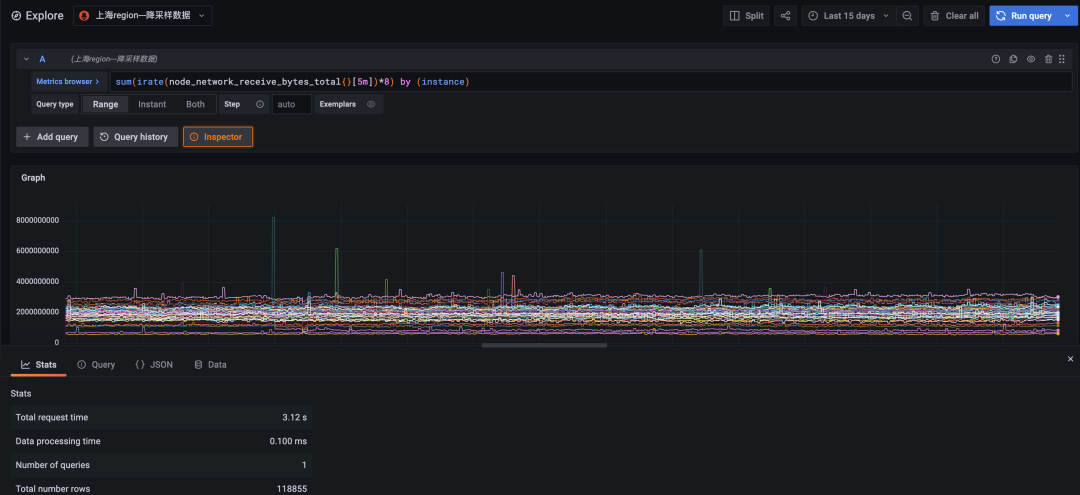
Figure 1: Downsampling data query, a time span of 15 days, and query time 3.12 seconds

Figure 2: Raw data query, a time span of 15 days, and query timeout (timeout by 30 seconds)
The original data cannot be returned because the calculation times out since the amount of data is too large. The downsampling query is at least ten times more efficient than the original query.
The following statement can be used to query data:
max(irate(node_network_receive_bytes_total{}[5m])*8) by (instance)Query the traffic data of the network interface controller that receives the largest amount of data on each node:
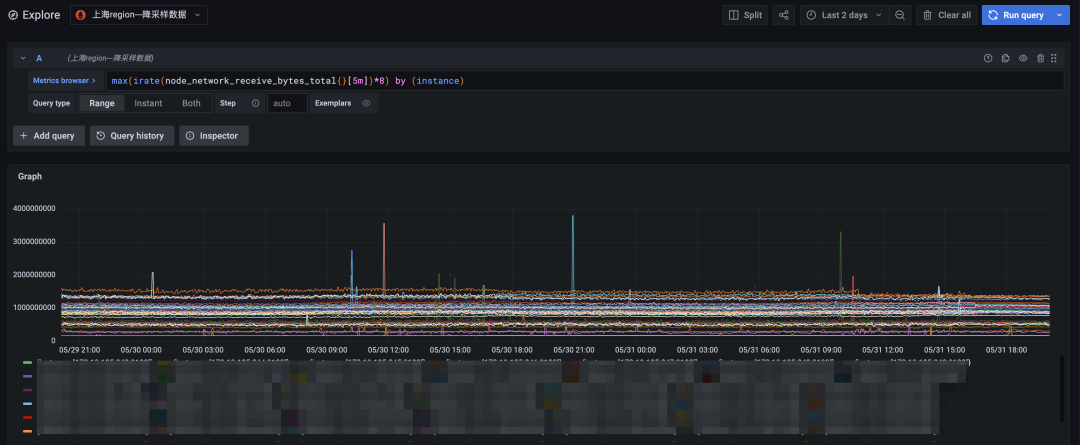
Figure 3: Downsampling query and a time span of two days
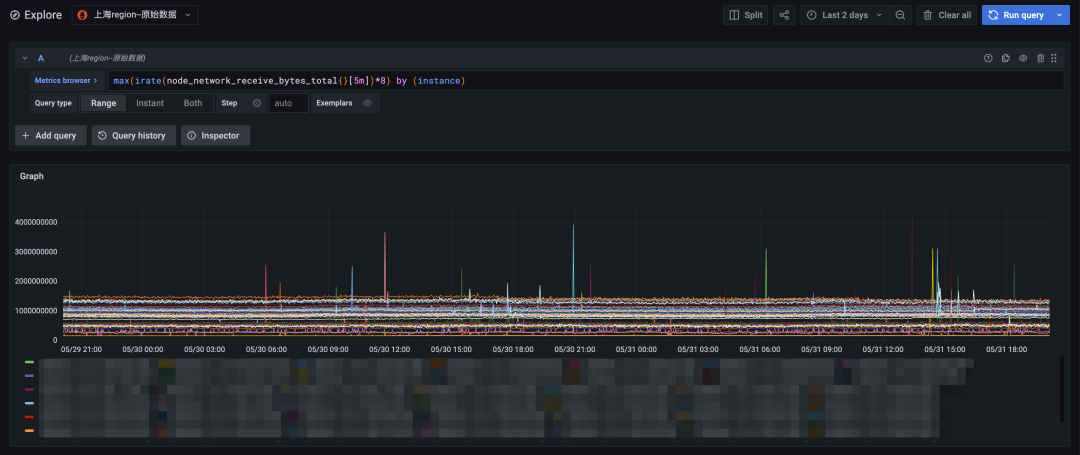
Figure 4: Raw data query and a time span of two days
In the end, we shortened the query time span to two days, and the original data query could also be returned quickly. Comparing the downsampling query results (above) and the original data query results (below), we can see that the number of timelines and the overall trend of the two are the same. The points with severe data changes can also be matched, well which can fully meet the needs of long-term queries.
Alibaba Cloud officially released the Alibaba Cloud Observability Suite (ACOS) on June 22, 2022. It focuses on the Prometheus service, Grafana service, and Tracing Analysis service to form an observable data layer that integrates metric storage and analysis, link storage and analysis, and heterogeneous data sources. It uses standard PromQL and SQL to provide dashboard display, alerting, and data exploration capabilities, giving data value to different scenarios (such as IT cost management, enterprise risk governance, intelligent O&M, and business continuity assurance), so observable data can do something more beyond observability.
Among them, Alibaba Cloud Prometheus Monitoring has introduced various targeted measures (such as global aggregate query, streaming query, downsampling, and pre-aggregation) for extreme scenarios )such as multiple instances, large data volumes, high timeline cardinality, long time span, and complex queries). You are welcome to try it out.
Java Agent Exploration – appendToSystemClassLoaderSearch Problems
KubeVela Brings Software Delivery Control Plane Capabilities to CNCF Incubator

480 posts | 48 followers
FollowDavidZhang - January 2, 2024
Alibaba Cloud Storage - April 25, 2019
Alibaba Cloud Storage - May 8, 2019
Alibaba Clouder - May 27, 2019
Alibaba Clouder - July 31, 2019
Alibaba Cloud Native Community - February 13, 2023

480 posts | 48 followers
Follow Application Real-Time Monitoring Service
Build business monitoring capabilities with real time response based on frontend monitoring, application monitoring, and custom business monitoring capabilities
Learn More Content Moderation
Image and video moderation service that accurately detects inappropriate content.
Learn More Real-Time Livestreaming Solutions
Stream sports and events on the Internet smoothly to worldwide audiences concurrently
Learn More Managed Service for Prometheus
Multi-source metrics are aggregated to monitor the status of your business and services in real time.
Learn MoreMore Posts by Alibaba Cloud Native Community