
Observability has been a popular topic in recent years. It focuses on innovating businesses using large amounts of diverse data (such as Log, Trace, Metric). To support data innovation, a stable, powerful, and inclusive storage and computing engine is crucial.
In the industry, various solutions (like ES for Log, ClickHouse for Trace, Prometheus for Metric) are used for unified observability. However, SLS introduces a unified architectural design for all observable data at the data engine level. In 2018, we released the first version of PromQL syntax support based on the Log model, confirming its feasibility. Subsequently, we redesigned the storage engine to achieve unified storage of Log, Trace, and Metric in one architecture and process.
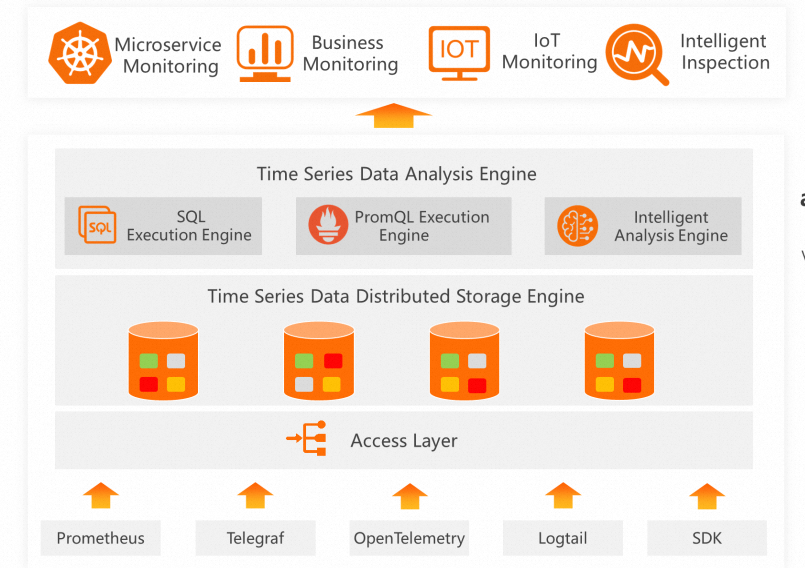
This article introduces the recent technical updates to the Prometheus storage engine of Simple Log Service (SLS). Compatible with PromQL, the Prometheus storage engine achieves a performance improvement of more than 10 times.
With a growing number of customers and large-scale applications like ultra-large-scale Kubernetes cluster monitoring and high-QPS business platform alerting, there is an increasing demand for higher overall performance and resource efficiency in SLS time series storage. These requirements can be summarized as follows:
To meet these requirements, we have implemented various optimizations to the overall solution of the Prometheus time series engine over the past year. These optimizations have resulted in a tenfold improvement in query performance and overall cost reduction.
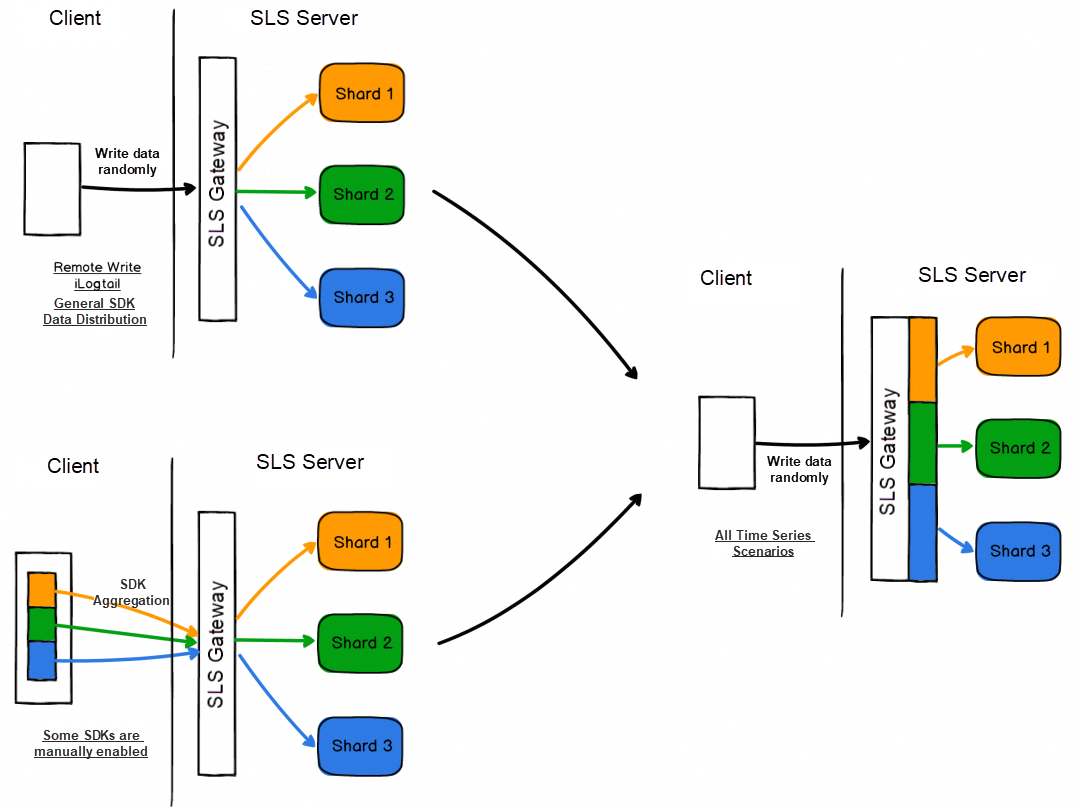
Due to the highly aggregated nature of time series data, storing data from the same timeline in one shard can result in highly efficient compression. This leads to significant improvements in storage and read efficiency.
Initially, users were required to aggregate data by time series using the SLS Producer on the client side and then specify a Shard Hash Key to write data to a specific shard. However, this approach demanded high computing and memory capabilities on the client, making it unsuitable for methods like RemoteWrite and iLogtail. As the online usage of iLogtail, RemoteWrite, and data distribution scenarios increased, it led to lower overall resource efficiency of SLS clusters.
To address this issue, we have implemented an aggregation writing solution for all MetricStores on the SLS gateway. Clients no longer need to use the SDK for data aggregation (though the current SDK-based aggregation writing is not affected). Instead, data is randomly written to an SLS gateway node, and the gateway automatically aggregates the data to ensure that data from the same time series is stored on one shard. The following table compares the advantages and disadvantages of client SDK aggregation writing and SLS gateway aggregation writing.
| Client SDK aggregation | SLS gateway aggregation | |
| Client load | High | Low |
| Configuration method | The aggregated buckets are statically configured. If the number of split shards exceeds the number of buckets, an adjustment needs to be made. | No configuration is required. |
| Shard splitting | The hash range must be balanced after each shard is split. Otherwise, data is written unbalancedly. | No operations are needed. All shards are automatically balanced. |
| Aggregation policy | The client can perform aggregation based on time series features such as instancelD. | Not sensitive to time series features. Perform unified aggregation based on metric names and labels. |
| Query policy | Able to be optimized based on aggregation features. For example, if the instancelD of a query is known, a specific shard can be queried. | Not sensitive to query policies. All shards are queried by default. |
As shown in the table above, SLS gateway aggregation writing has certain disadvantages in specific query policies compared to client SDK control. However, this only applies to a small number of users who have high QPS requirements (such as tens of thousands of QPS). In most scenarios, global queries do not affect performance.
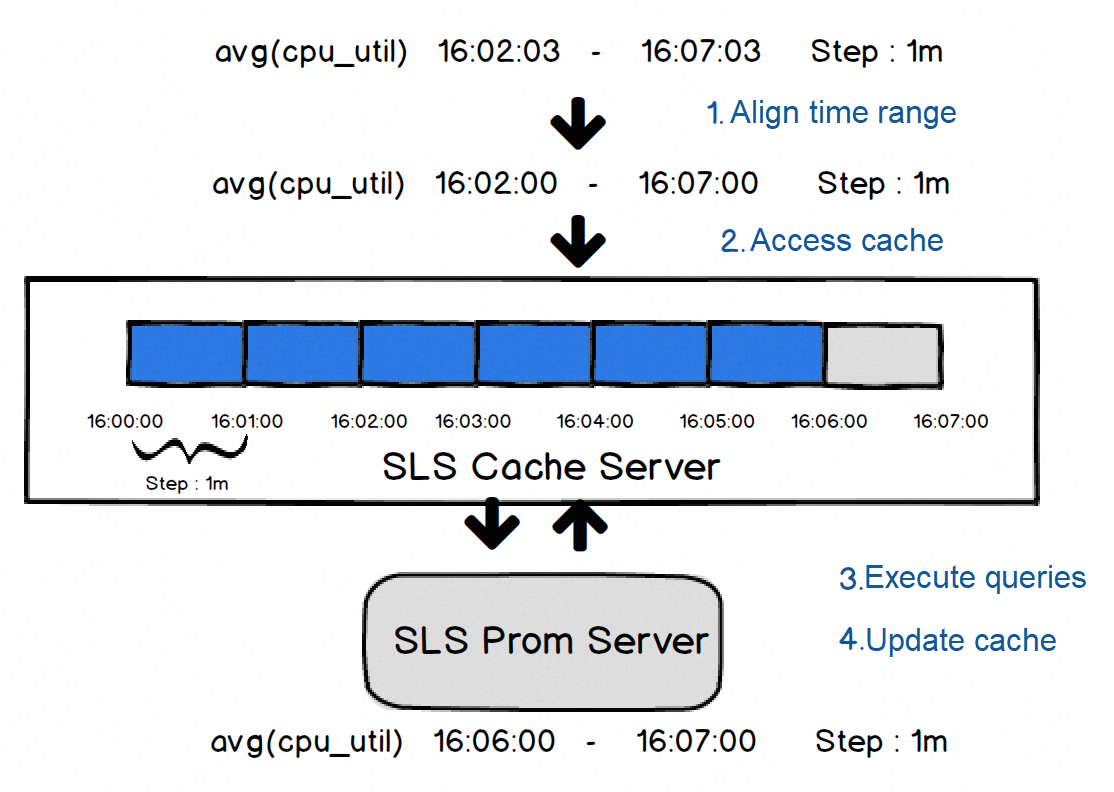
Dashboard is a critical application in time series scenarios and often experiences high query stress. In scenarios like stress testing, large-scale promotions, and troubleshooting, multiple users may access a dashboard simultaneously. In situations where multiple users access hotspots, caching becomes crucial. However, in PromQL, each request is precise to seconds or milliseconds, and the PromQL logic searches for data from the exact time of the request at each step of computation. Caching the calculation results directly would have little impact, even on requests initiated within one second.
To address this issue, we attempt to align the range of PromQL queries based on the step. By doing so, the internal results of each step can be reused, significantly improving the cache hit rate. The overall policy is as follows:
It is important to note that this method has been modified to some extent compared to standard PromQL behavior. However, in actual tests, aligning the range has little effect on the result. Enabling this method based on MetricStore configuration or specific requirements (such as URL Param control of the request) is supported.
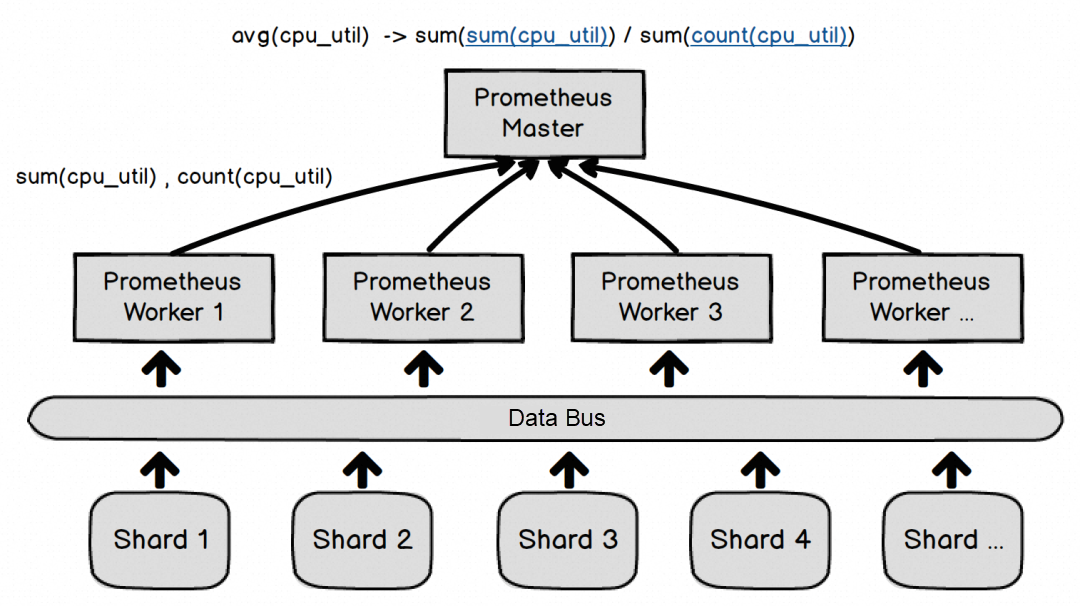
In the open-source Prometheus, PromQL computation is done in a standalone and single coroutine manner. This approach is more suitable for small business scenarios. However, as the cluster grows larger, the number of time series involved in the computation process increases significantly. In such cases, the standalone computation of a single coroutine is not sufficient to meet the requirements (for a time series of hundreds of thousands, a query spanning several hours would usually experience delays of more than 10 seconds).
To address this issue, we introduce a layer of parallel computing architecture to the PromQL computational logic. In this architecture, the majority of the computing workload is distributed to worker nodes, while the master node only aggregates the final results. Additionally, computing concurrency is decoupled from the number of shards, allowing storage and computing to scale independently. The overall computational logic is as follows:
Not all queries support parallel computing due to the nature of PromQL, and not all queries that support it can guarantee good results. However, based on our analysis of actual online requests, more than 90% of queries can support parallel computing and achieve acceleration.
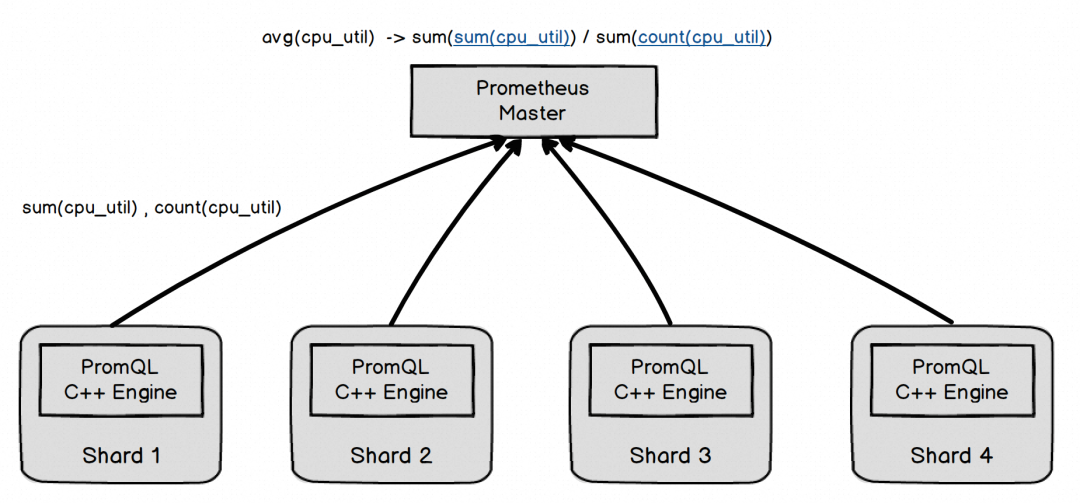
The previous parallel computing solution solves the issue of computing concurrency. However, for storage nodes, the amount of data sent to computing nodes remains the same whether the computing is standalone or parallel. The overhead of serialization, network transmission, and deserialization still exists, and the parallel computing solution even introduces a bit more overhead. Therefore, the overall resource consumption of the cluster doesn't change significantly. We also analyzed the performance of Prometheus in the current SLS storage-computing separation architecture and found that most of the overhead comes from PromQL computing, Golang GC, and deserialization.
To address this problem, we started exploring whether some PromQL files can be pushed down to the shards of SLS for computation. In this approach, the shards are considered as Prometheus Workers. There are two options for pushdown computing:
After comparison, the second solution proves to be more effective, although it may require more workload. To validate this, we reanalyzed the queries from all online users and found that more than 80% of scenarios only use a few common queries, making the implementation cost of the second solution relatively low. As a result, we chose the second solution: manually writing a C++ PromQL engine that supports common operators (see performance comparison below).
Before pushing down computing, it is necessary to ensure that data from the same time series is stored on one shard. This can be achieved by enabling the aggregate writing feature or manually writing data using an SDK.
Comparison between pushdown and parallel computing is as follows:
| Parallel computing | Pushdown computing | |
| Concurrency | Able to be set dynamically. | Concurrency is the same as that of shards. |
| Same concurrency performance | Moderate | High |
| Overall resource consumption | Moderate | Low |
| Additional limits | None | Data in the same timeline should be stored on one shard. |
| QPS | Low | High |
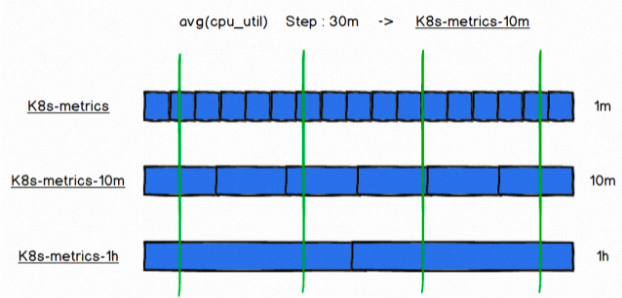
In time series scenarios, long-term metric storage is usually done to analyze the overall trend. However, storing a full amount of high-precision metrics can be costly. Therefore, metric data is often downsampled (reducing metric accuracy) and stored. The previous solution in SLS was more manual:
1. Users needed to use the ScheduledSQL feature to regularly query the original metric database, extract the latest/average value as the downsampled value, and store it in the new MetricStore.
2. During a query, the appropriate MetricStore for the query range needed to be determined. If the MetricStore was a downsampled MetricStore, some query rewriting was required.
This method required a high level of configuration and usage, and professional research and development skills were needed for its implementation. As a result, we have introduced built-in downsampling capabilities in the SLS backend:
1. For the downsampling library, you only need to configure the downsampling interval and the duration for which metrics should be stored.
2. The internal SLS system regularly downsamples the data according to the configuration (retaining the latest point within the downsampling range, similar to last_over_time), and stores it in the new metric library.
3. During a query, the appropriate metric library is automatically selected based on the query's step and time range.
4. If you query a downsampled library, SLS automatically rewrites the query or performs data fitting computations. There is no need for you to manually modify the query.
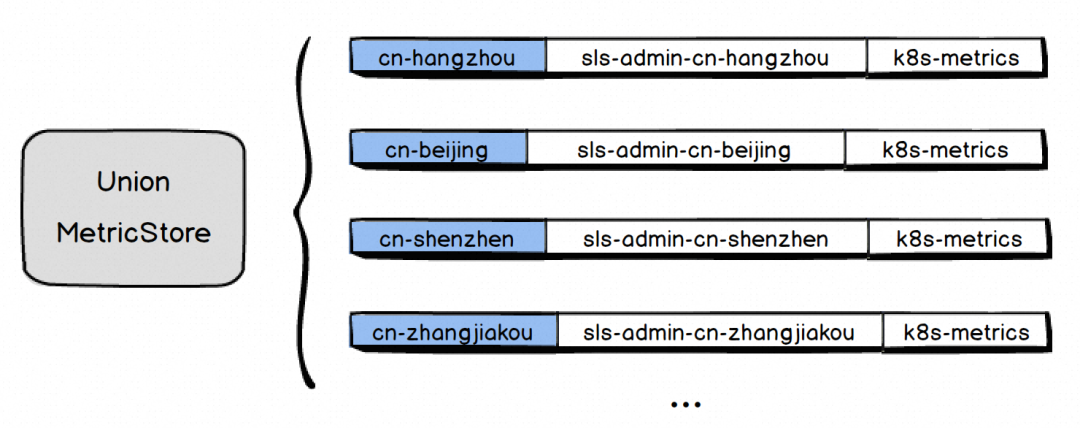
We have numerous internal and external customers of SLS across various locations in China, and data is typically stored locally. However, when creating global dashboards and performing queries, you often need to manually query in different locations or develop a gateway to query and aggregate data from multiple projects and stores. Thanks to the technical implementation of SLS distributed computing and computing pushdown capabilities, we can provide support for high-performance, low resource consumption cross-project or even cross-region query capabilities: Union MetricStore at the engine layer.
Note: Due to compliance issues, UnionStore does not support multinational projects.

The above figure is the performance comparison of SLS in different computing modes under 40,000 time series.

The above figure is the performance comparison of SLS in different computing modes under the maximum of more than 2 million time series.
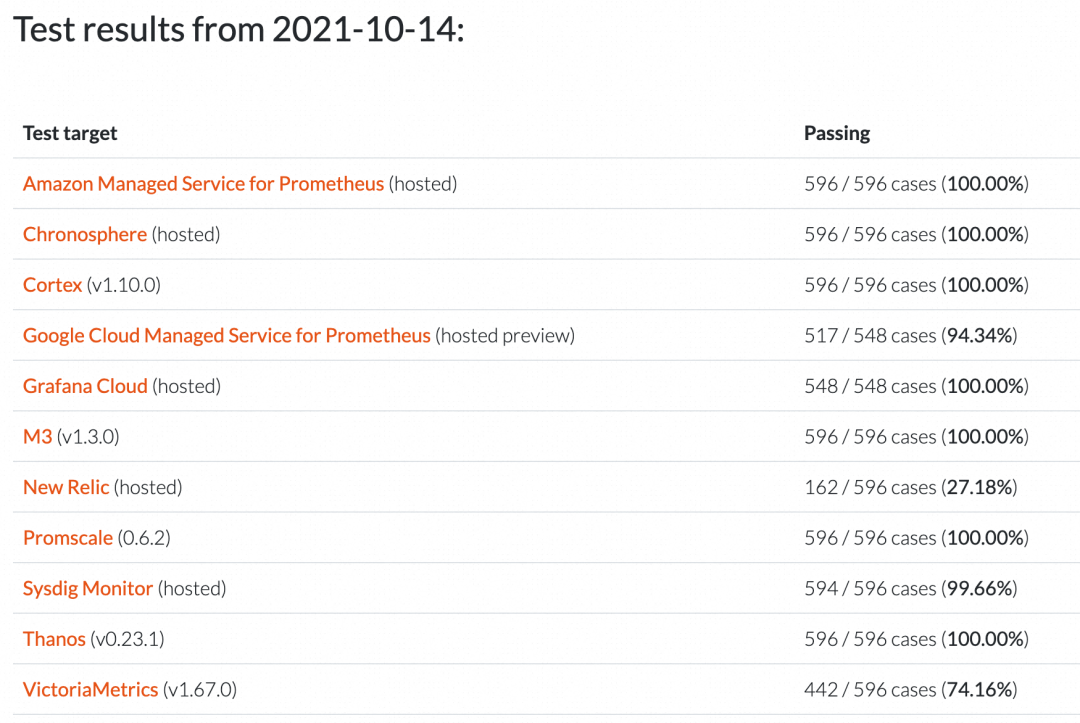
We conducted a comprehensive performance comparison between SLS and some popular PromQL engines on the market. The contestants include the open source standard Prometheus, the distributed solution Thanos, and the VictoriaMetrics which is claimed to be the fastest PromQL engine in the market.
Test load:
Test environment:
Test scenario:
The performance of three versions of SLS are tested:
sls-pushdown: SLS computing pushdown version. Use the Prometheus computing engine implemented by C++ for common queries.
| prometheus | thanos | VictoriaMetrics | sls-normal | sls-parallel-32 | sls-pushdown | |
| 6,400 time series | 500.1 | 953.6 | 24.5 | 497.7 | 101.2 | 54.5 |
| 359,680 time series | 12260.0 | 26247.5 | 1123.0 | 12800.8 | 1182.2 | 409.8 |
| 1,280,000 time series | 36882.7 | Mostly failed. | 5448.3 | 33330.4 | 3641.4 | 1323.6 |
The table above presents the average latency (in ms) of common queries in three different scenarios. Here are the key observations:
In the same scenario, the longer the storage time, the better the cost-effectiveness of downsampling.
Technical upgrades have been implemented in some SLS clusters and will gradually cover all clusters in the future. However, more time is needed to ensure overall stability. Please be patient.
The pursuit of improvements in performance, cost, stability, and security is a continuous process. SLS will continue to strive for progress in these areas and provide reliable and observable storage engines for everyone.
Technical Practice of Alibaba Cloud Observability Data Engine
12 posts | 1 followers
FollowDavidZhang - December 30, 2020
Alibaba Developer - April 7, 2020
Alibaba Cloud Community - February 10, 2022
Alibaba Clouder - April 12, 2021
Alibaba Cloud Native Community - February 10, 2026
Alibaba Cloud Storage - March 1, 2021
12 posts | 1 followers
Follow Simple Log Service
An all-in-one service for log-type data
Learn More Cloud Parallel File Storage
The fully-managed scalable parallel file system can meet your requirements on high-performance computing.
Learn More Managed Service for Prometheus
Multi-source metrics are aggregated to monitor the status of your business and services in real time.
Learn More Storage Capacity Unit
Plan and optimize your storage budget with flexible storage services
Learn MoreMore Posts by DavidZhang