By Kenwei (Wei Dan) and Yiling (Qikai Yang)
Prometheus, as one of the mainstream observable open-source projects, has become a standard for cloud-native monitoring and is widely used by many enterprises. When using Prometheus, we often encounter the requirement of a global view. However, the data is indeed scattered in different Prometheus instances. How can we solve this problem? This article lists the general solutions of the community, provides a global view solution of Alibaba Cloud, and finally provides a practical case of a customer based on Alibaba Cloud Managed Service for Prometheus, which is expected to inspire and help you.
When using Alibaba Cloud Managed Service for Prometheus, we may encounter some problems with multiple Prometheus instances due to regional restrictions and business reasons.
We are aware that the Grafana dashboard is the most common and widely used method for observing Prometheus data. Typically, creating a separate data source is required for each Prometheus cluster being observed. For instance, if there are 100 Prometheus clusters, it means creating 100 data sources. This may seem like a tedious task.

When editing the Grafana panel and entering PromQL, we can select a data source. However, to ensure the consistency and simplicity of data query and display, only one data source is allowed for one Grafana panel.

If we need to draw the panels of multiple data sources at the same time in one dashboard, then 100 panels will be generated when using more than 100 data sources. Therefore, we need to edit the panel 100 times and write PromQL 100 times, which is very unfavorable for O&M. Ideally, it should be merged into one panel and each data source should have one timeline, which not only facilitates metric monitoring but also greatly reduces the maintenance operations of the dashboard.

When different businesses use different Prometheus instances that report the same metrics, we want to perform the sum and rate operations for these data. However, due to the storage isolation between instances, such operations are not allowed. At the same time, we do not want to report all the data to the same instance, because depending on the business scenario, the data may come from different ACK clusters, ECS instances, Flink instances, or even from different regions. Therefore, it is necessary to maintain the instance-level isolation.
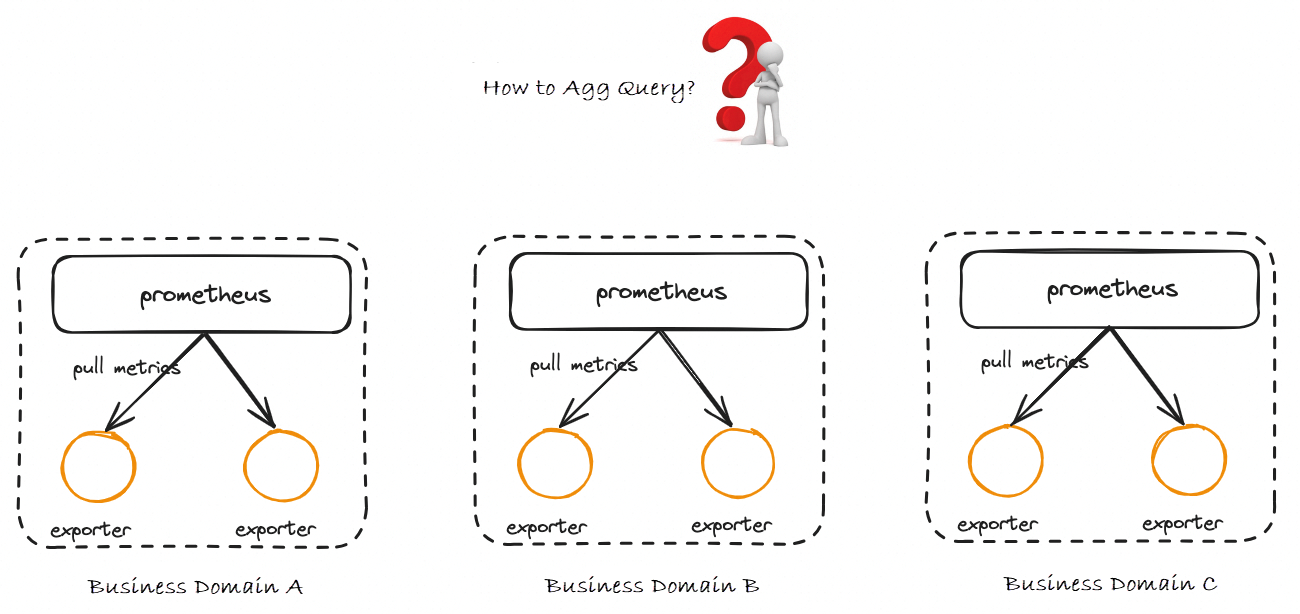
So, how does the community solve the preceding problems that exist in multiple Prometheus instances?
The Prometheus Federation mechanism is a clustering extension provided by Prometheus itself, but it can also be used to solve the problem of centralized data query. When we need to monitor a large number of services, we should deploy many Prometheus nodes to respectively pull the metrics exposed by these services. The Federation mechanism can aggregate the metrics obtained by these separately deployed Prometheus nodes and store them in a central Prometheus. The following figure shows a common Federation architecture:
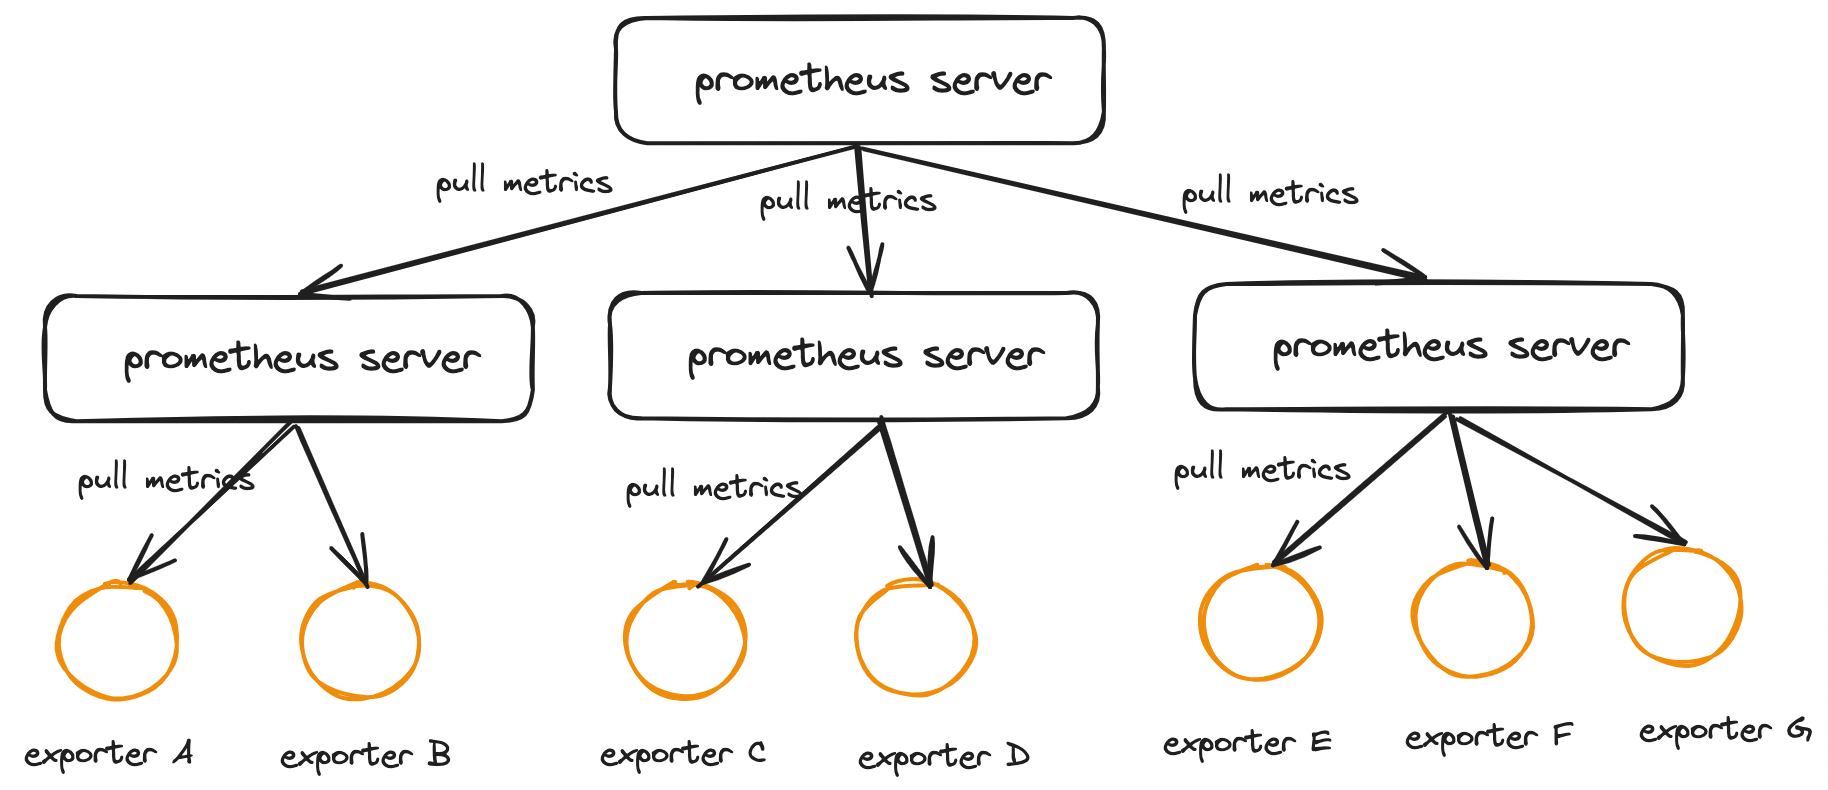
Each Prometheus instance on an edge node contains a /federate interface to obtain the monitoring data of a specified set of time series. You only need to configure one collection task for the global node to obtain the monitoring data from edge nodes. To better understand the Federation mechanism, the following code describes the configuration of the Global Prometheus configuration file.
scrape_configs:
  - job_name: 'federate'
    scrape_interval: 10s

    honor_labels: true
    metrics_path: '/federate'

    # Pull metrics based on the actual business situation and configure the metrics to be pulled by using the match parameter
    params:
      'match[]':
        - '{job="Prometheus"}'
        - '{job="node"}'

    static_configs:
      # Other Prometheus nodes
      - targets:
        - 'Prometheus-follower-1:9090'
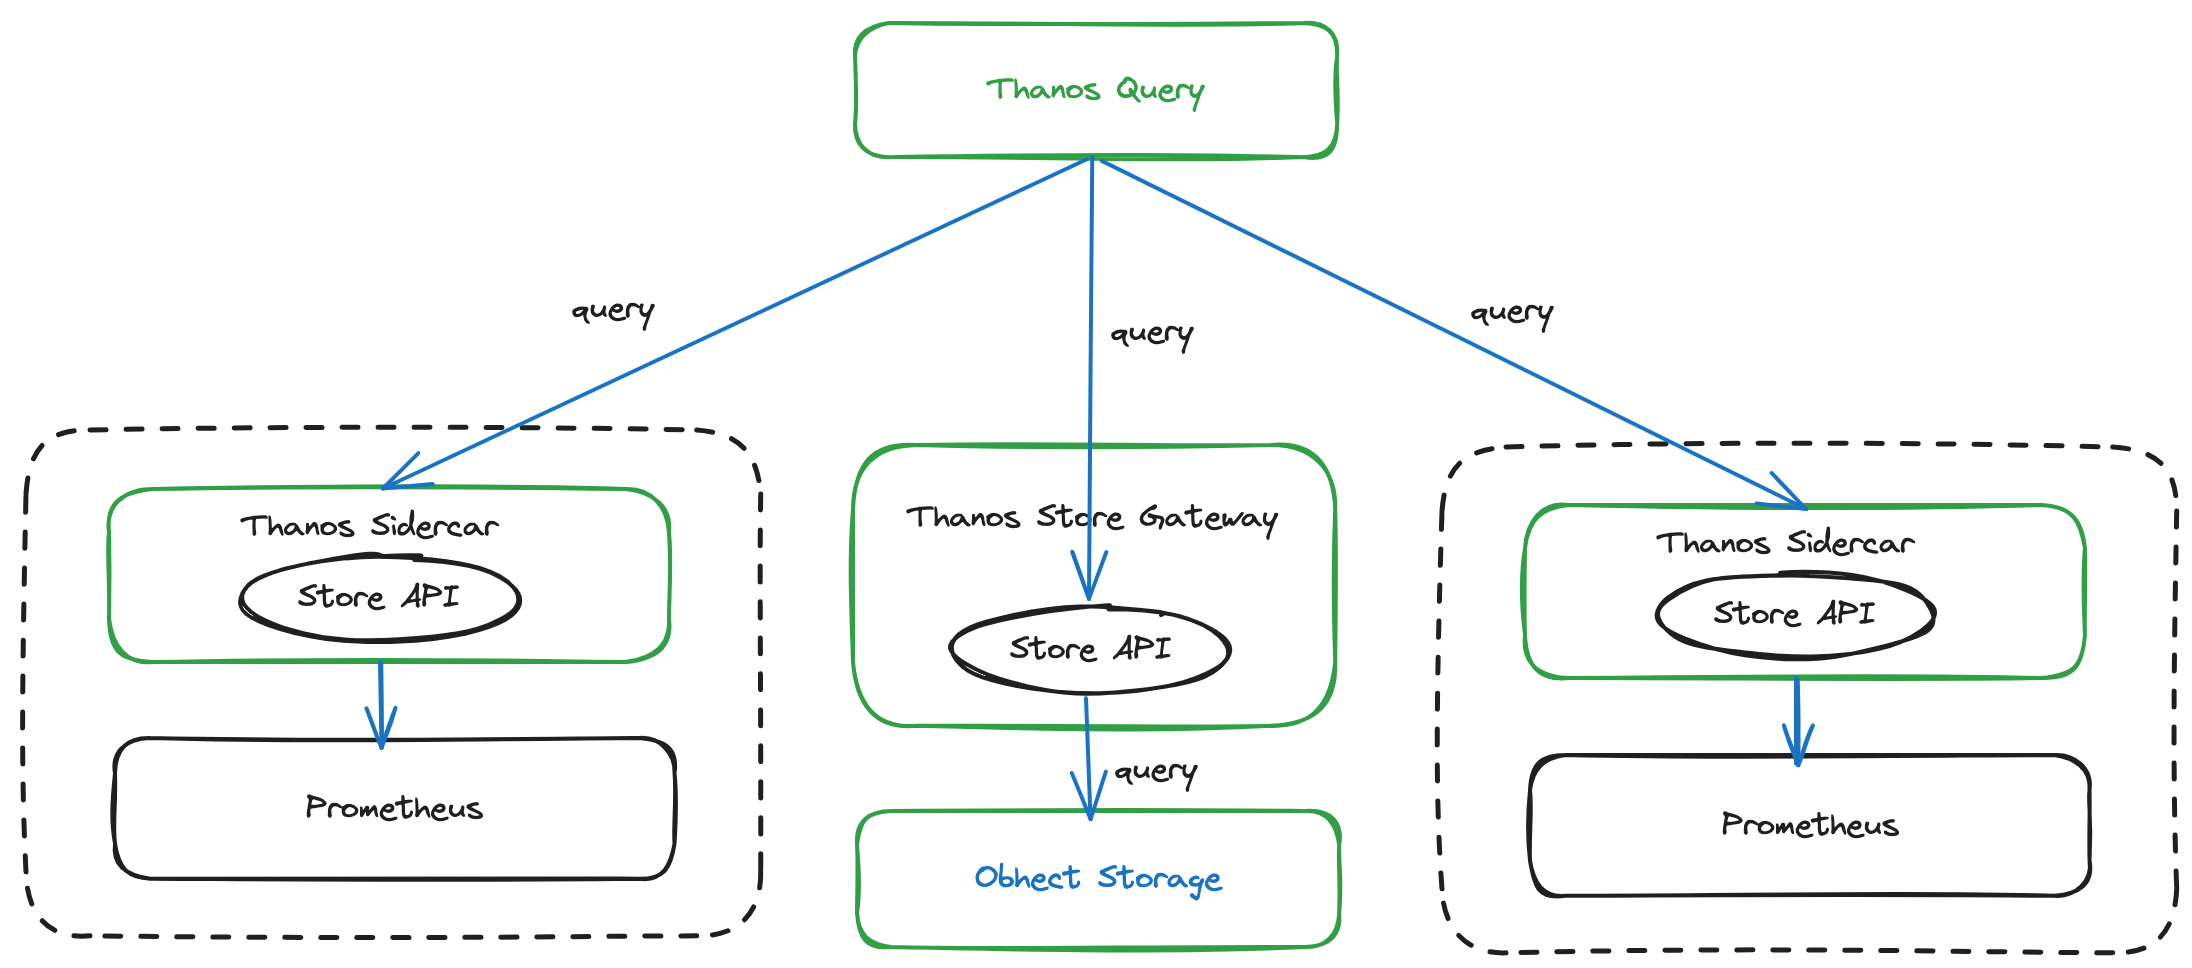
- 'Prometheus-follower-2:9090'For the open-source Prometheus, we can use Thanos to implement aggregate queries. The following code shows the Sidecar deployment mode of Thanos:
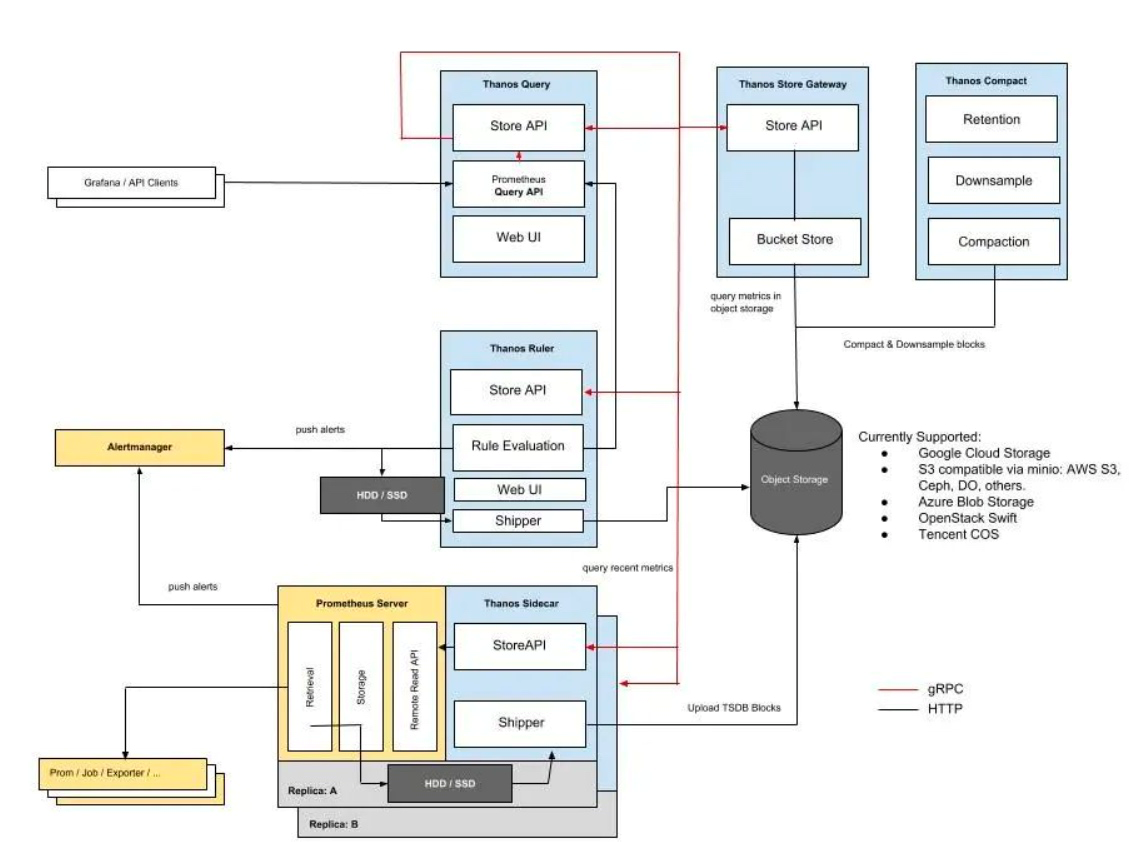
This figure shows several core components of Thanos (but not all of them):
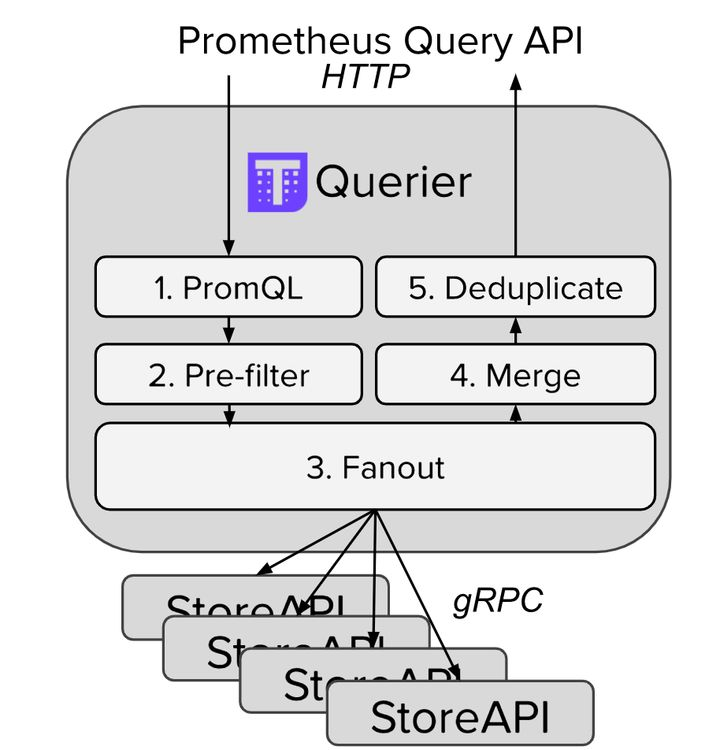
The Remote Write mechanism is also an effective solution to solve the global query problem of multiple Prometheus instances. Its basic idea is very similar to the Prometheus Federation mechanism. The metrics obtained by separately deployed Prometheus nodes are stored in a central Prometheus or third-party storage by using the Remote Write mechanism.
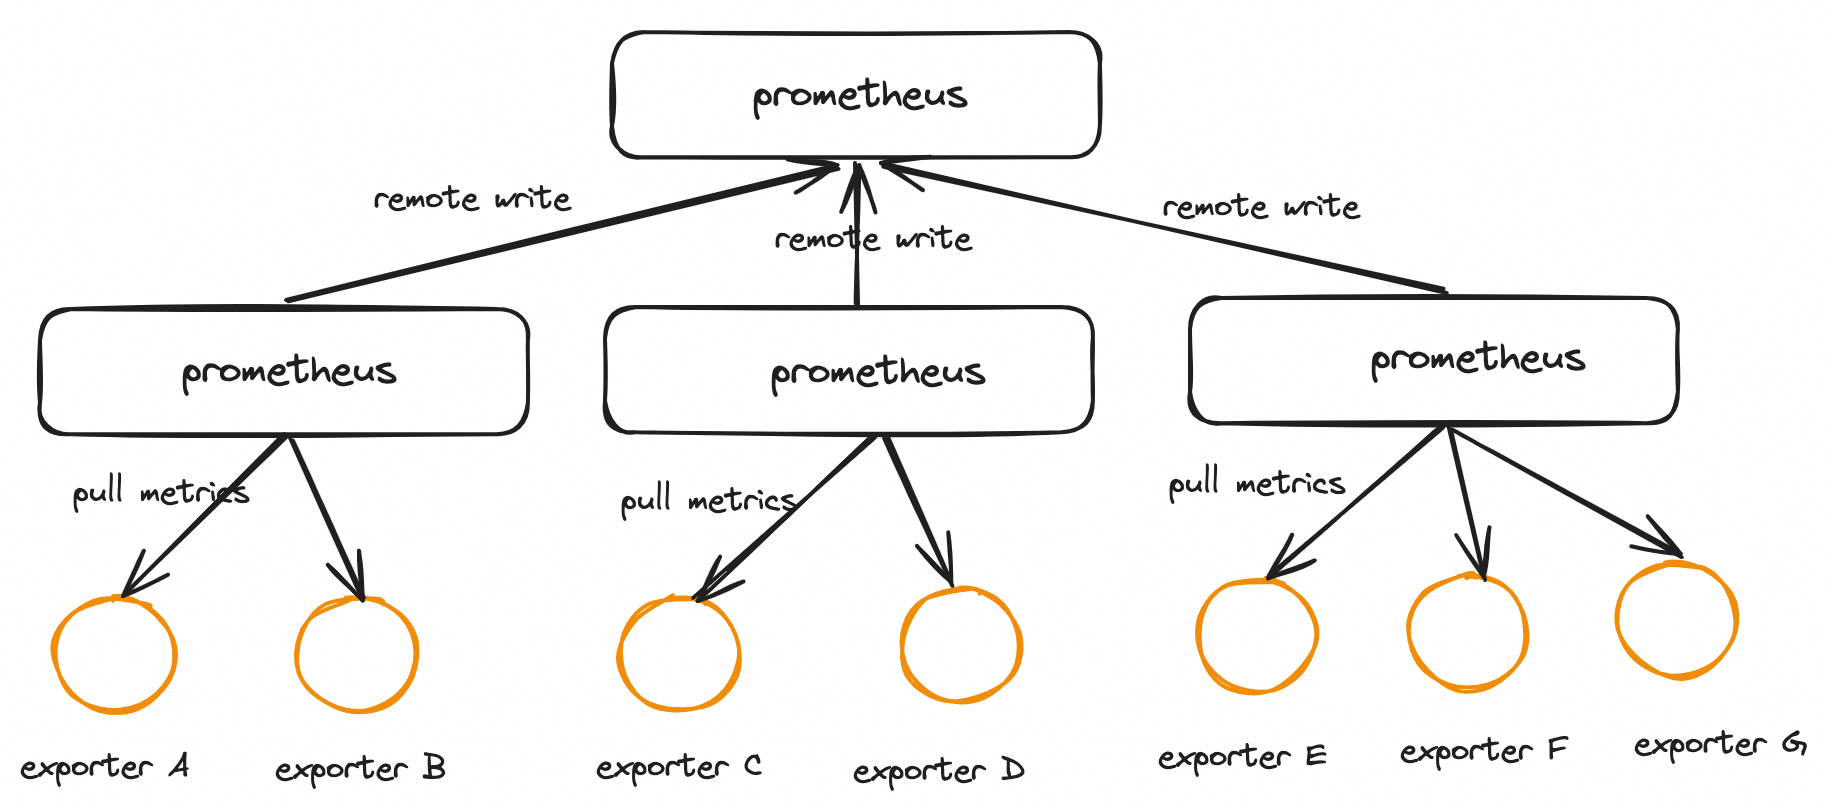
Users can specify the URL of Remote Write in the Prometheus configuration file. Once the configuration items are set, Prometheus sends the collected sample data to the Adaptor by HTTP, and users can connect to any external service in the Adaptor. External services can be open-source Prometheus, real storage systems, or public cloud storage services.

The following example shows how to modify Prometheus.yml to add configuration content related to Remote Storage.
remote_write:
- url: "http://*****:9090/api/v1/write"Alibaba Cloud has launched Prometheus Global Aggregation Instance (Global View) to aggregate data across multiple Alibaba Cloud Managed Service for Prometheus instances. When you query data, you can read data from multiple instances at the same time. The principle is metric aggregation during the query.
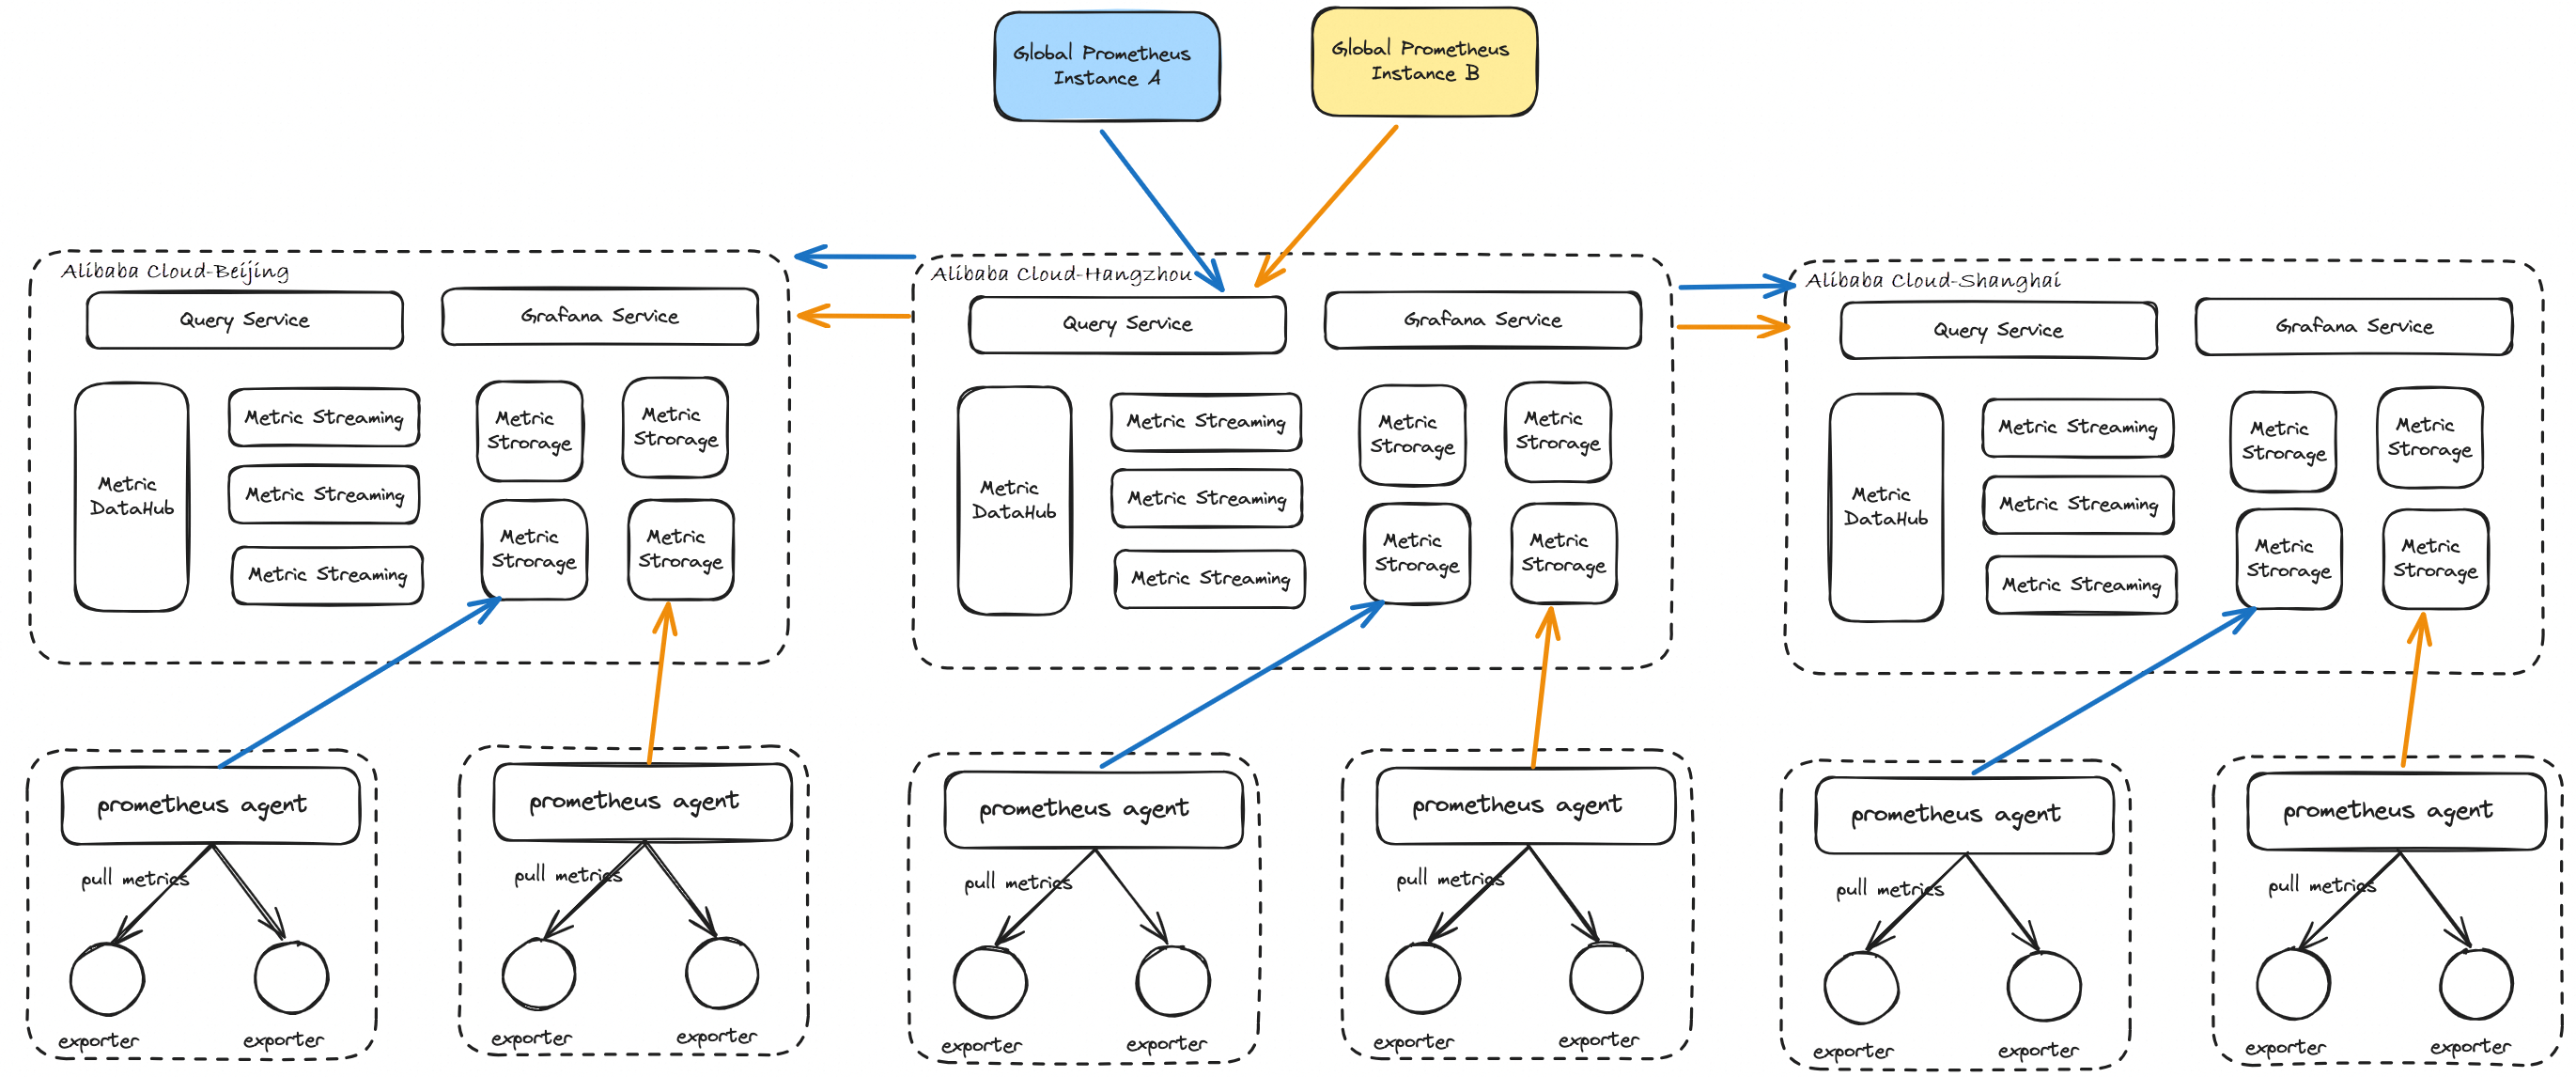
You can use global aggregation instance (Global View) to isolate data between Alibaba Cloud Managed Service for Prometheus instances. Each Prometheus instance has an independent storage at the backend. Instead of pooling data to central storage, you can dynamically retrieve the required data from the storage of each Prometheus instance during the query. Therefore, when a user or a frontend application initiates a query request, Global View queries all relevant Prometheus instances in parallel and summarizes the results to provide a centralized view.
The following section describes the open-source Prometheus Federation, Thanos, and Alibaba Cloud Global Aggregation Instance.
Although Prometheus Federation can solve the problem of global aggregation queries, there are still some problems.
However, it should be noted that both Thanos Federation and Alibaba Cloud Global Aggregation Instance implement global queries in a non-pooled data manner. The need to retrieve data from multiple data sources during the query may cause the query performance to decrease. Especially when the query involves a large amount of unneeded data, you need to wait for multiple data sources to filter out the needed data. The process of waiting for these data processing may cause query timeouts or long waits.
Alibaba Cloud Managed Service for Prometheus greatly simplifies users' operations. You do not need to manually deploy Prometheus extensions, instead, you can use the console to implement the global view feature. When you create an Alibaba Cloud Managed Service for Prometheus instance, select Global Aggregation Instance. Select the instance to be aggregated, then select the region where the query frontend is located (which affects the generation of the query domain name), and click Save.
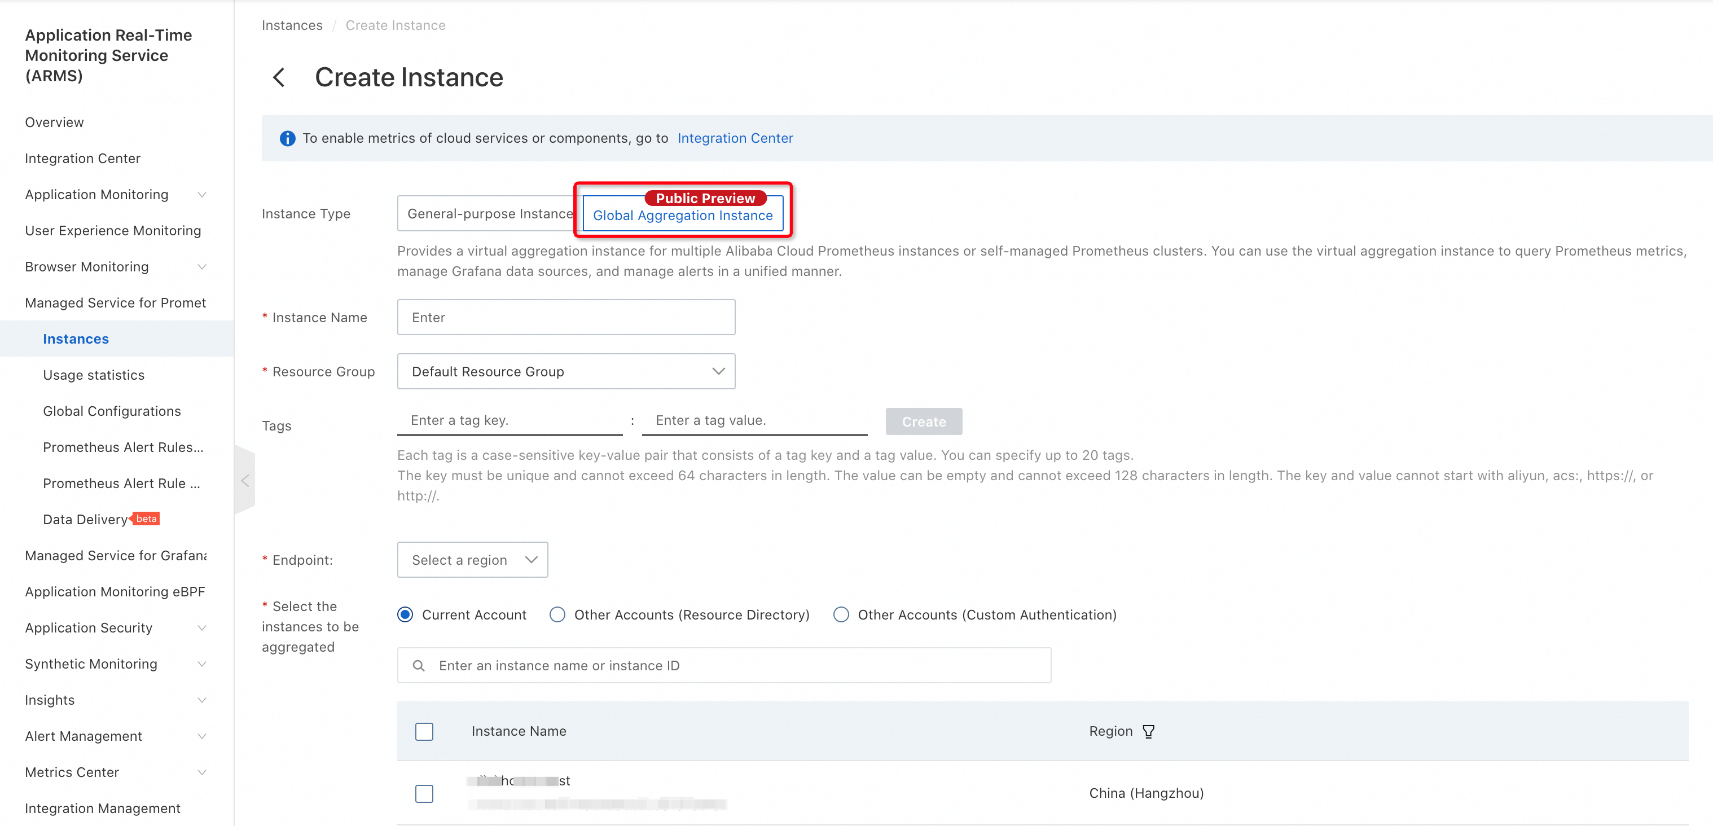
Enter the created global aggregation instance and click any dashboard. You can see that the instance can query the data of other instances just aggregated. This meets the requirement of querying data from multiple instances in one Grafana data source.
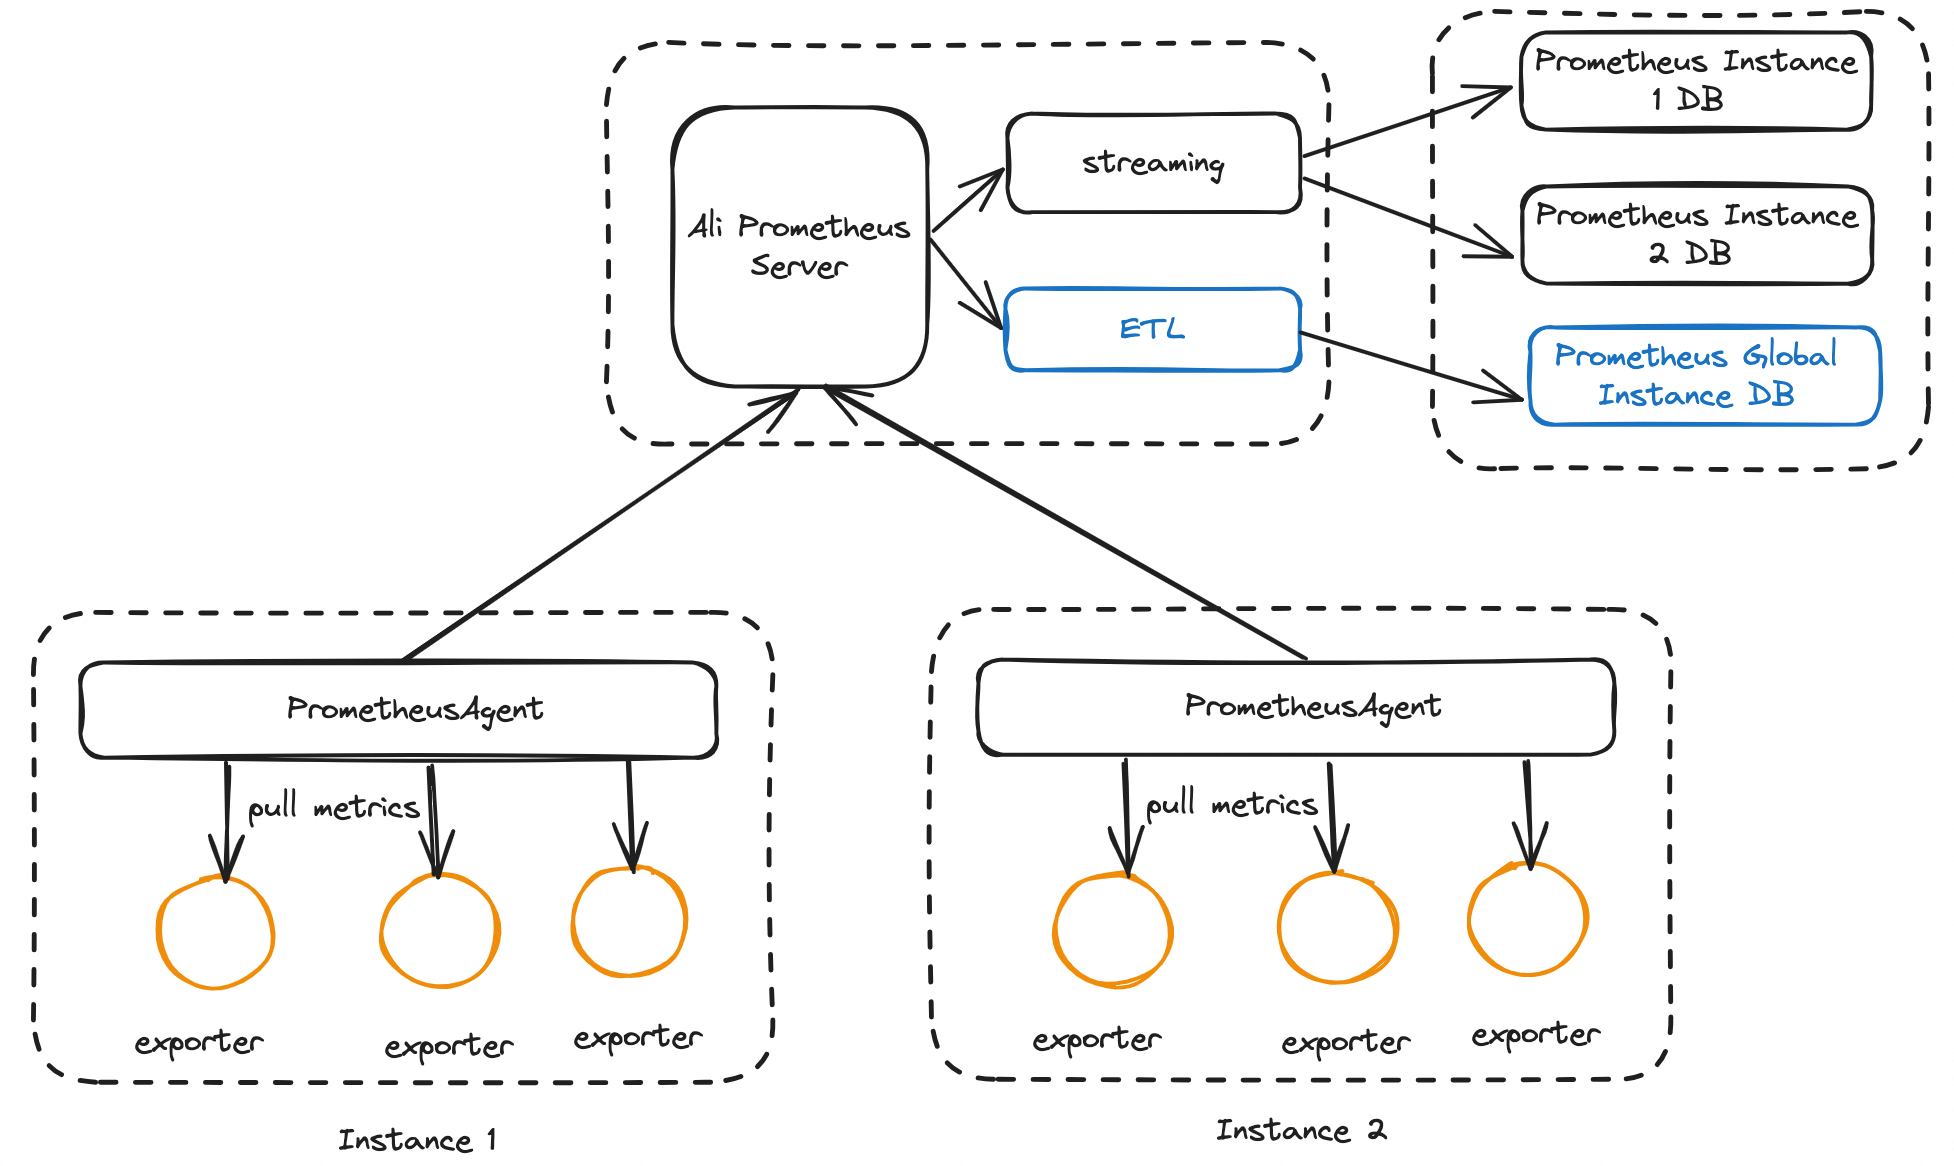
The capabilities of Alibaba Cloud Managed Service for Prometheus Remote Write are atomic capabilities of Prometheus data delivery. Prometheus data delivery is based on the principle of metric aggregation during the storage. Alibaba Cloud Managed Service for Prometheus data delivery aims to extract data from multiple Prometheus instances through the ETL service and then write the data to the storage of an aggregated instance.
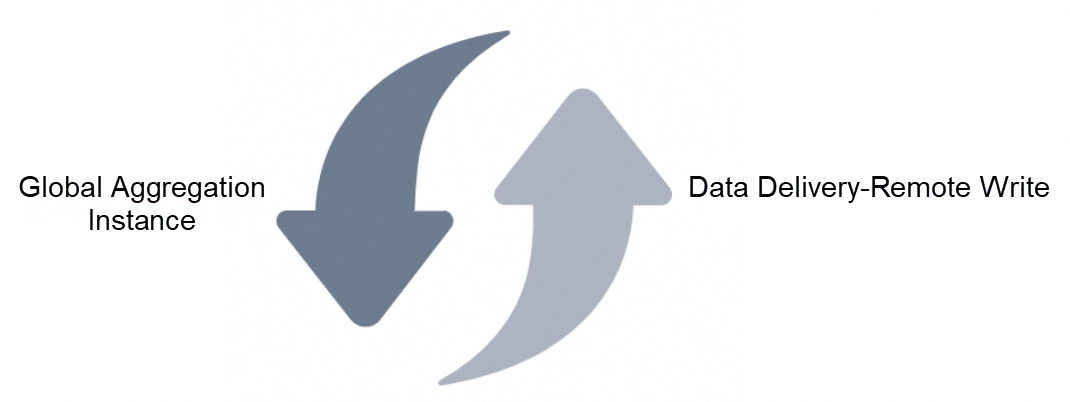
In this way, the same Prometheus data can be stored in different instances at the same time:
The biggest disadvantage of the open-source Remote Write format is the impact on the Prometheus Agent. Setting Remote Write on the Agent increases the resource consumption of the Agent and affects the data collection performance, which is often fatal.
The advantages of Alibaba Cloud Managed Service for Prometheus Remote Write are still very obvious.
At the same time, of course, there are some disadvantages, and we need to make a comprehensive trade-off.
1. In the left-side navigation pane, choose Prometheus Monitoring > Data Delivery (beta) to enter the Data Delivery page of Managed Service for Prometheus.

2. In the top navigation bar of the Data Delivery page, select a region and click Create Task.
3. In the dialog box, set Task Name and Task Description and click OK.
4. On the Edit Task page, configure the data source and delivery destination.
| Configuration item | Description | Example |
|---|---|---|
| Prometheus instance | Delivered Prometheus data source | c78cb8273c02* |
| Data filtering | Enter metrics to be filtered based on the whitelist or blacklist mode and use Label to filter delivery data. It supports regular expressions, line breaks for multiple conditions, and multiple conditions with the relationship (&&). | __name__=rpc.job=apiserverinstance=192. |
5. Configure the Prometheus Remote Write endpoints and authentication method.
| Prometheus type | Endpoint acquisition method | Requirement |
|---|---|---|
| Alibaba Cloud Managed Service for Prometheus | Remote Write and Remote Read endpoint usage● If the source and destination instances are in the same region, use the internal endpoint. | Select B "O&M Platform A" c Auth for Authentication Method, and enter AK and SK of the RAM user that has the AliyunARMSFullAccess permissions. For more information about how to obtain the AK and SK, see View the Information about AccessKey Pairs of a RAM User● Username: the AccessKey ID, which is used to identify the user. ● Password: the AccessKey Secret, which is used to authenticate the user. You must keep your AccessKey Secret confidential. |
| Self-managed Prometheus | Official documentation | 1. The version of self-managed Prometheus is later than 2.39. 2. You must configure the out_of_order_time_window. For more information, see PromLabs. |
6. Configure the network.
| Prometheus type | Network model | Network requirement |
|---|---|---|
| Alibaba Cloud Managed Service for Prometheus | Public Internet | N/A |
| Self-managed Prometheus | Public Internet | N/A |
| VPC | Select the VPC where the self-managed Prometheus instance resides, and make sure that the Alibaba Cloud Managed Service for Prometheus Remote Write endpoint that you enter is accessible from the VPC, vSwitch, and security group. |
Alibaba Cloud provides global aggregation instances and data delivery Remote Write solutions with their own advantages and disadvantages.
| Solution | Core concept | Storage space | Query method |
|---|---|---|---|
| Global aggregation instance | Metric aggregation during the query | No additional storage space is consumed | Multi-instance query |
| Data Delivery Remote Write | Metric aggregation during the storage | Additional storage space is required to aggregate data | Single-instance query |
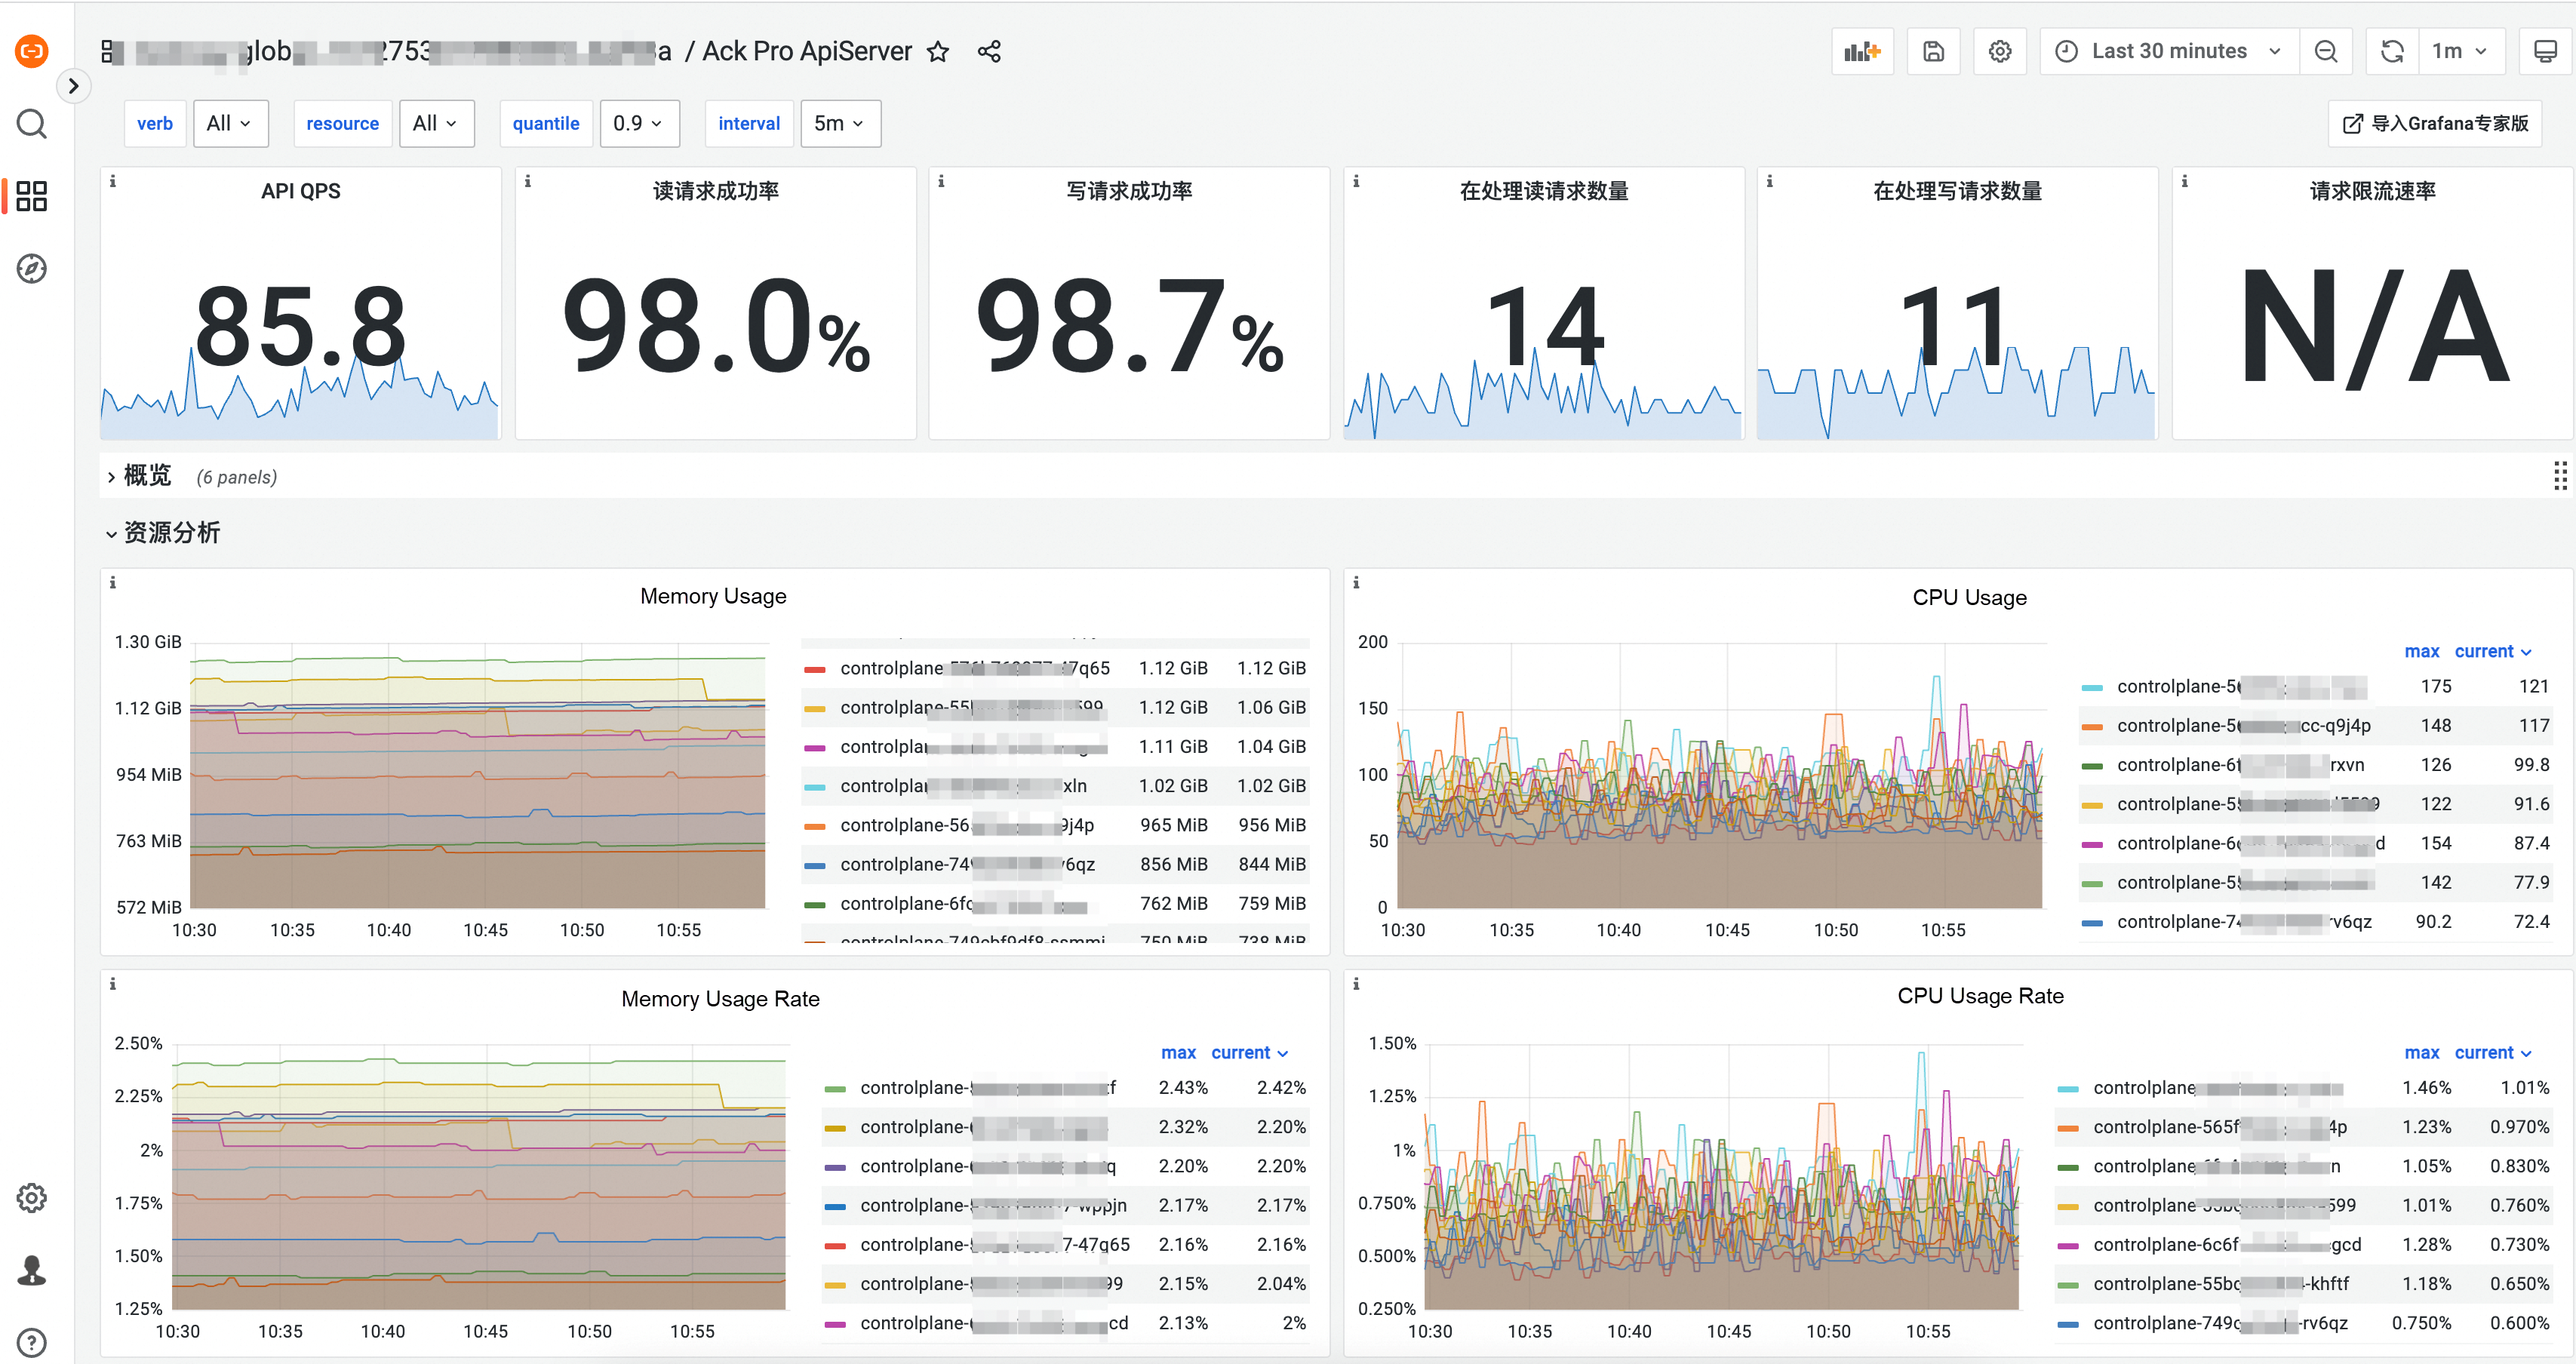
The following figure shows the internal O&M platform of a customer, which is temporarily referred to as O&M platform A. The customer company uses the O&M platform A to manage the lifecycle of its internal Kubernetes clusters. On the O&M platform A, you can only view the monitoring data of a single cluster. If multiple clusters have problems and you need to troubleshoot, you can only handle them one by one.
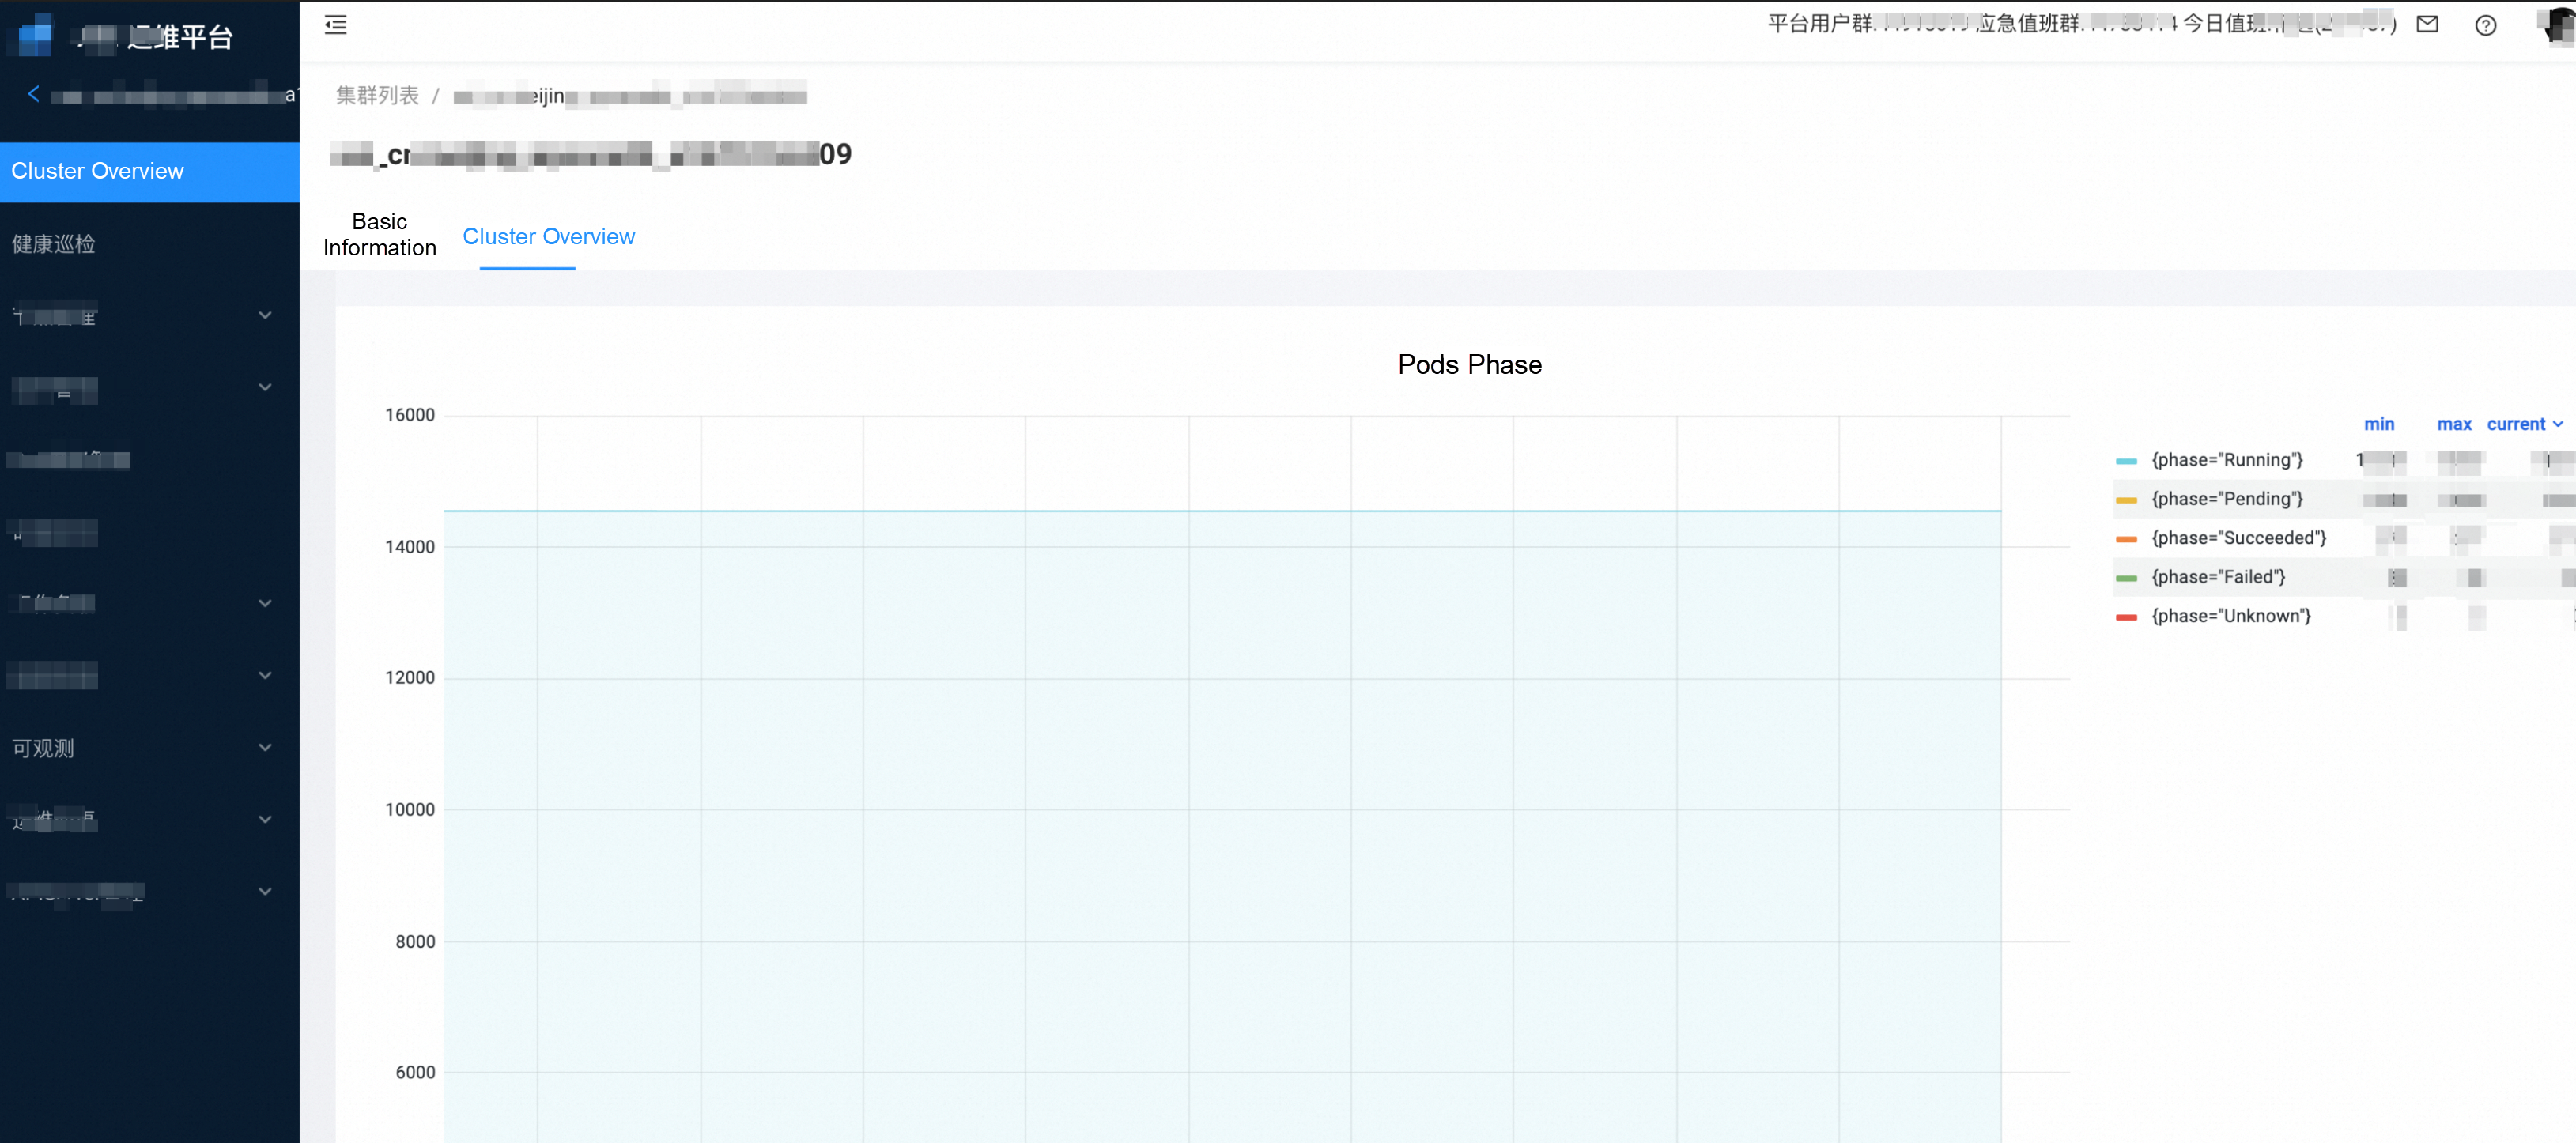
Similarly, when using Grafana, the current dashboard can only view the specific data of a cluster, but cannot monitor multiple clusters at the same time.
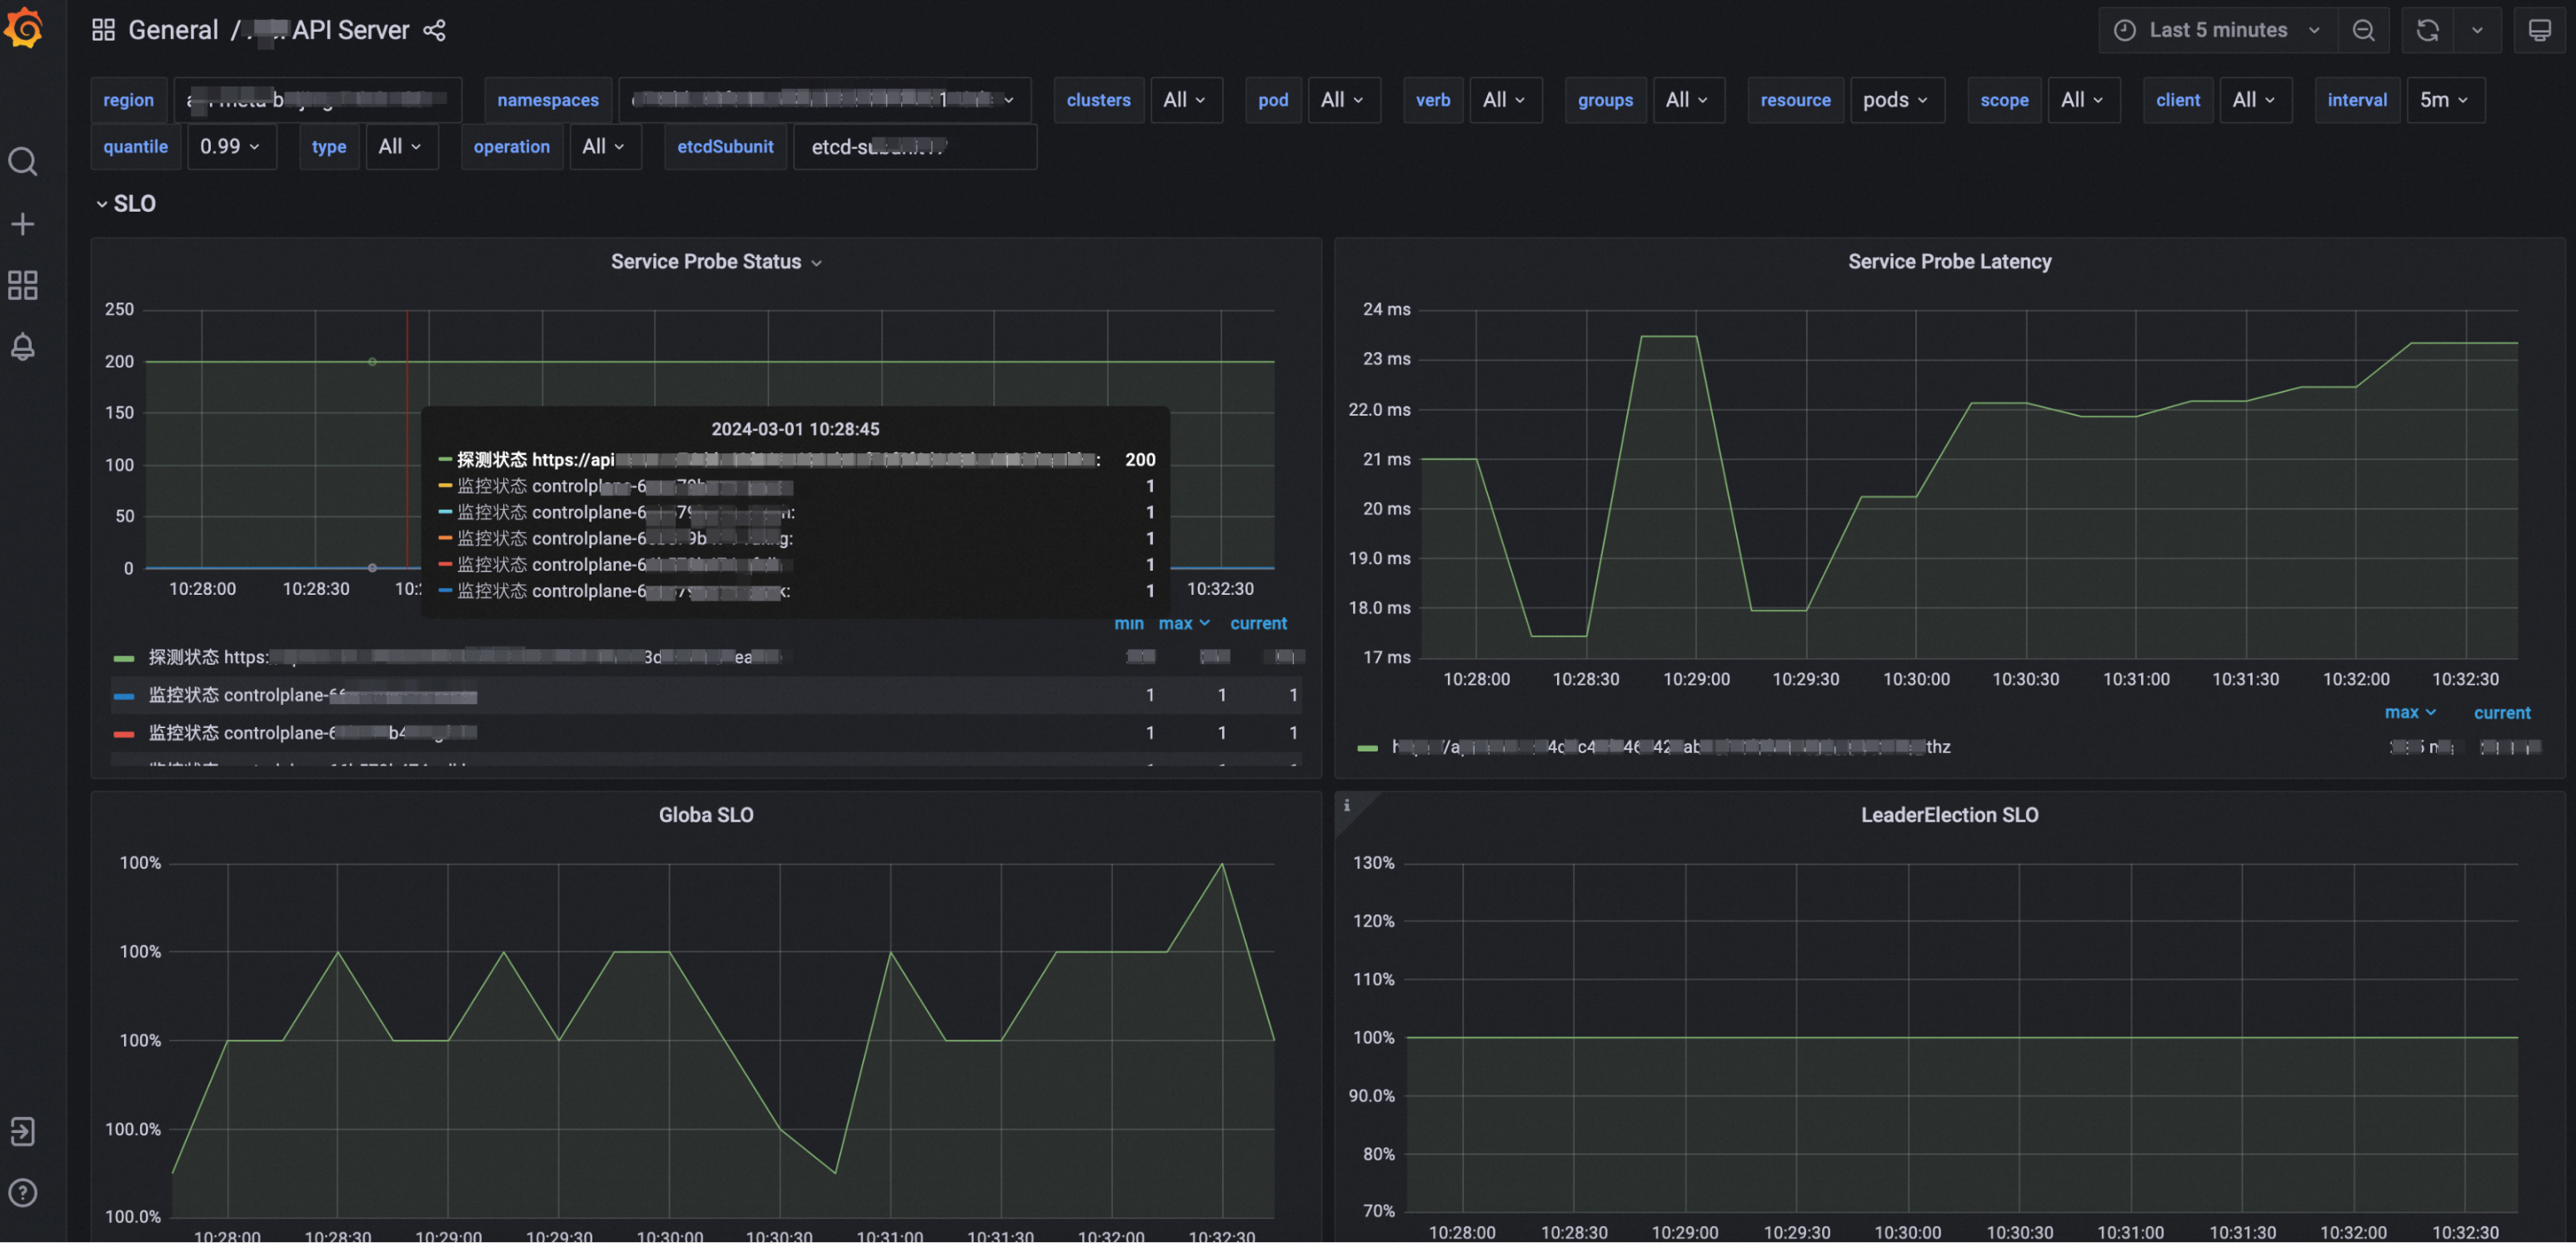
In this case, the SRE team cannot have a global view of the states of all clusters and cannot accurately obtain the health state of the product. In most O&M jobs, alert events are used to indicate that a cluster is unhealthy. At present, there are more than 500 clusters hosted by the O&M platform A. If all clusters depend on alert events, there is a risk of too many messages, therefore, high-level faults cannot be quickly located.
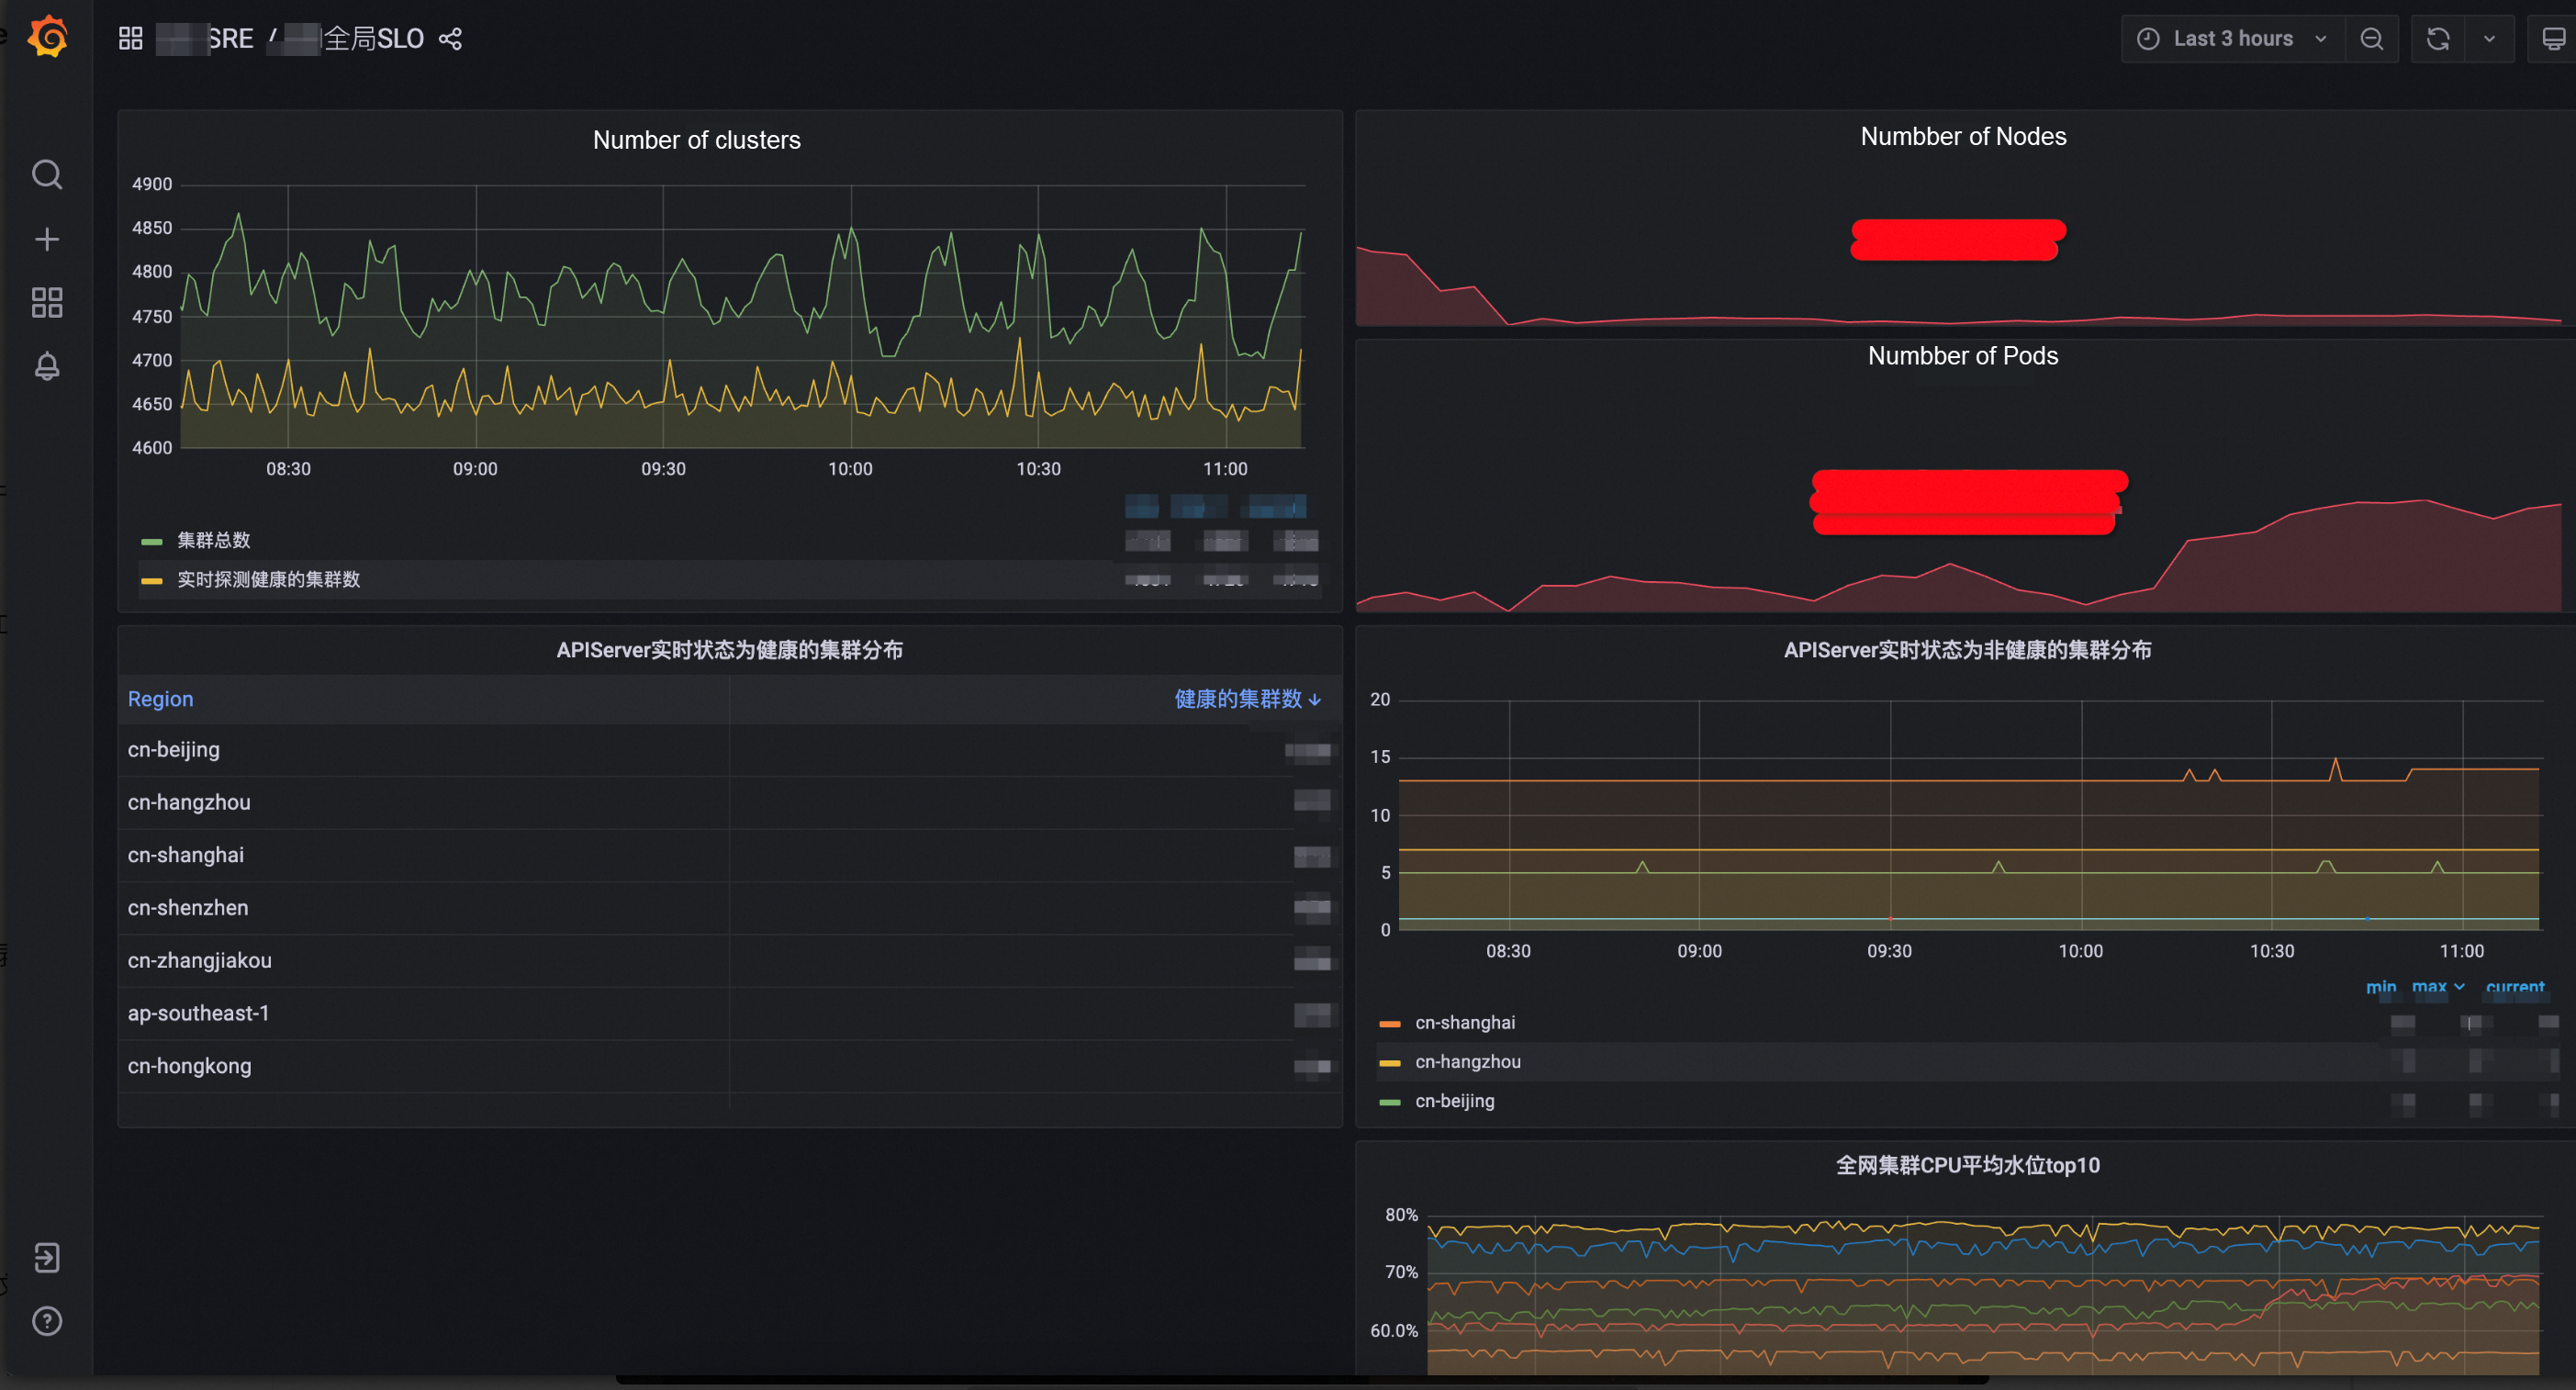
The current O&M management on the O&M platform A faces one challenge: it lacks a global view of the states of clusters in all regions. The goal of the O&M platform A is to configure a single Grafana dashboard and introduce a single data source to realize real-time monitoring of the running states of all tenant clusters in each product line. It includes visualization of key metrics, such as the overall states of the cluster (including the number of clusters, the number of nodes and pods, and the CPU usage of the cluster across the network), and the SLO (Service Level Objective) states of the APIServer (such as the proportion of verbs with non-500 responses across the network, details of 50X errors, and request success rate).
With this well-designed dashboard, the O&M team can quickly locate any cluster that is in an unhealthy state, quickly overview the business volume, and quickly investigate potential problems. It will greatly improve the O&M efficiency and response speed. Such integration not only optimizes the monitoring process but also provides a powerful tool for the O&M team to ensure the stability of the system and the continuity of services.
(Note: when you use Prometheus to configure data cross-border, you agree and confirm that you have all the disposal rights of the business data and are fully responsible for the behavior of the data transmission. You shall ensure that your data transmission complies with all applicable laws, including providing adequate data security protection technologies and policies, fulfilling legal obligations such as obtaining personal full express consent, and completing data exit security assessment and declaration, and you undertake that your business data does not contain any content that is restricted, prohibited from transmission or disclosure by applicable laws. If you fail to comply with the aforementioned statements and warranties, you will be liable for the corresponding legal consequences. If any losses are suffered by Alibaba Cloud and other affiliates as a result, you shall be liable for compensation.)
Global Aggregation Instance or Data Delivery? In the O&M platform A scenario, to meet the requirements and cope with the difficulties discussed above, data delivery is a better solution. The reasons are as follows:
When data delivery is used, the process can withstand greater network latency.
When a global aggregation instance query is used:
When data delivery is used:
When a PromQL query is executed, the number of timelines of the metric determines the CPU and memory resources required for the query. In other words, the more diverse the labels of the metrics are, the more resources are consumed.
When a global aggregation instance query is used:
When data delivery is used:
In general, when we choose the solution of centralized data management for multiple instances, in addition to whether additional storage space is required, the query success rate is a more important reference metric for business scenarios.
In the O&M Platform A scenario, a large number of instances across continents and a large amount of data are involved. Therefore, metric aggregation during the query may cause network request timeout, database query throttling, and excessive memory consumption of the database. This reduces the query success rate.
The data delivery solution that uses metric aggregation during the storage stores data to the centralized instance in advance, converts the network transmission of queries into the network transmission of data writing, and converts the query requests of multiple instances around the world into queries of instances in the current region. This solution has a high query success rate and meets business scenarios.
The following figure shows the product form of Prometheus data delivery - Remote Write. The data delivery service consists of two components. One is the Prometheus delivery component which is used to obtain data from the source Prometheus instance and then send it to the Internet forwarding service component after the metric filtering and formatting. The other is the Internet forwarding service component which is used to route data to the centralized instance in the Hangzhou region over the Internet.
In the future, we plan to use EventBridge to replace the existing Internet forwarding service component to support more delivery target ecosystems.
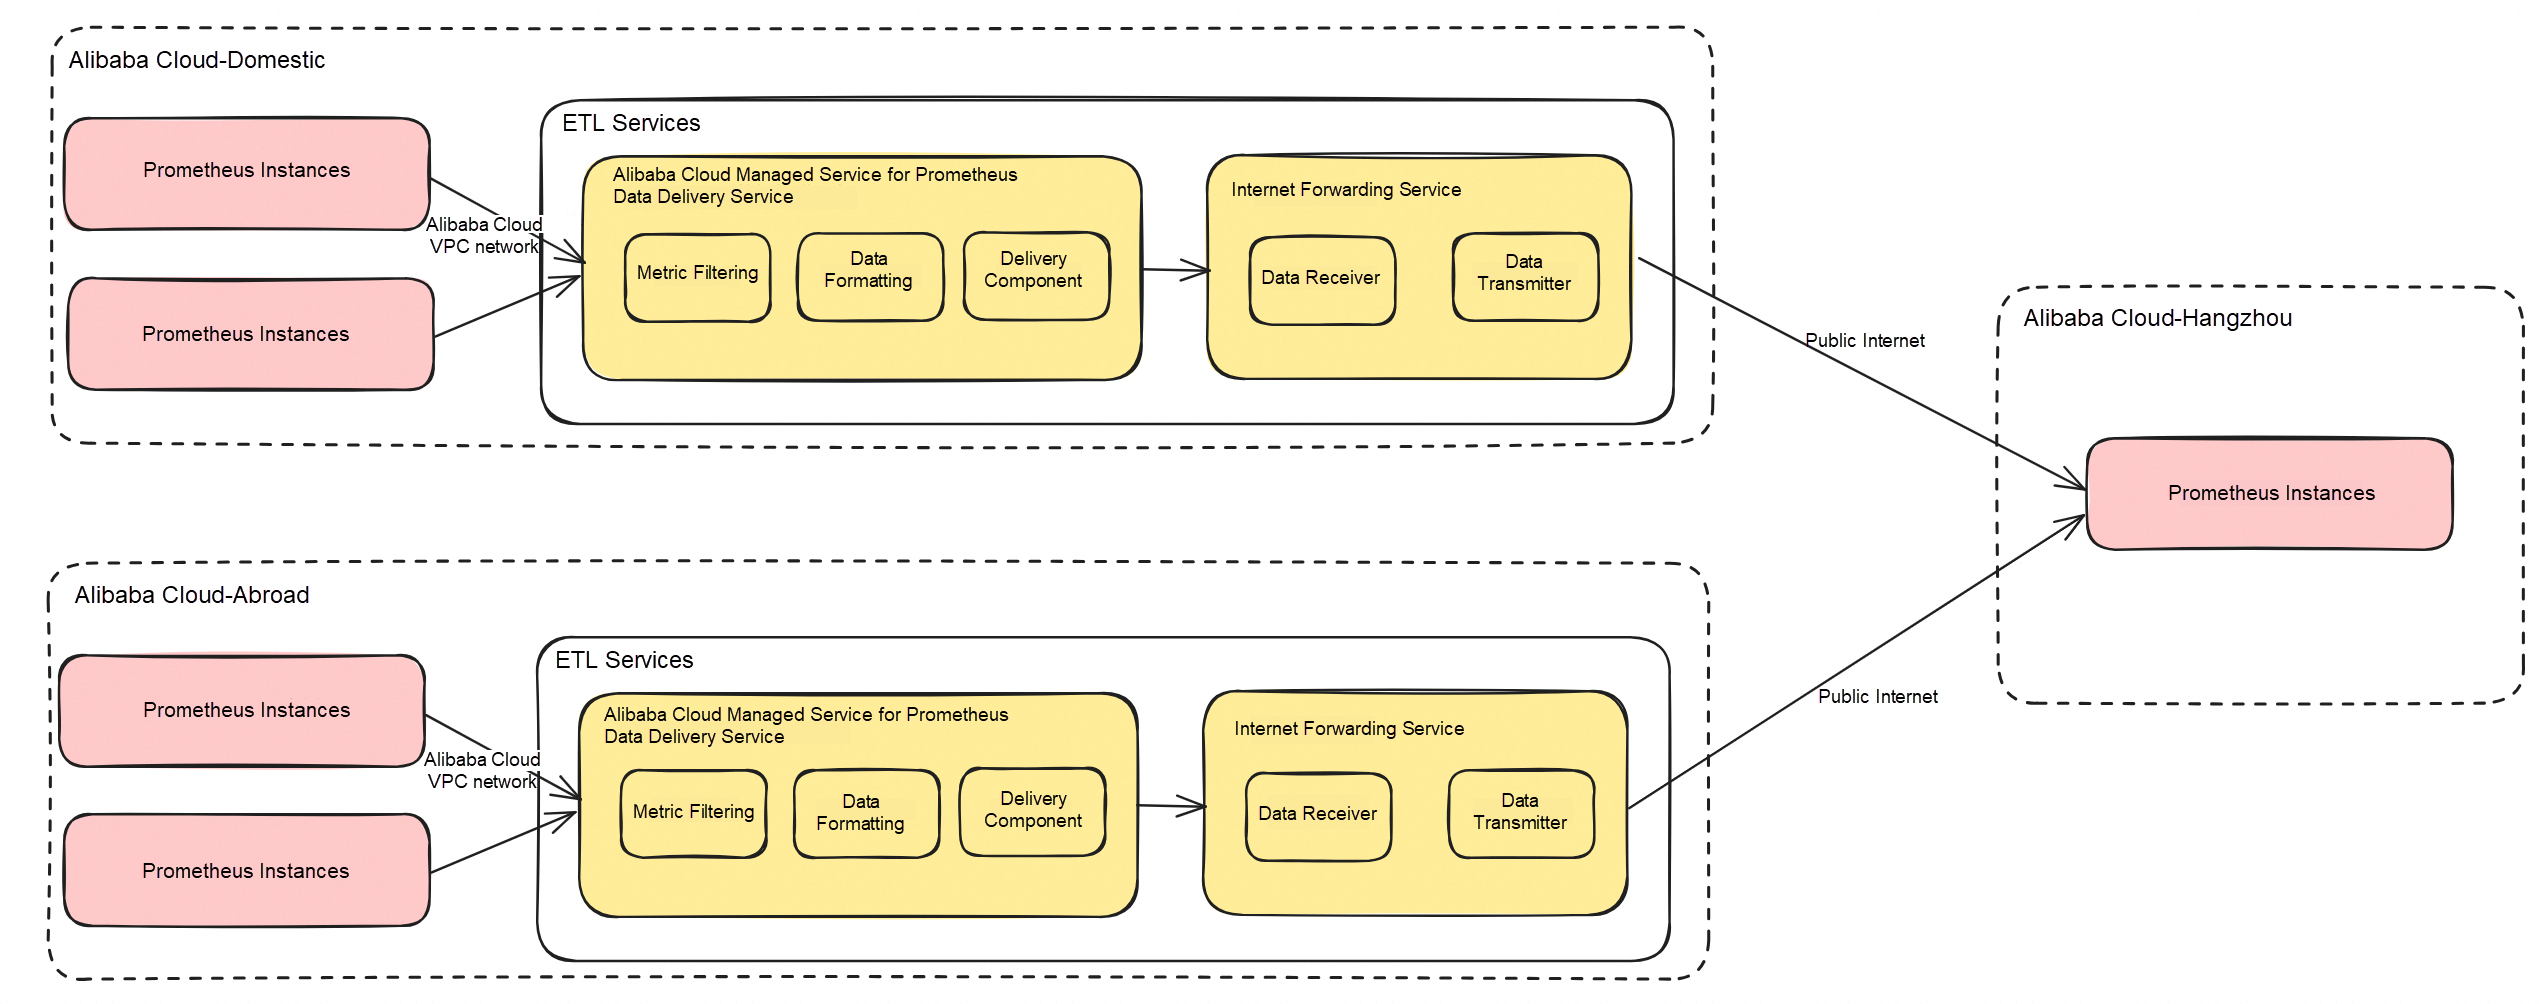
The Remote Write function delivers data of more than 500 instances on the O&M platform A in 21 regions around the world to a centralized instance in the Hangzhou region and configures a single Grafana data source. After configuring the dashboard, you can monitor all clusters managed by the O&M platform A. This eliminates the previous configuration of one data source per cluster, greatly facilitating O&M operations.
Use SPL to Efficiently Implement Flink SLS Connector Pushdown
Apache RocketMQ: How to Evolve from the Internet Era to the Cloud Era?

212 posts | 13 followers
FollowAlibaba Cloud Native - November 6, 2024
Alibaba Cloud Native - August 14, 2024
Hironobu Ohara - February 3, 2023
Alibaba Clouder - July 15, 2020
Alibaba Cloud Native - September 8, 2023
Alibaba Container Service - December 6, 2019

212 posts | 13 followers
Follow Cloud Migration Solution
Secure and easy solutions for moving you workloads to the cloud
Learn More ISV Solutions for Cloud Migration
Alibaba Cloud offers Independent Software Vendors (ISVs) the optimal cloud migration solutions to ready your cloud business with the shortest path.
Learn More NAT(NAT Gateway)
A public Internet gateway for flexible usage of network resources and access to VPC.
Learn More Managed Service for Grafana
Managed Service for Grafana displays a large amount of data in real time to provide an overview of business and O&M monitoring.
Learn MoreMore Posts by Alibaba Cloud Native