Sysbench is a modular, cross-platform, and multi-threaded benchmark tool that can be used to evaluate the performance of a heavily loaded database system based on core metrics. Sysbench allows you to test the performance of a database without the need to configure complicated benchmark settings or install the database engine.
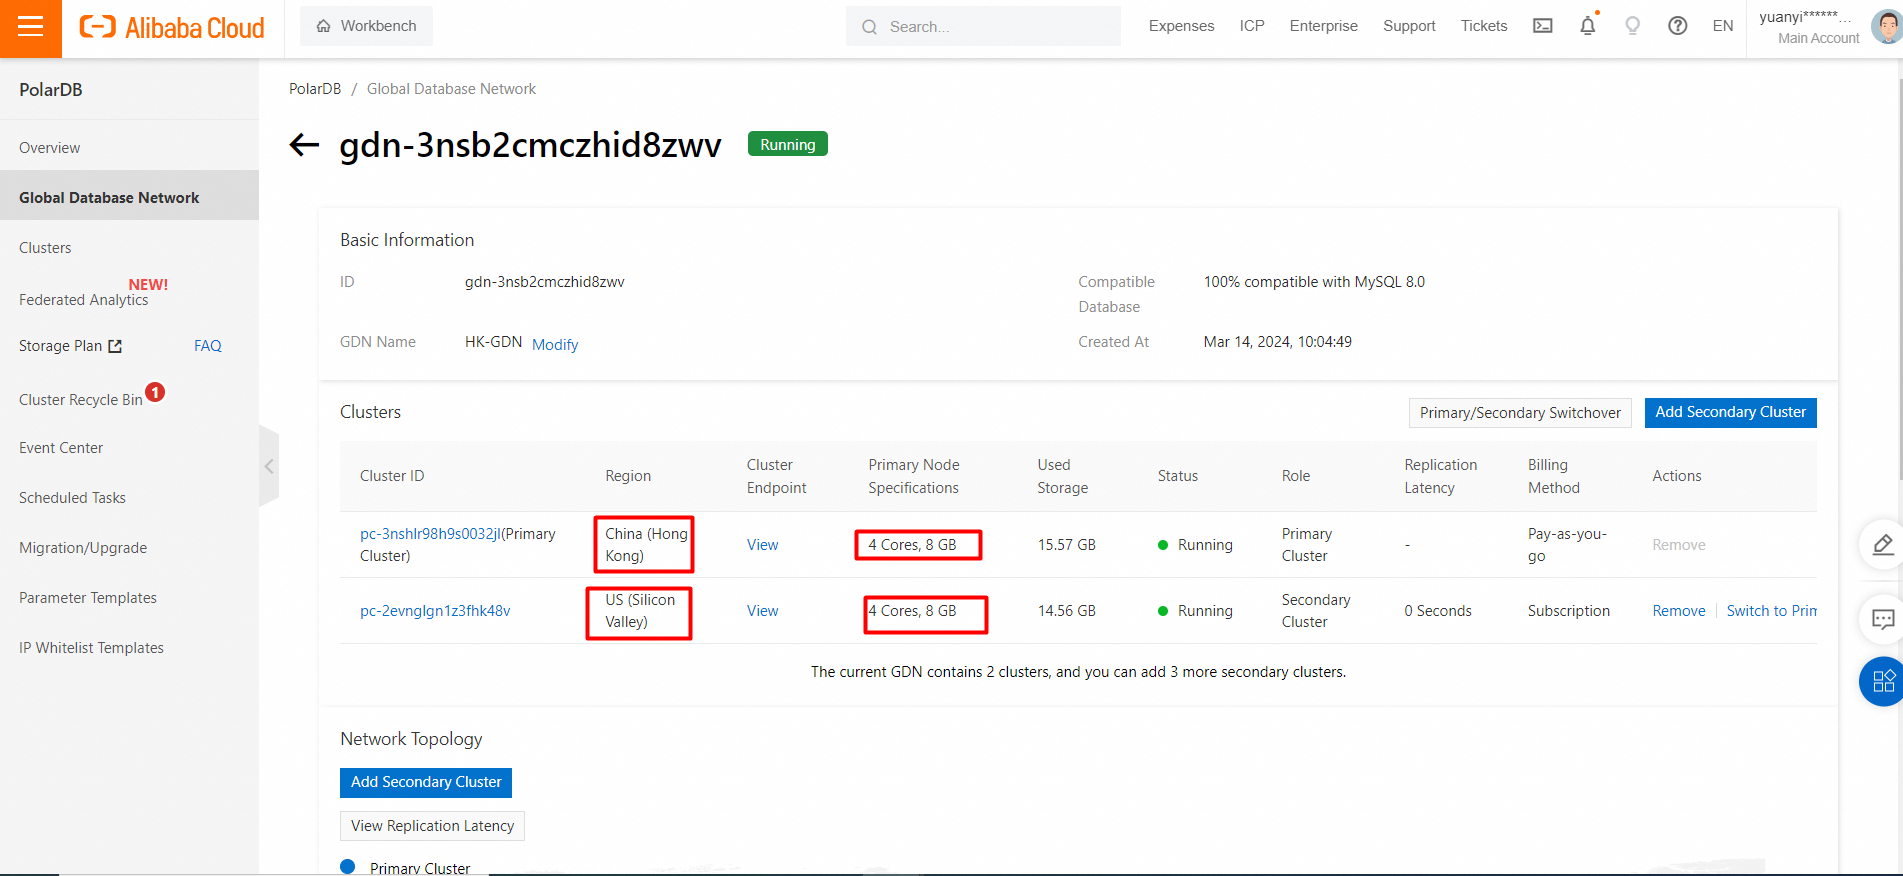
• The Elastic Compute Service (ECS) instance and the PolarDB for MySQL cluster used in the test are deployed in the same region (Hong Kong).
• The test primary cluster is a Hong Kong node with 4 cores and 8 GB of memory, including one primary node and one read-only node.
• The test secondary cluster is a US Silicon Valley node with 4 cores and 8 GB of memory, including one primary node and one read-only node.
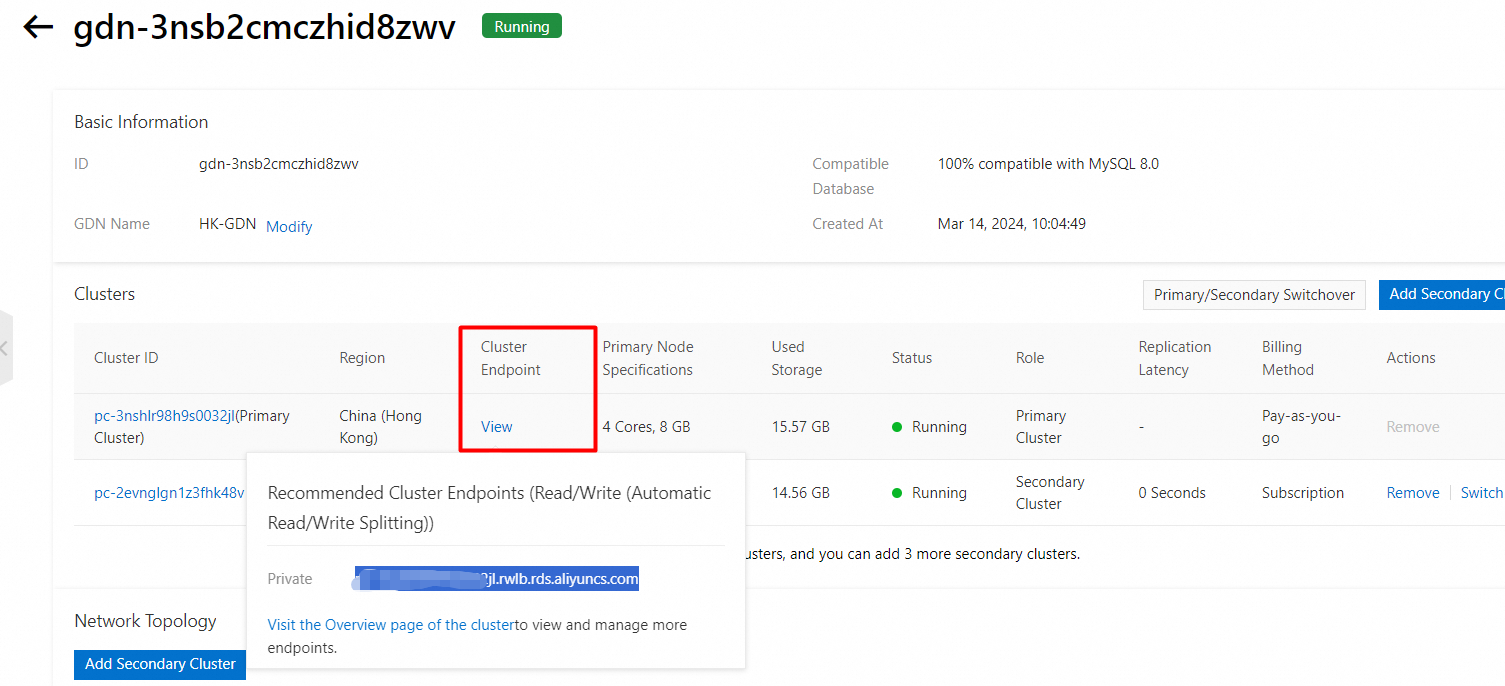
• The endpoint is the private IP address of the primary cluster.
Snapshot of test instance specifications:
Snapshot of the endpoint:
• Transactions per second (TPS): the number of transactions that are performed per second in the database. Only committed transactions are counted.
• Queries per second (QPS): the number of SQL statements that are executed per second in the database, including the INSERT, SELECT, UPDATE, and DELETE statements.
1. Run the following commands on the ECS instance to install Sysbench:
yum install gcc gcc-c++ autoconf automake make libtool bzr mysql-devel git mysql
https://github.com/akopytov/sysbench.git
## Download Sysbench from Github
cd sysbench
## Change the current working directory to Sysbench.

./autogen.sh
## Run autogen.sh.
./configure --prefix=/usr --mandir=/usr/share/man
make
## Compile Sysbench.
make install
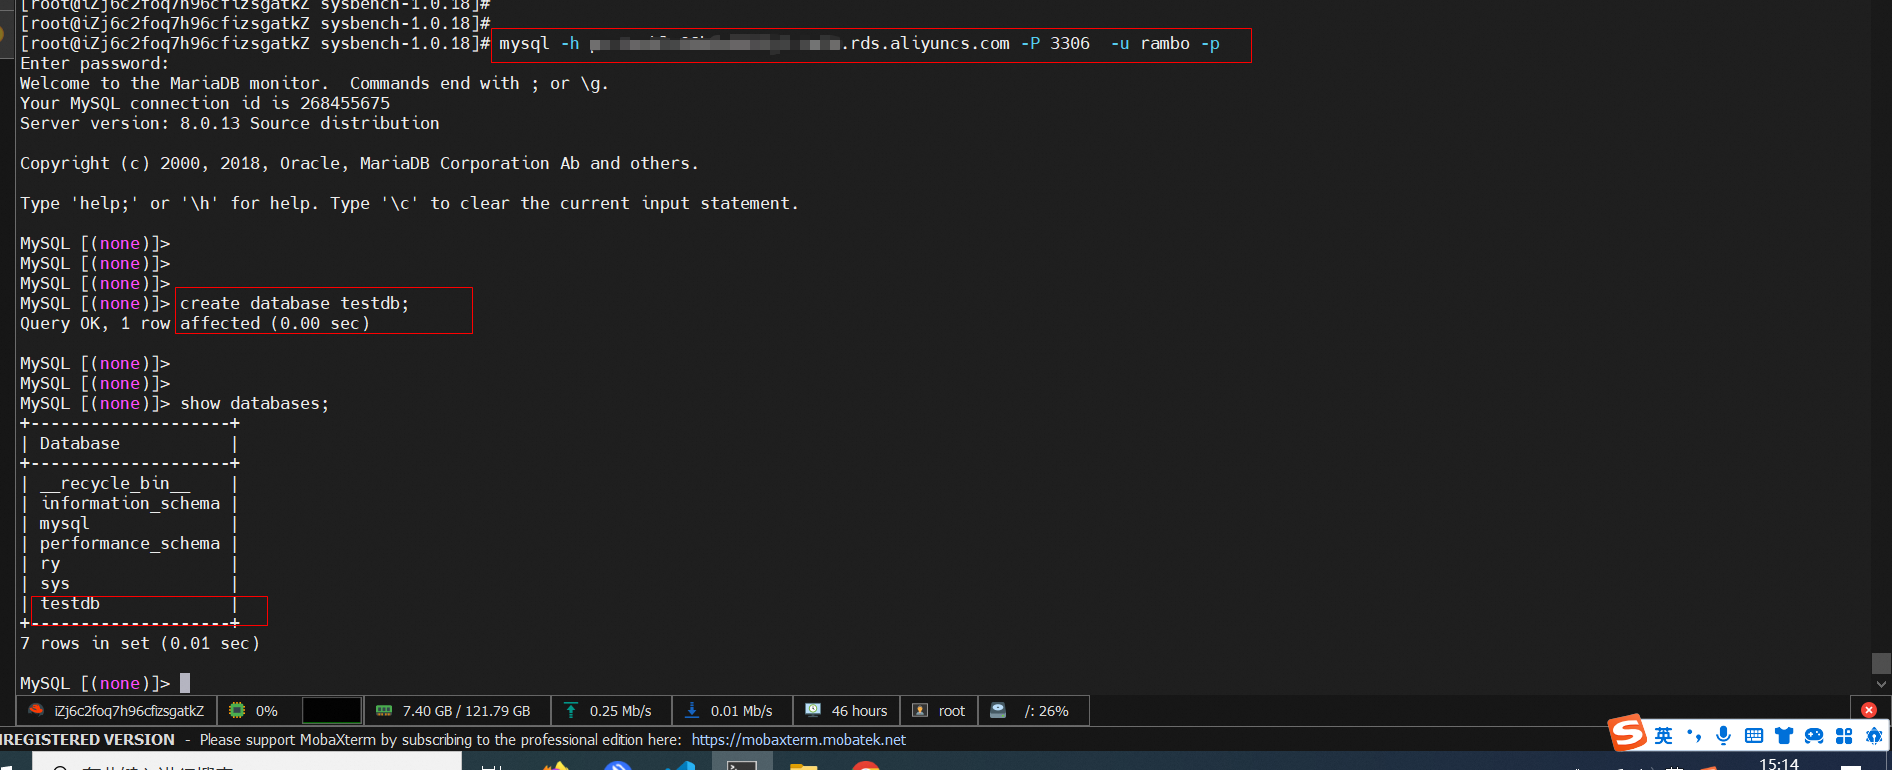
mysql -h xxxxxxxx.aliyuncs.com -P 3306 -u xxxxx -p| Item | Description |
|---|---|
-h |
The cluster endpoint of the PolarDB for MySQL cluster. |
-P |
The port number of the PolarDB for MySQL cluster. |
-u |
The username of the PolarDB for MySQL cluster. |
-p |
The password that is used to log on to the PolarDB for MySQL cluster. |
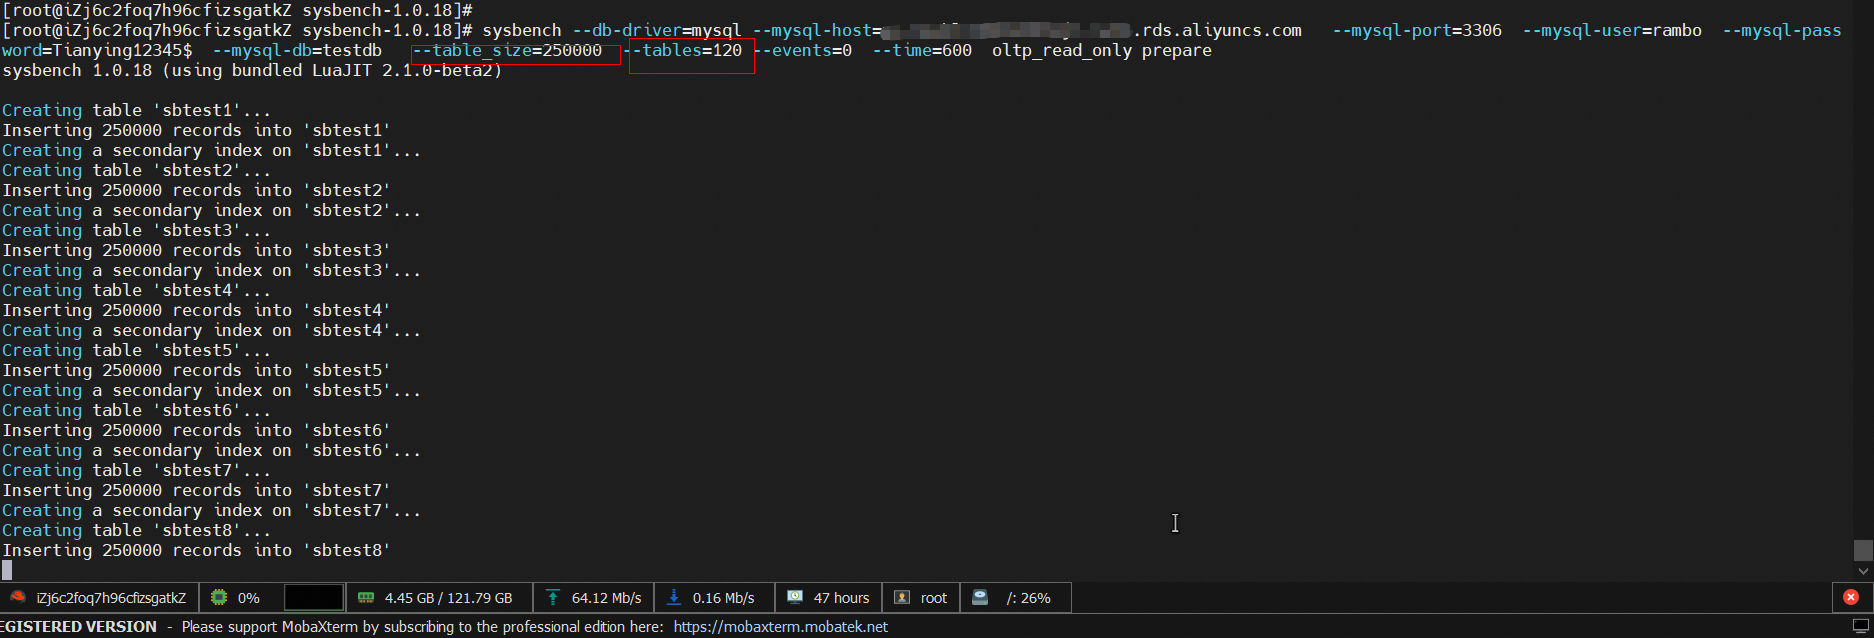
Use Sysbench to load test data to PolarDB for MySQL primary cluster.
sysbench --db-driver=mysql --mysql-host=XXX --mysql-port=XXX --mysql-user=XXX --mysql-password=XXX --mysql-db=sbtest --table_size=25000 --tables=250 --events=0 --time=600  oltp_read_only prepare
## Prepare the test data.
Snapshot of preparing data
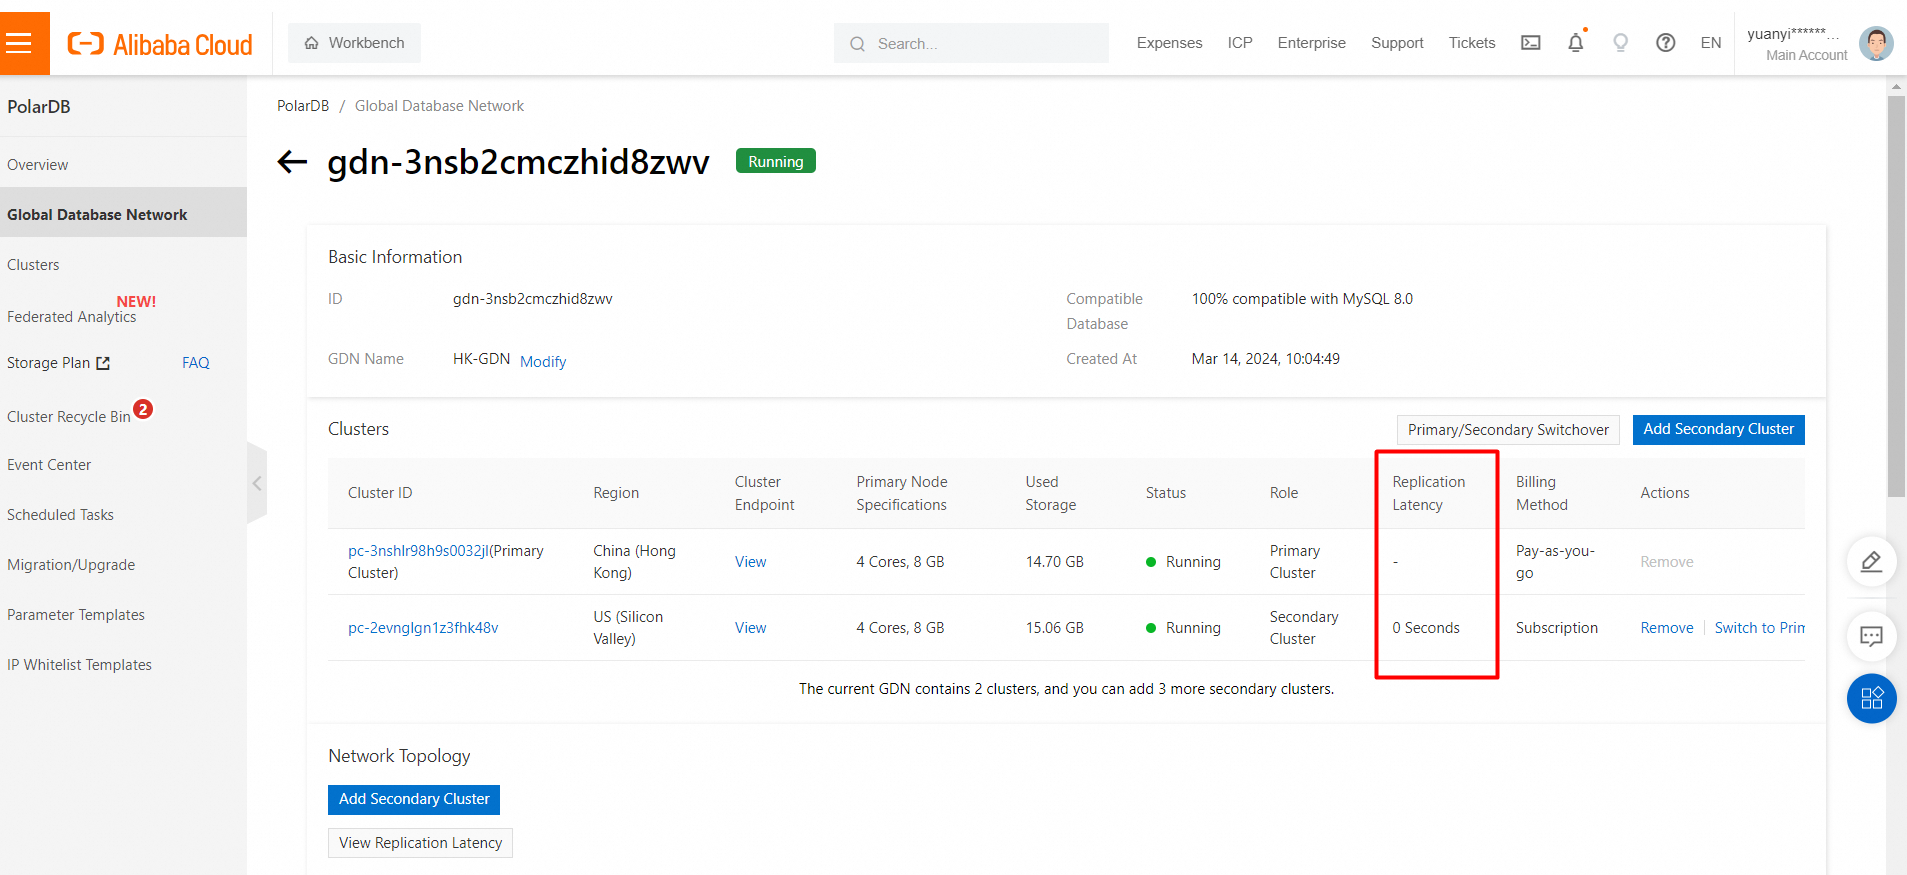
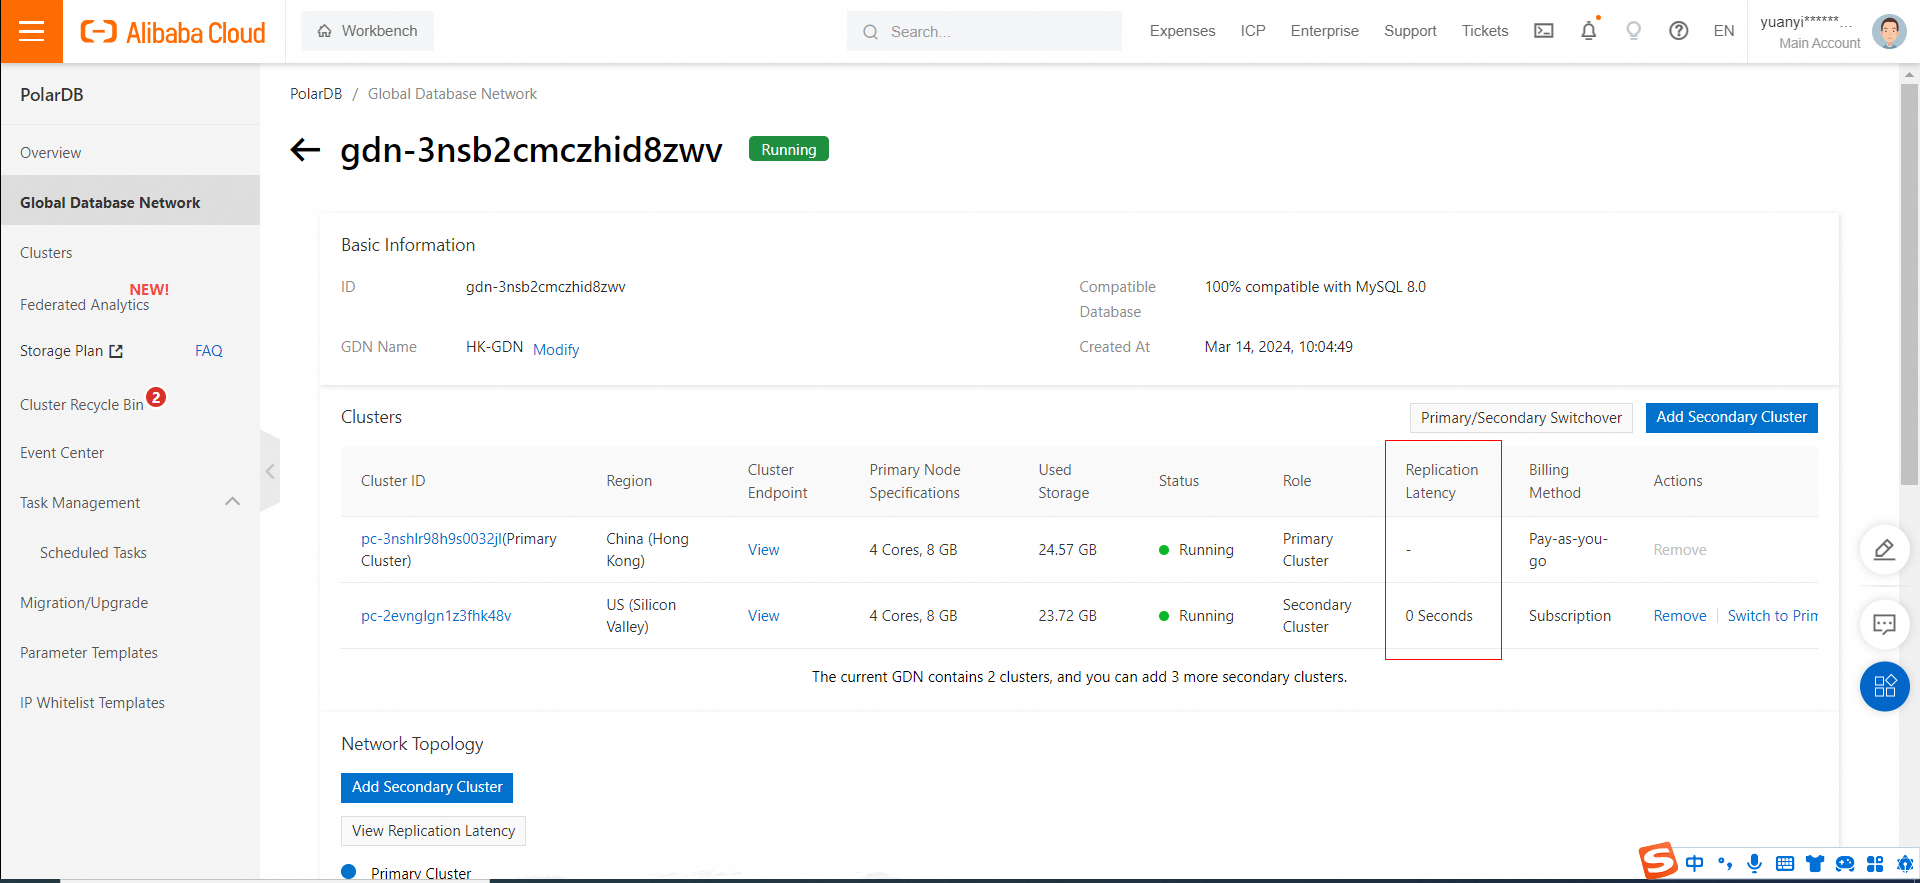
View the GDN synchronization latency
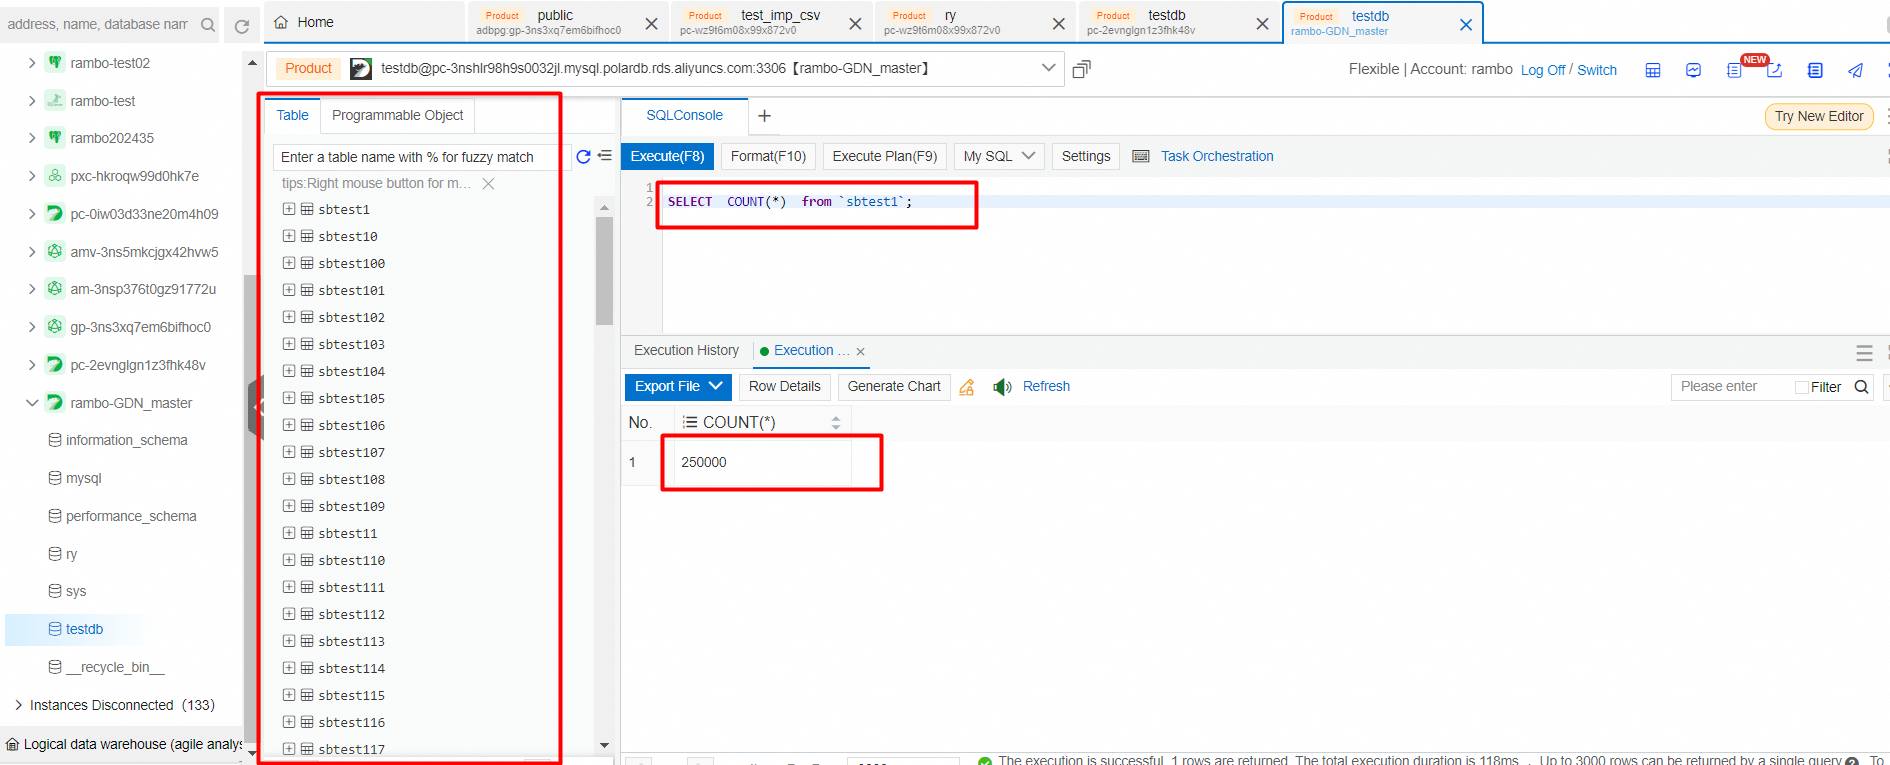
View generated data
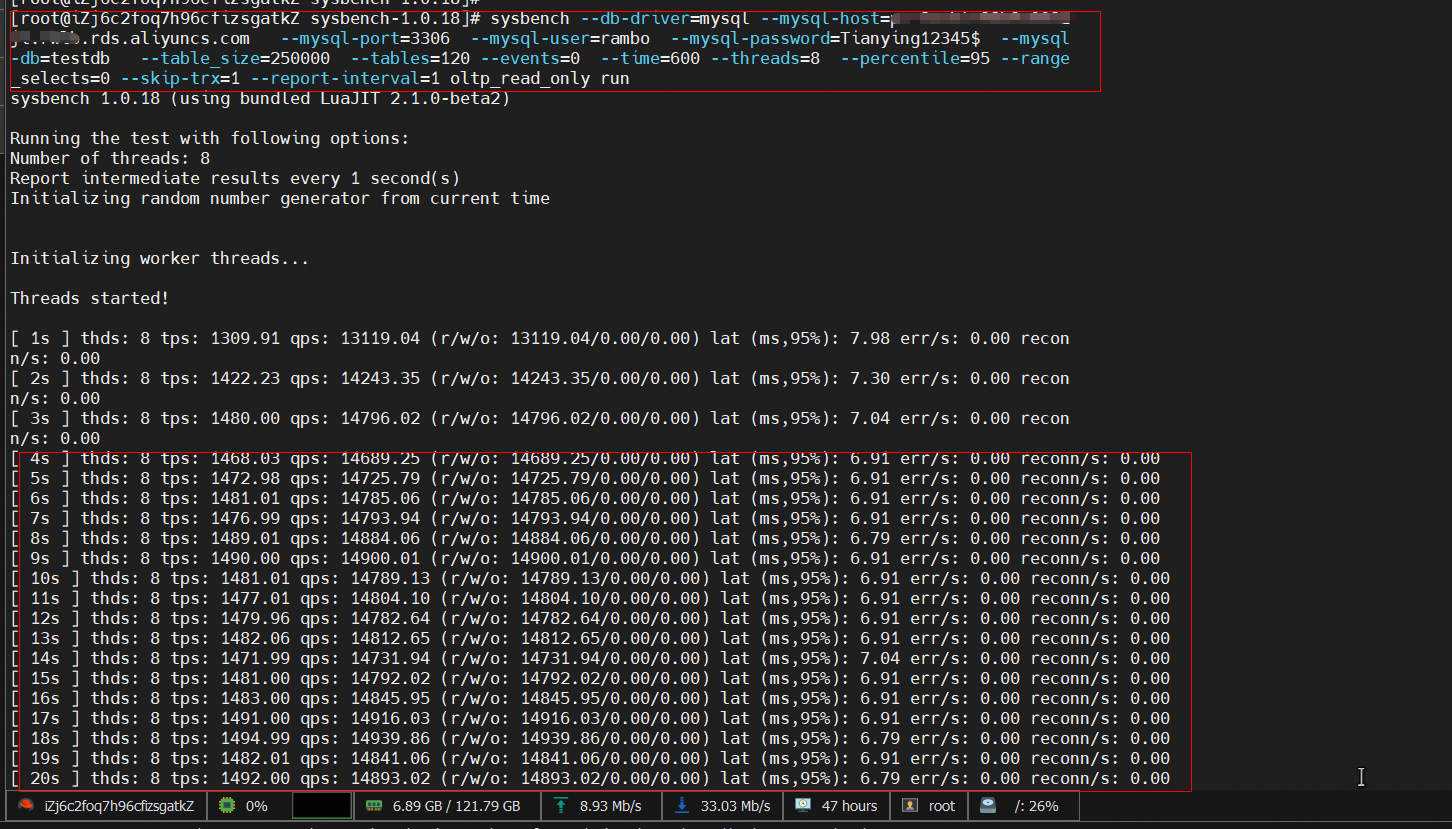
sysbench --db-driver=mysql --mysql-host=XXX --mysql-port=XXX --mysql-user=XXX --mysql-password=XXX --mysql-db=sbtest --table_size=25000 --tables=250 --events=0 --time=600   --threads=XXX --percentile=95 --range_selects=0 --skip-trx=1 --report-interval=1 oltp_read_only run
## Run the workload.
The running process will last about 8 minutes.
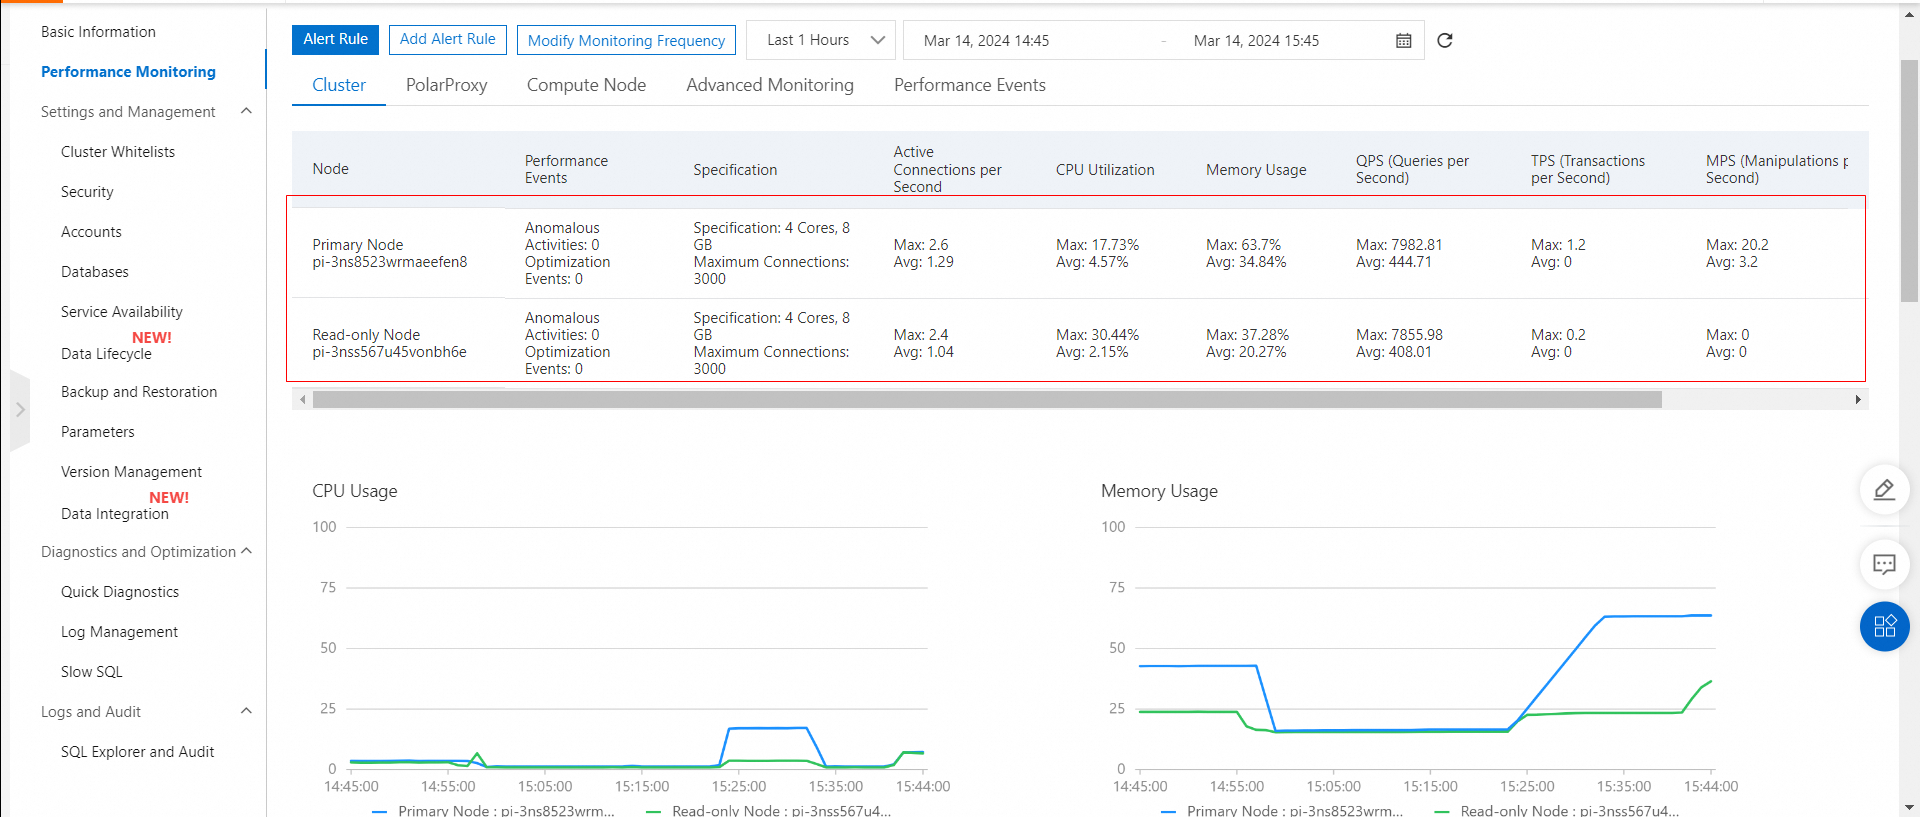
View the performance monitoring of primary and secondary clusters while running a workload.
Performance monitoring of the primary cluster HK
Performance monitoring of the secondary cluster (US Silicon Valley)
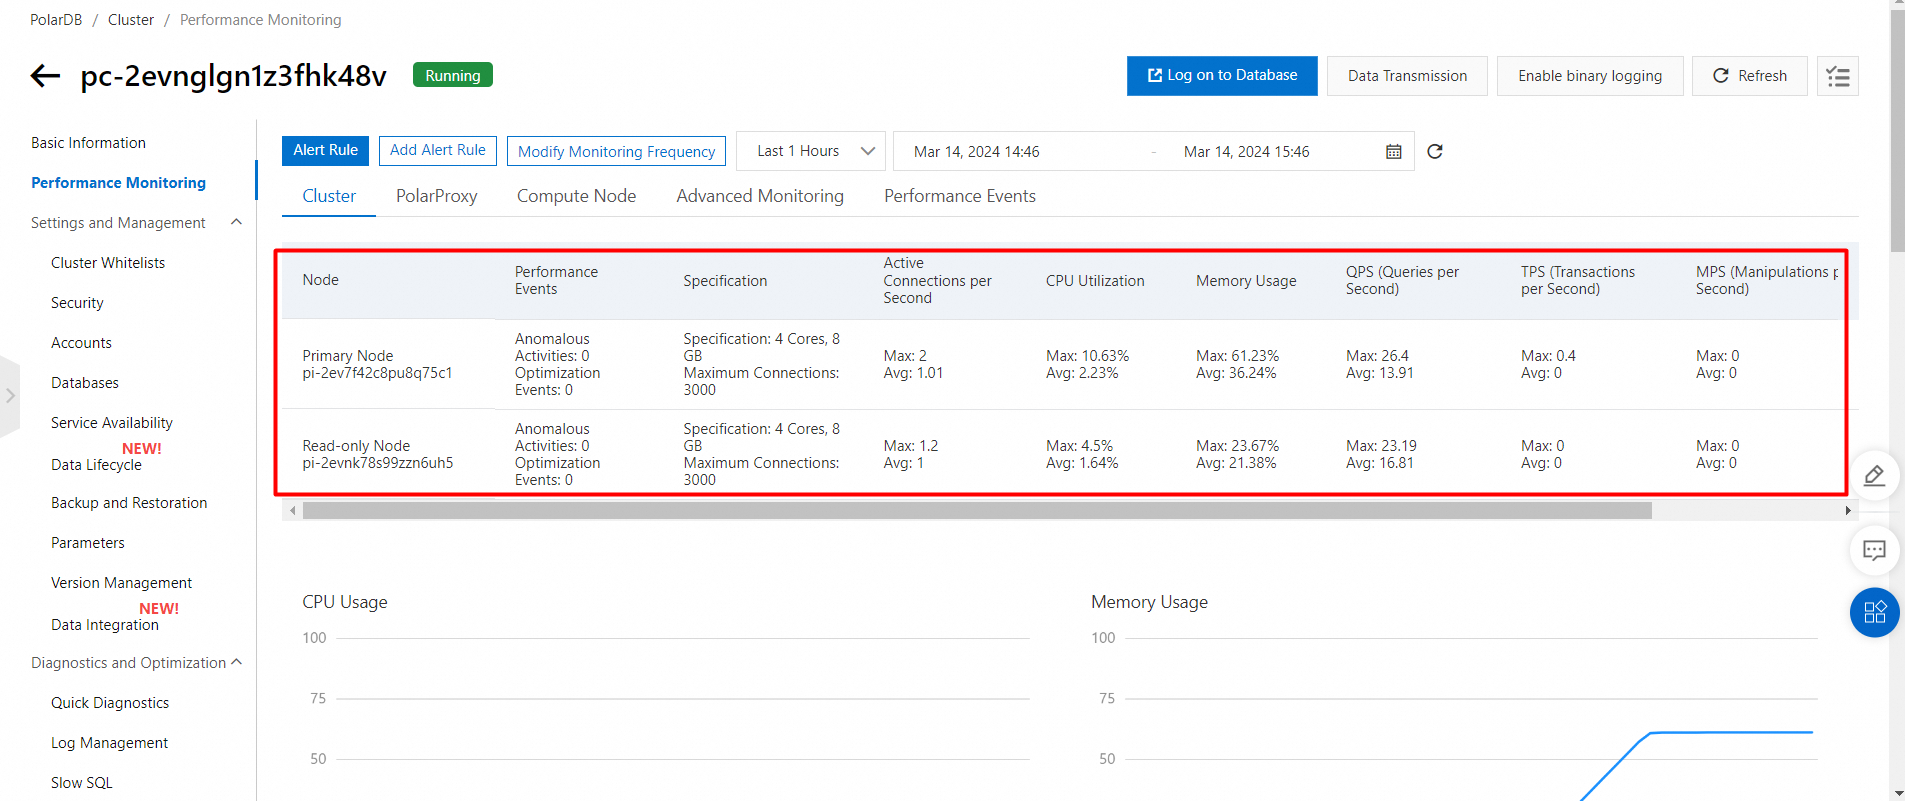
Test the read performance. The results are as follows:
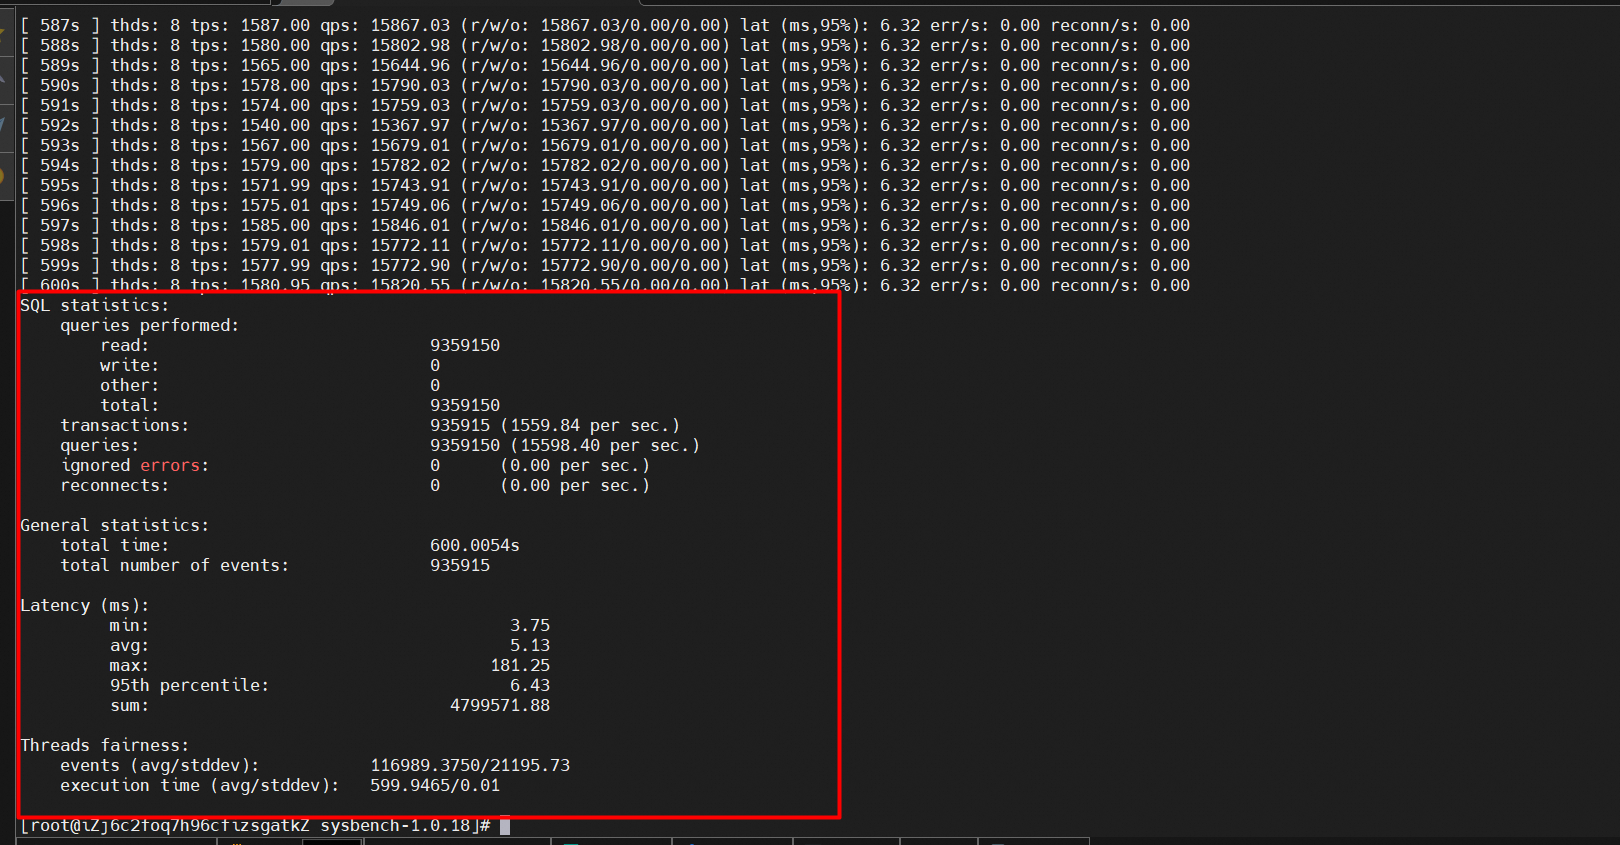
The results of read performance testing are as follows:
• QPS: 15598.40
• Response time (RT): 6.43 ms
sysbench --db-driver=mysql --mysql-host=XXX --mysql-port=XXX --mysql-user=XXX --mysql-password=XXX --mysql-db=sbtest --table_size=25000 --tables=250 --events=0 --time=600   --threads=XXX --percentile=95 --report-interval=1 oltp_write_only run
## Run the workload.
The running process will last about 8 minutes.

View the performance monitoring of primary and secondary clusters while running a workload.
Performance monitoring of the primary cluster HK
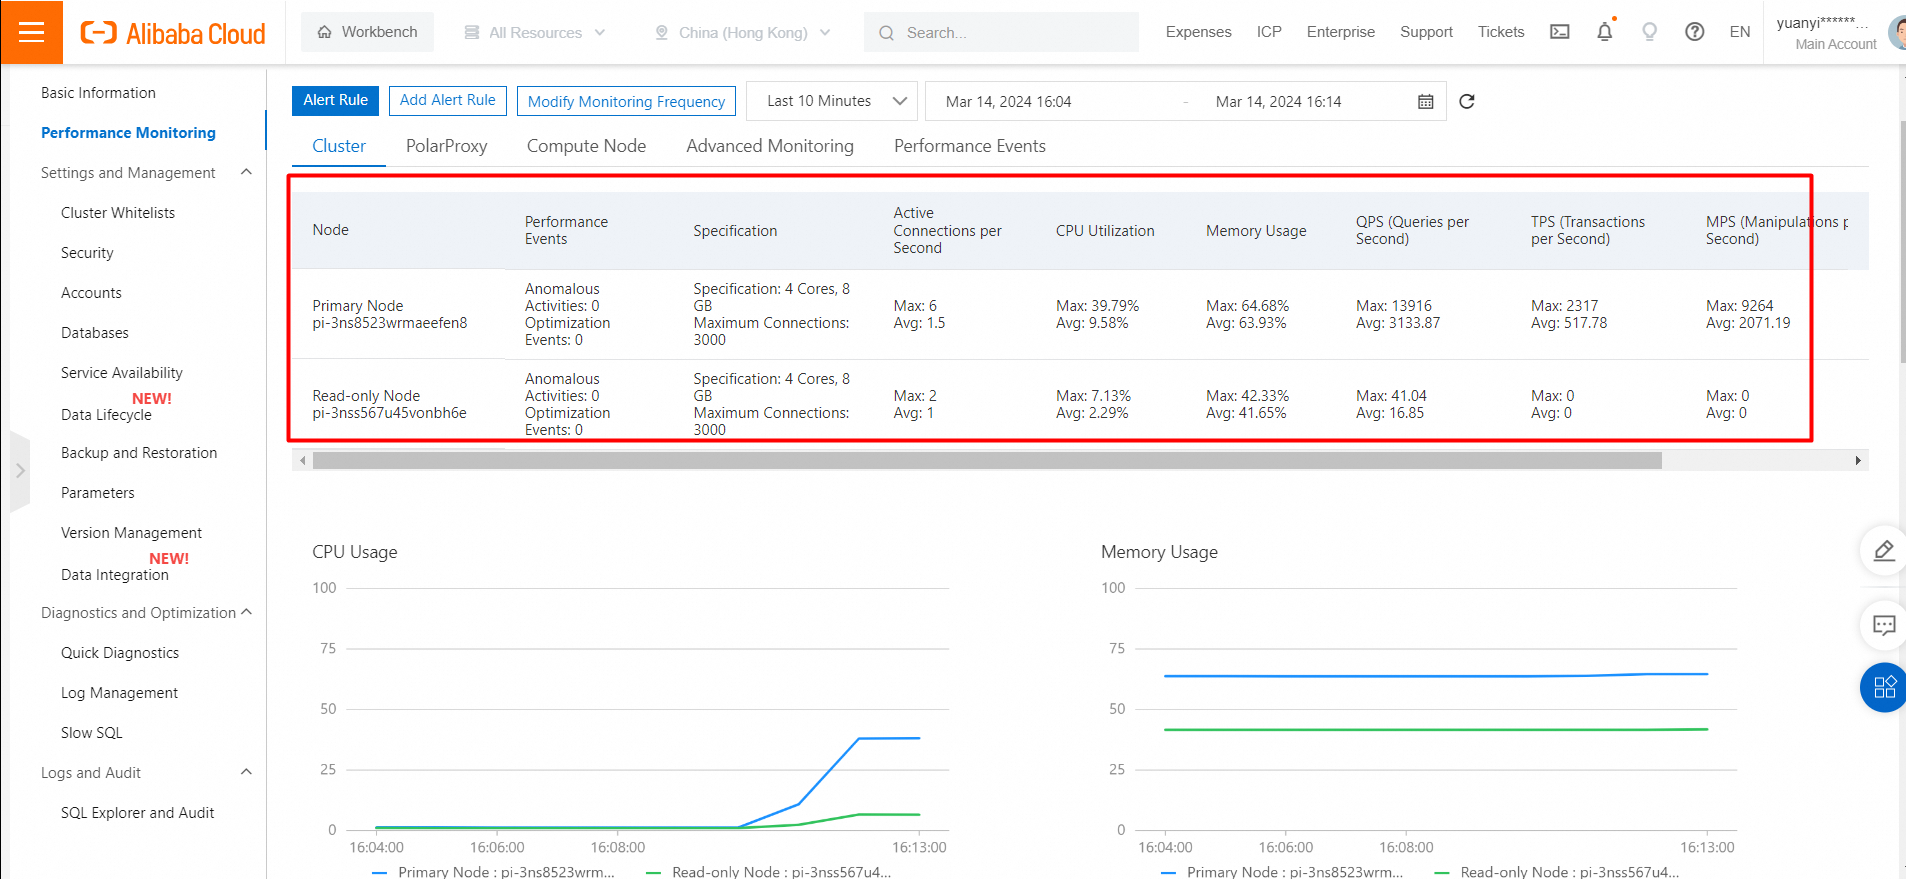
Performance monitoring of the secondary cluster (US Silicon Valley)
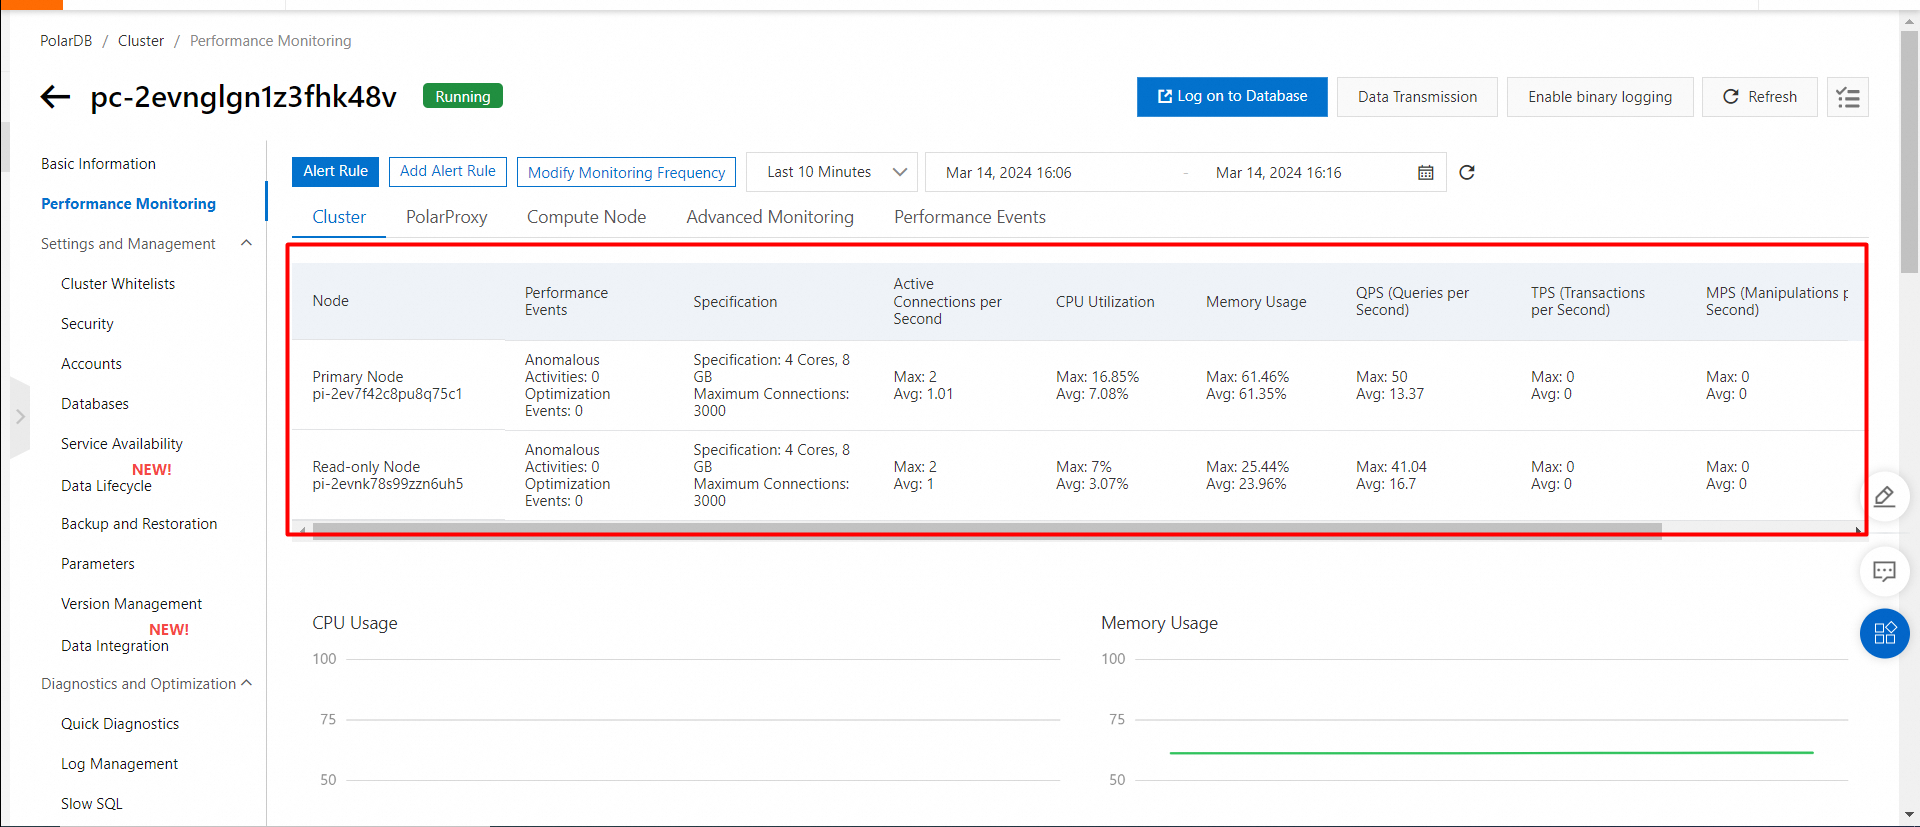
Test the write performance. The results are as follows:
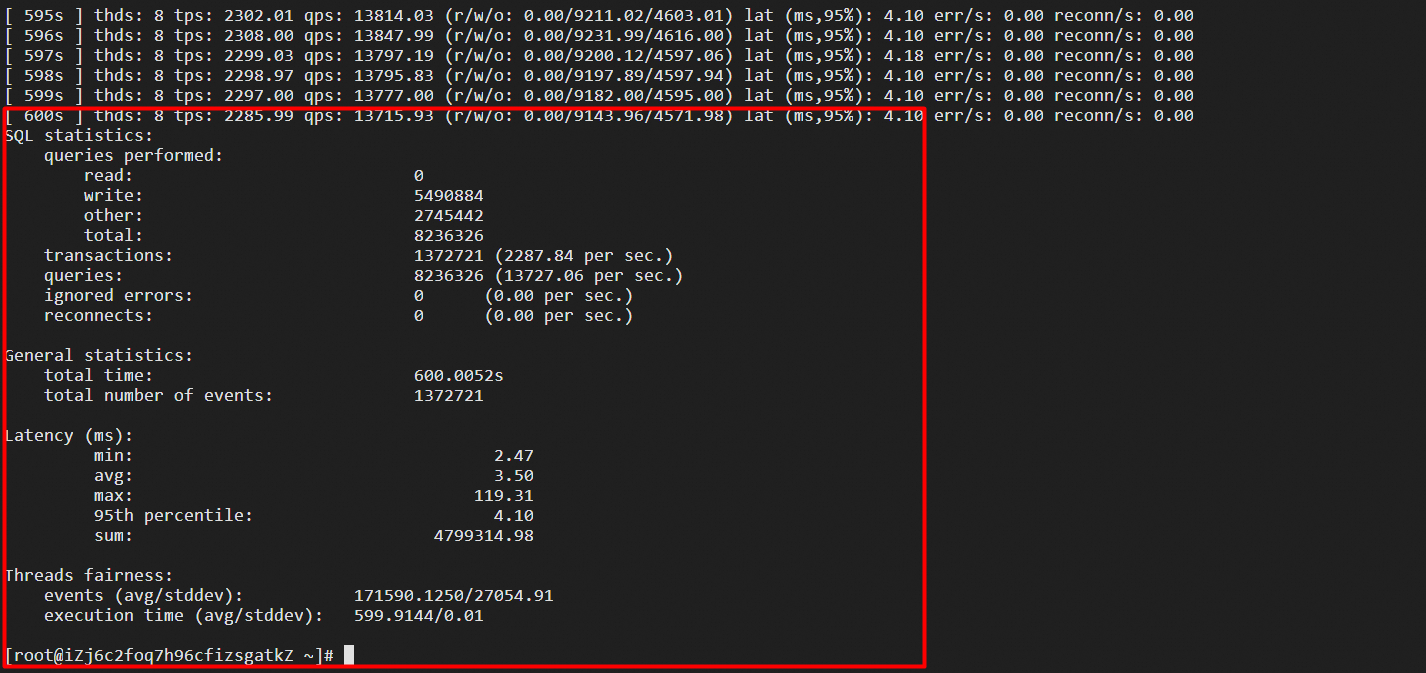
The results of write performance testing are as follows:
• TPS: 2287.84
• Response time (RT): 4.1 ms
• The Elastic Compute Service (ECS) instance and the PolarDB for MySQL cluster used in the test are deployed in the same region (US Silicon Valley).
• The test primary cluster is a Hong Kong node with 4 cores and 8 GB of memory, including one primary node and one read-only node.
• The test secondary cluster is a US Silicon Valley node with 4 cores and 8 GB of memory, including one primary node and one read-only node.
• The endpoint is the internal IP address of the secondary cluster.
Node specifications are the same as above.
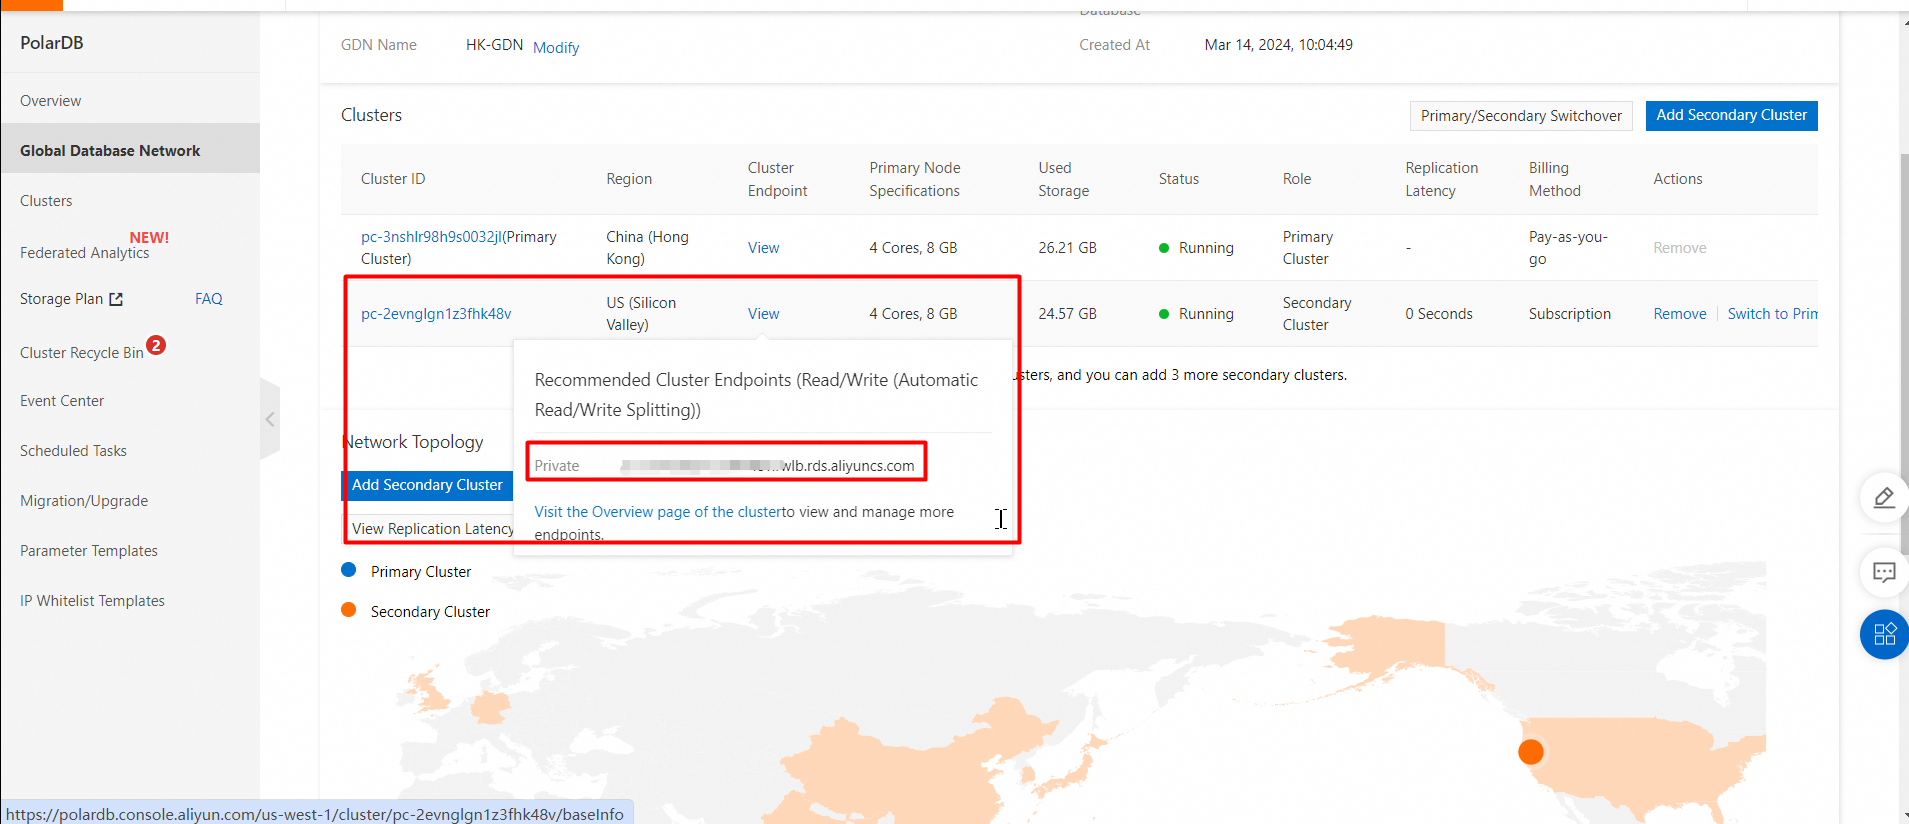
Snapshot of the endpoint:
• Transactions per second (TPS): the number of transactions that are performed per second in the database. Only committed transactions are counted.
• Queries per second (QPS): the number of SQL statements that are executed per second in the database, including the INSERT, SELECT, UPDATE, and DETELE statements.
The steps are the same as those in the preceding section.
mysql -h xxxxxxxx.aliyuncs.com -P 3306 -u xxxxx -p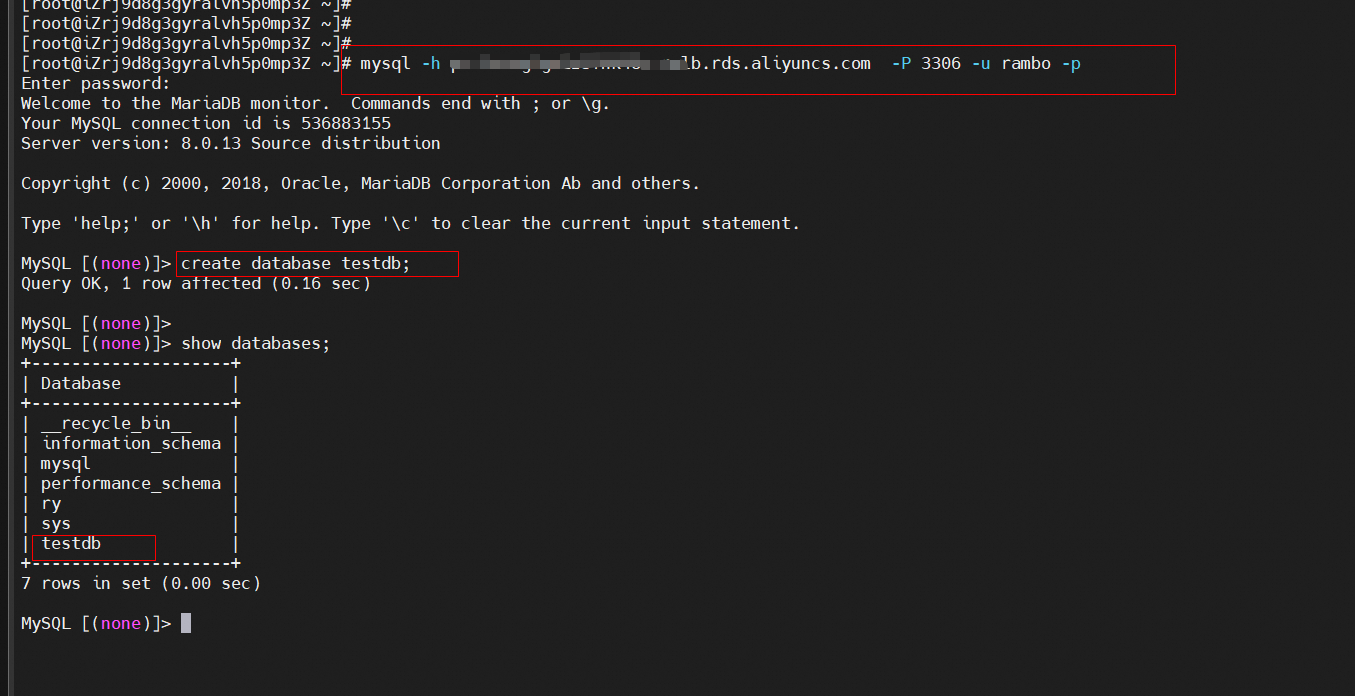
Use Sysbench to load test data to PolarDB for MySQL secondary cluster.
sysbench --db-driver=mysql --mysql-host=XXX --mysql-port=XXX --mysql-user=XXX --mysql-password=XXX --mysql-db=sbtest --table_size=25000 --tables=250 --events=0 --time=600  oltp_read_only prepare
## Prepare the test data.
Snapshot of preparing data:

View the GDN synchronization latency:
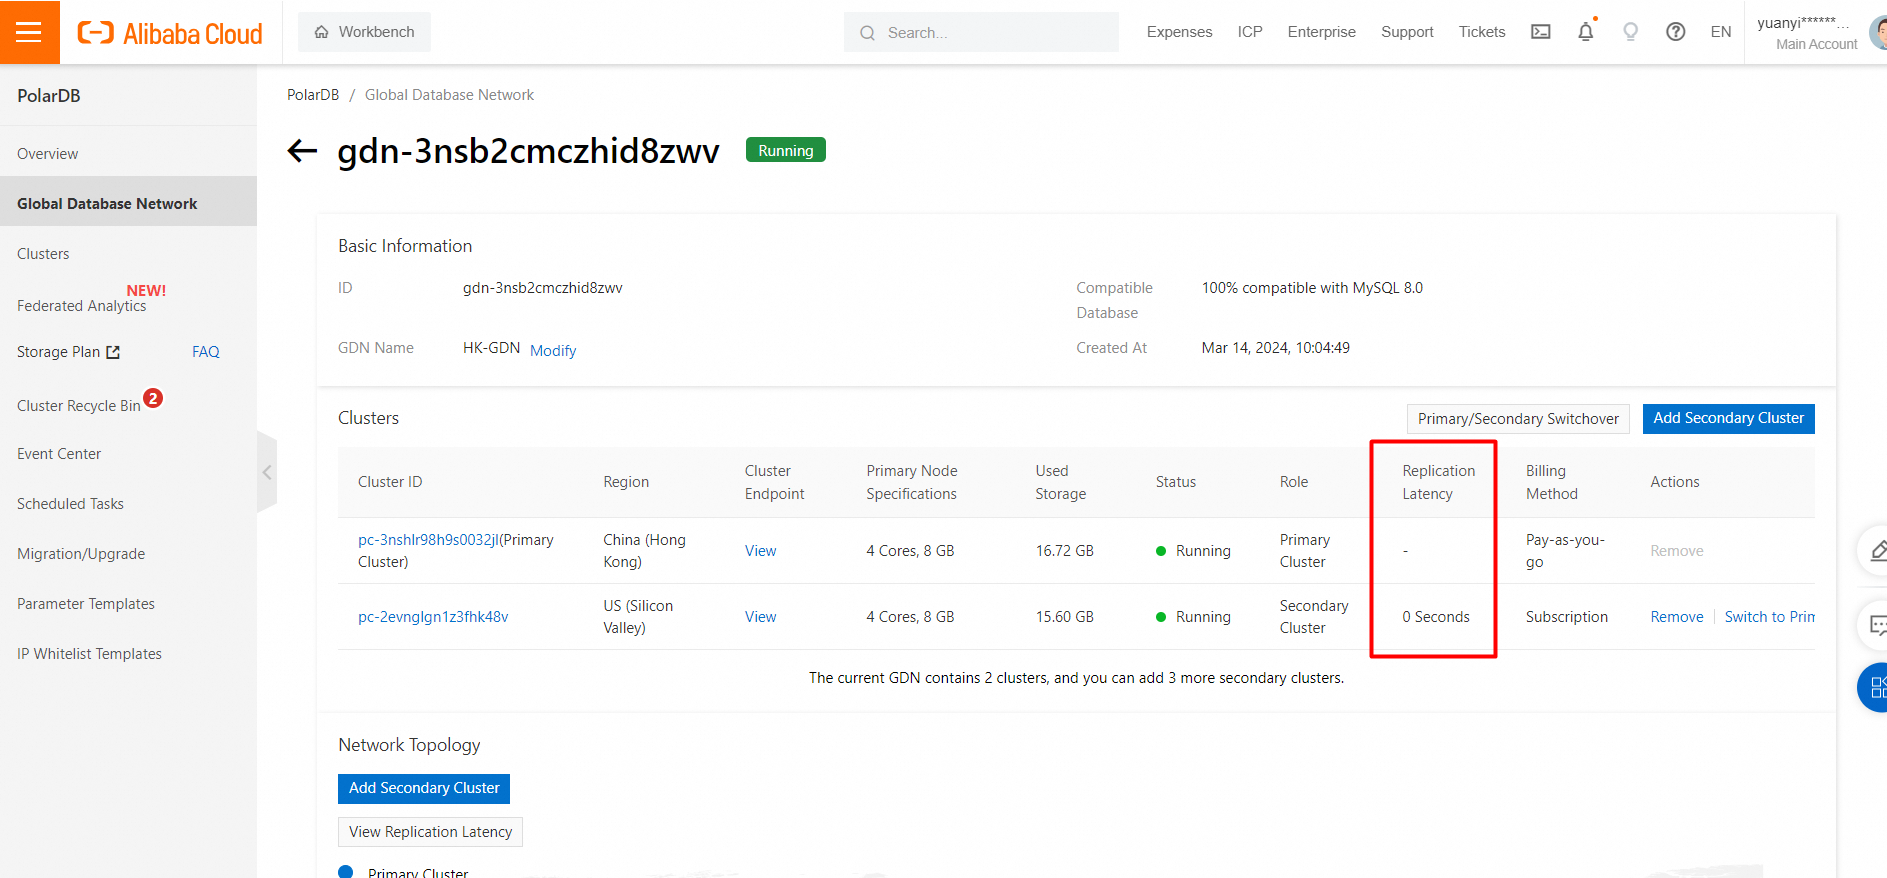
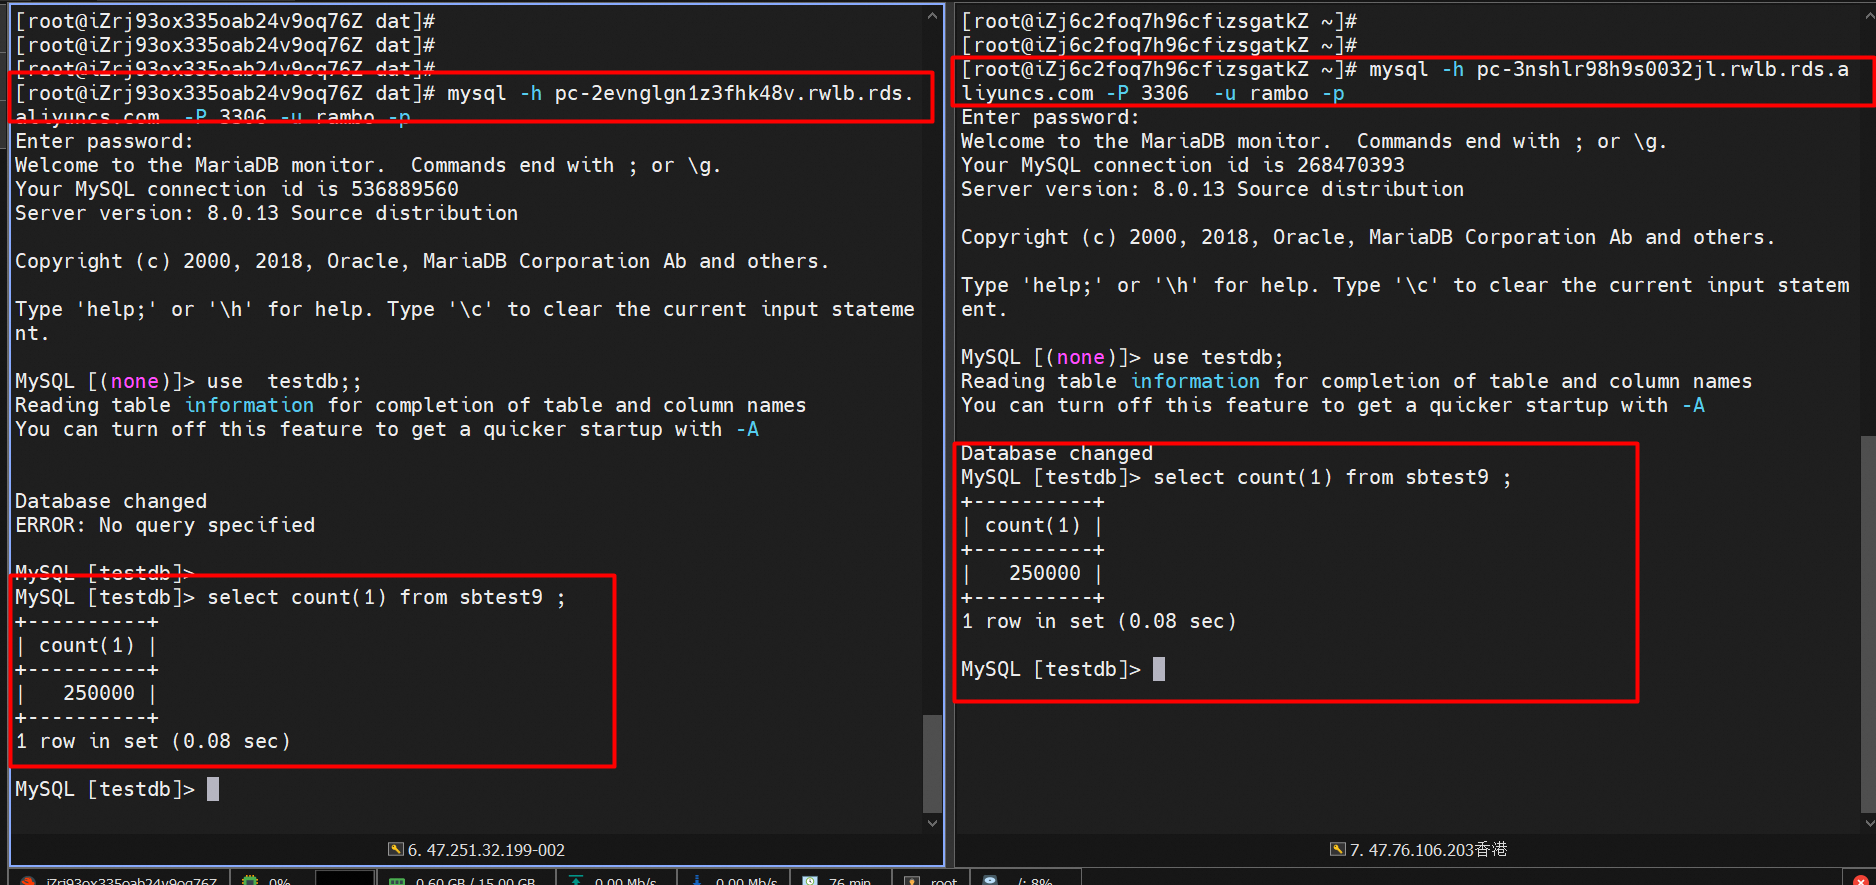
View the snapshot of the data generated and loaded by the primary and secondary clusters:
1. Launch two ECS instances respectively and select the secondary clusters that are in the same region (US Silicon Valley).
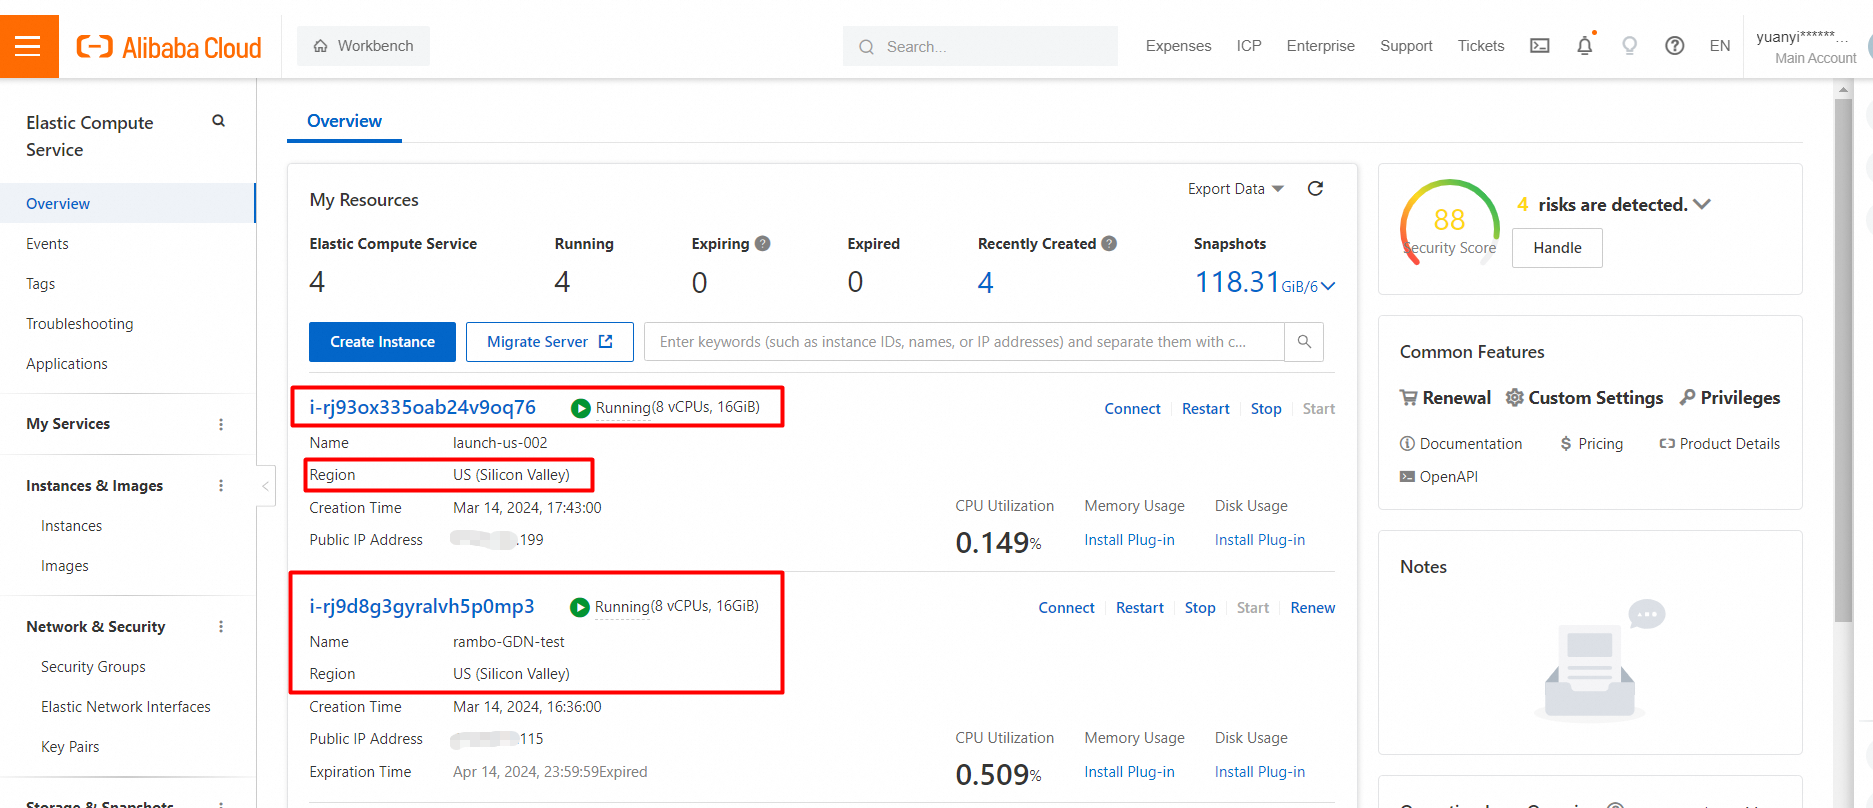
2. Install Sysbench on the two ECS instances and add them to the same VPC of the secondary cluster. The procedure is the same as above.
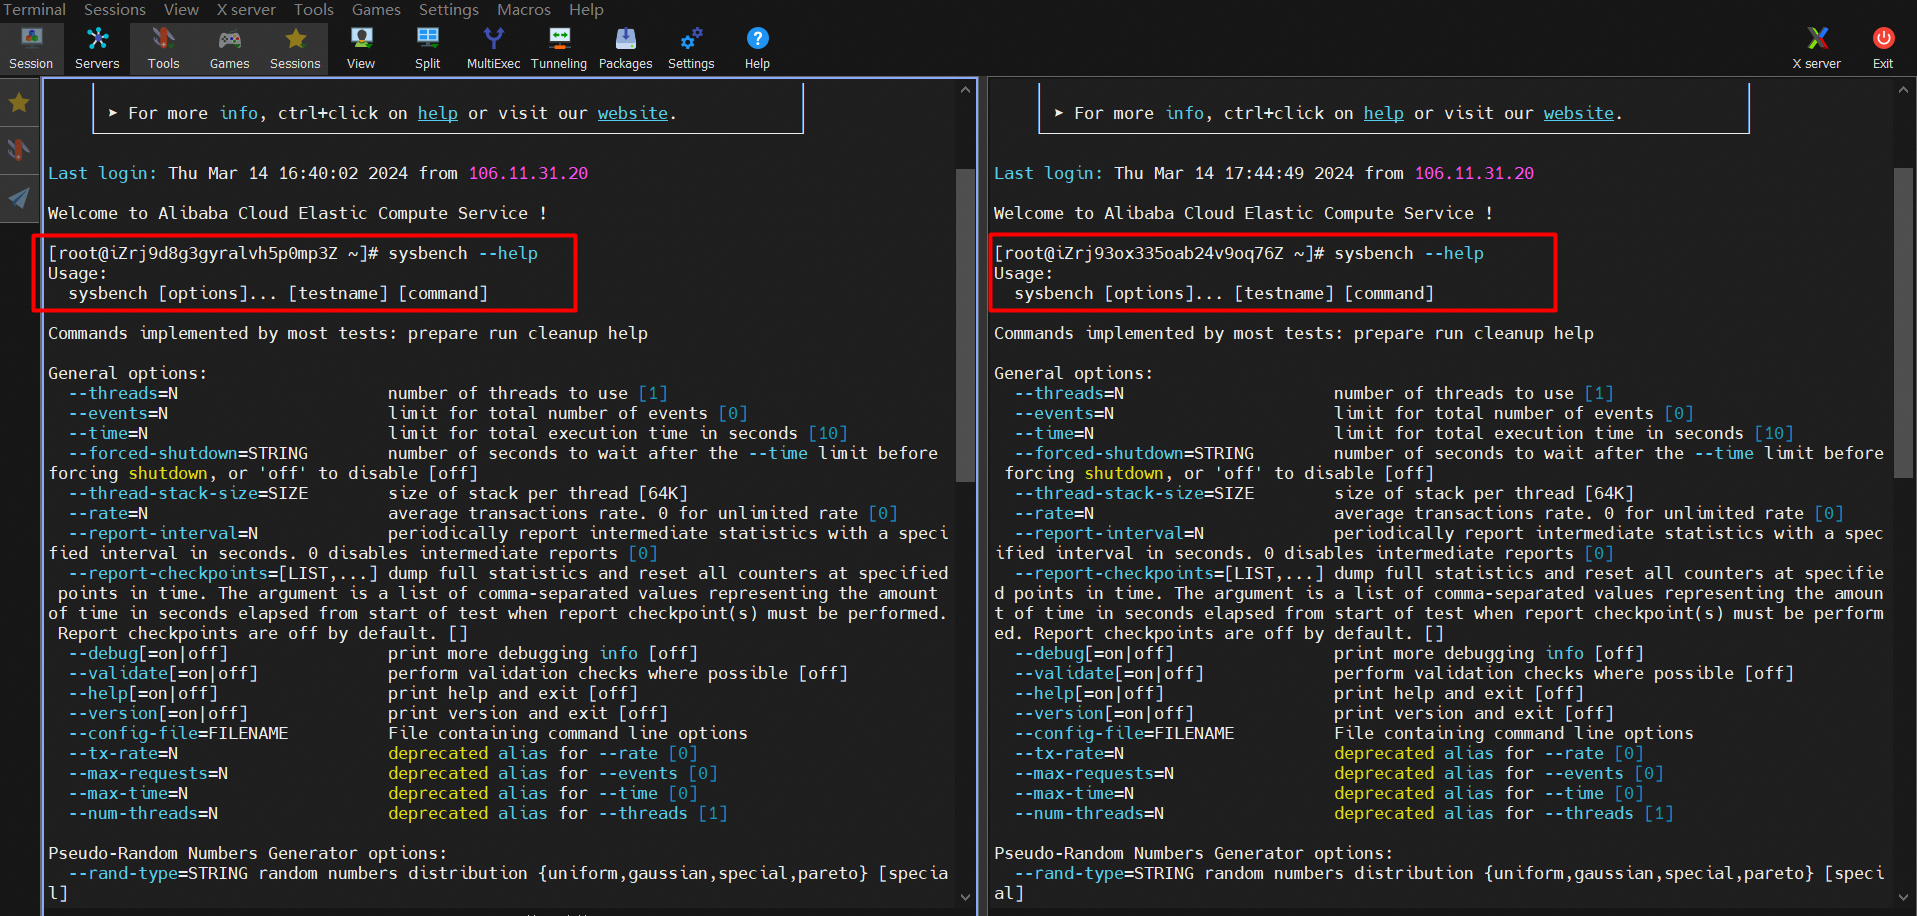
3. Run Sysbench on both ECS instances to test the read and write performance of the secondary cluster.
The command for the read performance testing:
sysbench --db-driver=mysql --mysql-host=XXX --mysql-port=XXX --mysql-user=XXX --mysql-password=XXX --mysql-db=sbtest --table_size=10000 --tables=20 --events=0 --time=60   --threads=32 --percentile=95 --range_selects=0 --skip-trx=1 --report-interval=1 oltp_read_only run
## Run the workload.
The command for the write performance testing:
sysbench --db-driver=mysql --mysql-host=XXX --mysql-port=XXX --mysql-user=XXX --mysql-password=XXX --mysql-db=sbtest --table_size=10000 --tables=20  --events=0 --time=60   --threads=32 --percentile=95 --report-interval=1 oltp_write_only run
## Run the workload.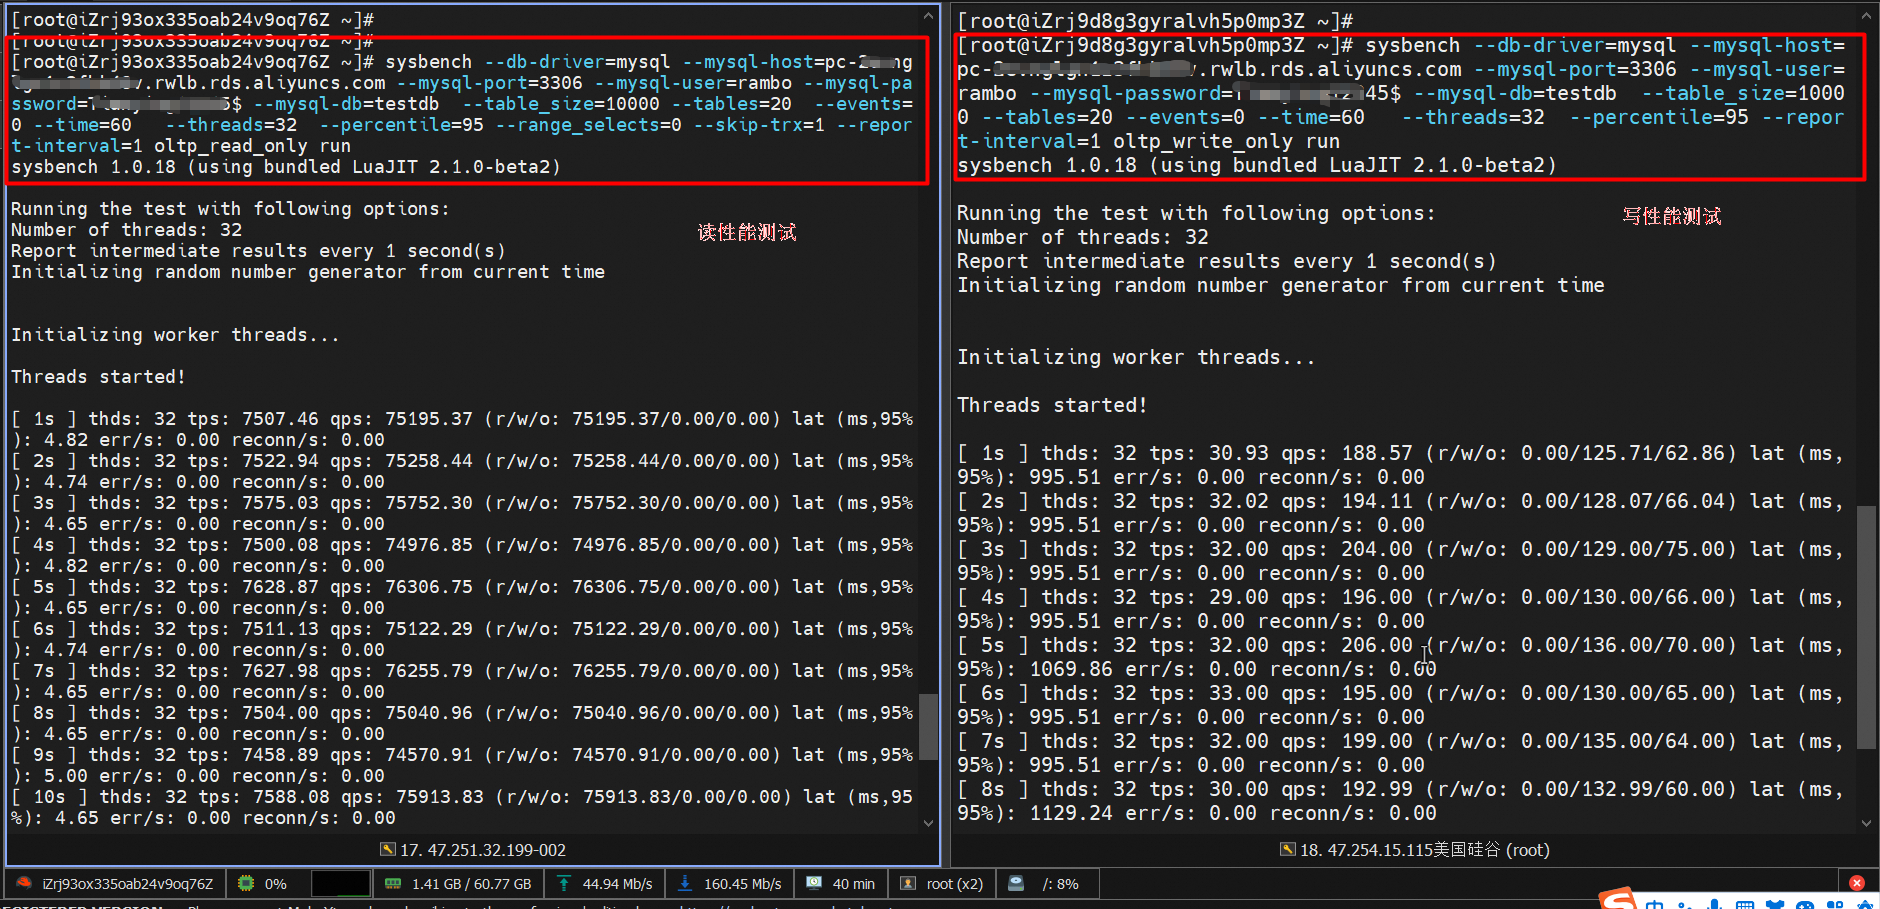
Snapshot of test results:
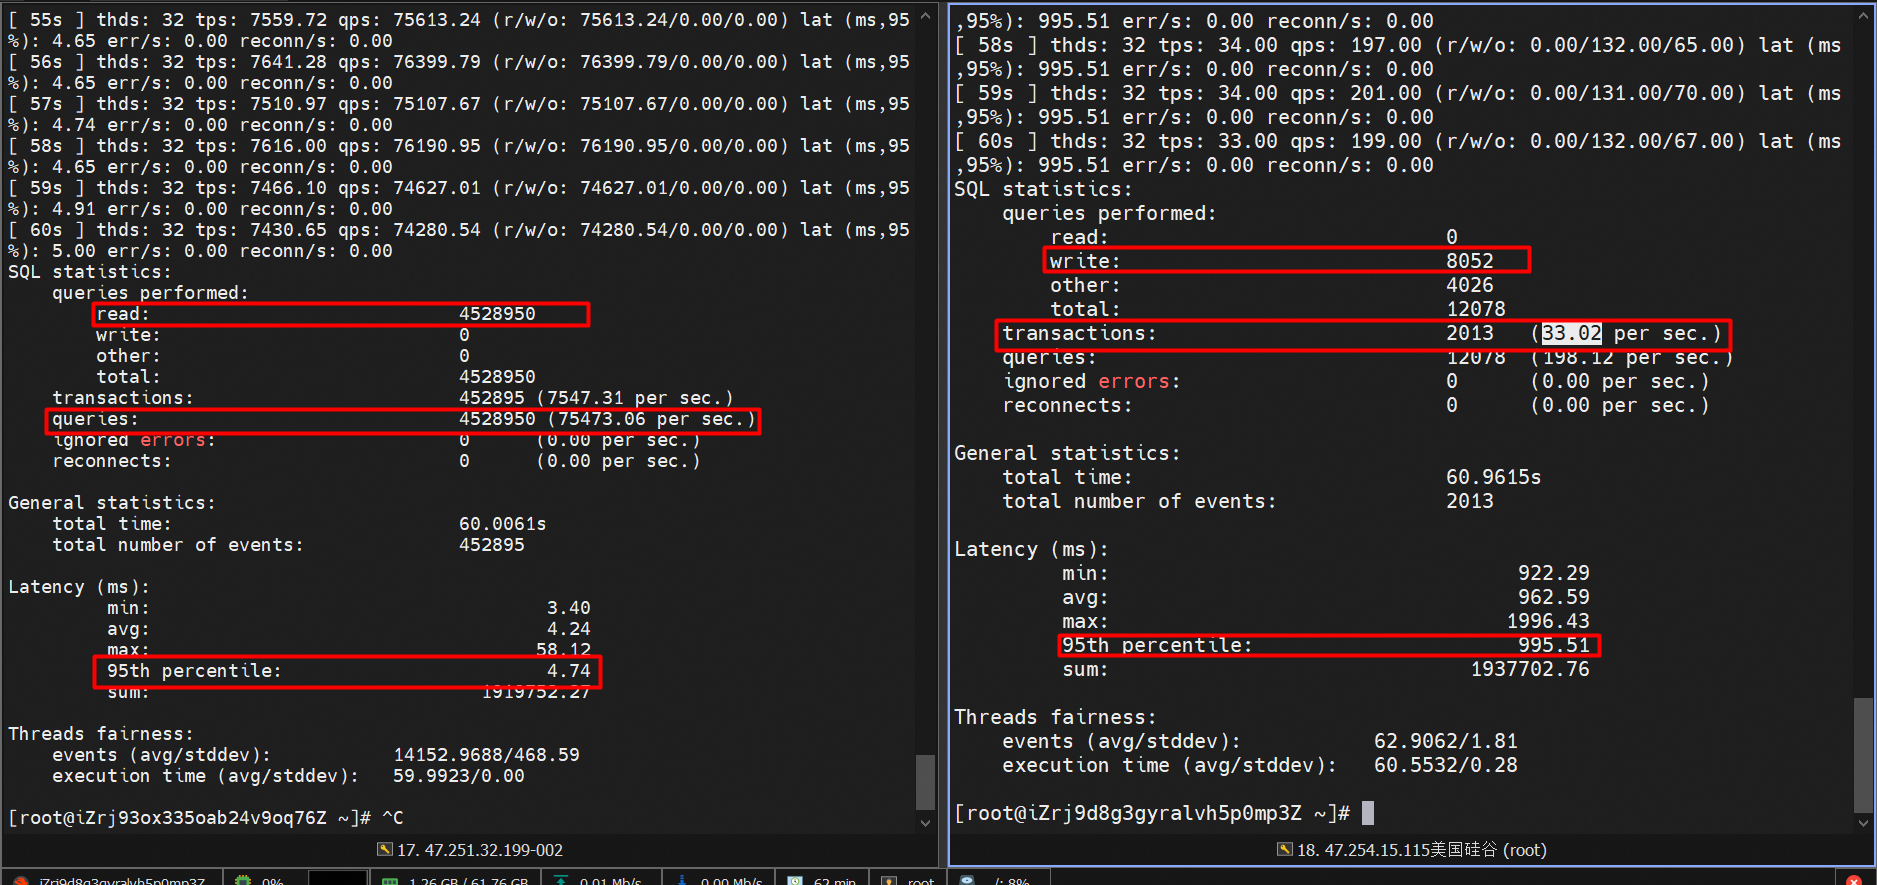
The results of read performance testing are as follows:
• QPS: 75473.06
• Response time (RT): 4.74 ms
The results of write performance testing are as follows:
• TPS: 33.02
• Response time (RT): 995.51 ms
Latency snapshots during read/write performance testing:
# Read workload
import mysql.connector
import sys
import os
import logging
import time
import datetime


def do_check_time():
    conn = mysql.connector.connect(
        host='xxxxxxxxx.rds.aliyuncs.com',
        # host='xxxxxxxxxxxxxxx.rds.aliyuncs.com',
        port=3306,
        user='xxxxxx',
        password='xxxxxxxx')
    if not conn:
        logging.info("get connect fail")
        assert False
    i = 1
    total_difference = 0

    delayed = ''

    sum = 0

    avg_delayed = ''
    print("################################################################################################")
    print("\t \t Output as \t hour : minutes : seconds : millisecond")
    print("##########################################Reader data###########################################")
    print()

    with open('delayed.log', 'a') as file:
        file.write("################################################################################################\n \t Output as \t hour : minutes : seconds : millisecond" +
                   "\n##########################################Reader data###########################################\n")

    while i <= 100:
        sqlstmt = "select insert_at from sbtest.test  where id={}".format(i)
        cursor = conn.cursor(dictionary=True)
        cursor.execute(sqlstmt)
        for insert_at in cursor:
            total_difference = 0
            if len(insert_at) == 0:
                print("wait")
            else:
                i += 1
                print("insert_at: ", insert_at)
                result = datetime.datetime.now()-insert_at['insert_at']

                # sum = result.total_seconds()

                sum = sum + result.total_seconds()
                delayed = str(result)

                avg_delayed = sum/100
                avg_delayed = str(avg_delayed)

                print('Read delayed:\t' + str(result) + " ms")

                print('total_delayed ' + str(sum) + " S")

                with open('delayed.log', 'a') as file:
                    file.write("Read delayed:  "+delayed+" ms"+'\n')

    print("########################################## Reader data  End #####################################")
    print()

    print('total_delayed :'+str(sum)[0:7]+' S')
    print('avg_delayed  :'+avg_delayed[0:6] + ' S')

    with open('delayed.log', 'a') as file:
        file.write("###################################### Reader data  End ###############################################"+'\n'
                   + '\t'+"Total_delayed: "+str(sum)[0:5]+' S \n' +
                    + '\t'+'avg_delayed: '+str(avg_delayed)[0:5]+' S'+'\n\n')

    cursor.close()


if __name__ == "__main__":
    do_check_time()
# Insert workload script
#!/bin/sh
HOST=xxxxxxxx.aliyuncs.com
PORT=3306
USER=admin
PASSWORD=xxxxxxx
echo "create table test"
mysql -h$HOST -P$PORT -u$USER -p$PASSWORD -e"use sbtest;create table test(id int primary key, insert_at TIMESTAMP(6));"
i=1
while ((i <= 100))
do
CMD="use sbtest;insert into test values($i, CURRENT_TIMESTAMP(6));"
echo $CMD
mysql -h$HOST -P$PORT -u$USER -p$PASSWORD -e"$CMD"
((i++))
sleep 1
doneVideo of test results:
https://csv-imput.oss-cn-shenzhen.aliyuncs.com/video/delayed_test.mp4
Script output:
Migrate Data from a Self-managed SQL Server 2012 to an ApsaraDB RDS for SQL Server Instance
ApsaraDB - November 12, 2024
ApsaraDB - May 29, 2023
ApsaraDB - May 29, 2025
ApsaraDB - July 15, 2025
ApsaraDB - June 19, 2024
ApsaraDB - August 9, 2022
 PolarDB for PostgreSQL
Alibaba Cloud PolarDB for PostgreSQL is an in-house relational database service 100% compatible with PostgreSQL and highly compatible with the Oracle syntax.
Learn More PolarDB for Xscale
Alibaba Cloud PolarDB for Xscale (PolarDB-X) is a cloud-native high-performance distributed database service independently developed by Alibaba Cloud.
Learn More Elastic High Performance Computing Solution
High Performance Computing (HPC) and AI technology helps scientific research institutions to perform viral gene sequencing, conduct new drug research and development, and shorten the research and development cycle.
Learn More PolarDB for MySQL
Alibaba Cloud PolarDB for MySQL is a cloud-native relational database service 100% compatible with MySQL.
Learn MoreMore Posts by ApsaraDB