You can adjust probe feature switches, sampling policies, and other common settings on the Custom Configuration tab.
Access the feature
On the homepage of Serverless App Engine (SAE), navigate to Applications.
Select the application and click on its name.
Navigate to Application Monitoring.
Click the Configuration tab.
Select Custom Configurations in the drop-down menu.
Sampling settings
In the Sampling Settings section, you can configure a sampling policy for the traces. Currently, Go applications support fixed-rate sampling. Additionally, they support full sampling configured by interface name, interface prefix, and interface suffix.

Agent switch settings
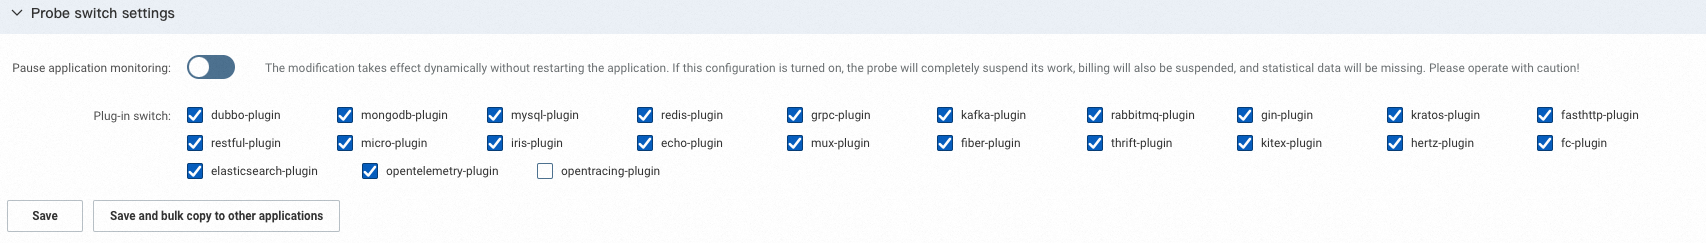
In the Probe switch settings section, you can enable or disable application monitoring and select the plug-ins that you want to use.
The enabling or disabling of application monitoring takes effect immediately without the need to restart the application. If you disable application monitoring, the system cannot monitor the application. Proceed with caution.
If you modify a plug-in switch, you must manually restart the application to ensure that the modification takes effect.
Runtime switch settings
In the Runtime switch settings section, you can enable or disable runtime monitoring. For more information, see Runtime Monitoring.
The modification takes effect dynamically without the need to restart the application. If you disable runtime monitoring, ARMS will not collect runtime metrics. Proceed with caution.

Application log association settings
In the Application log Association configuration section, you can configure a log source that you want to associate with the application, and specify whether to automatically print TraceId and SpanId in logs. For more information, see Associate trace IDs with logs for a Go application.

URL convergence settings
In the URL convergence Settings section, you can enable or disable convergence, and specify a convergence threshold and convergence rules. URL convergence displays similar URLs as a single object. For example, URLs prefixed with /service/demo/ are displayed as an object. The convergence threshold is the minimum number of URLs that can trigger URL convergence. For example, if the threshold is set to 100, URLs are converged only when 100 URLs meet the regular expression of the rule. For more information, see ARMS convergence policies.

Ongoing profiling settings
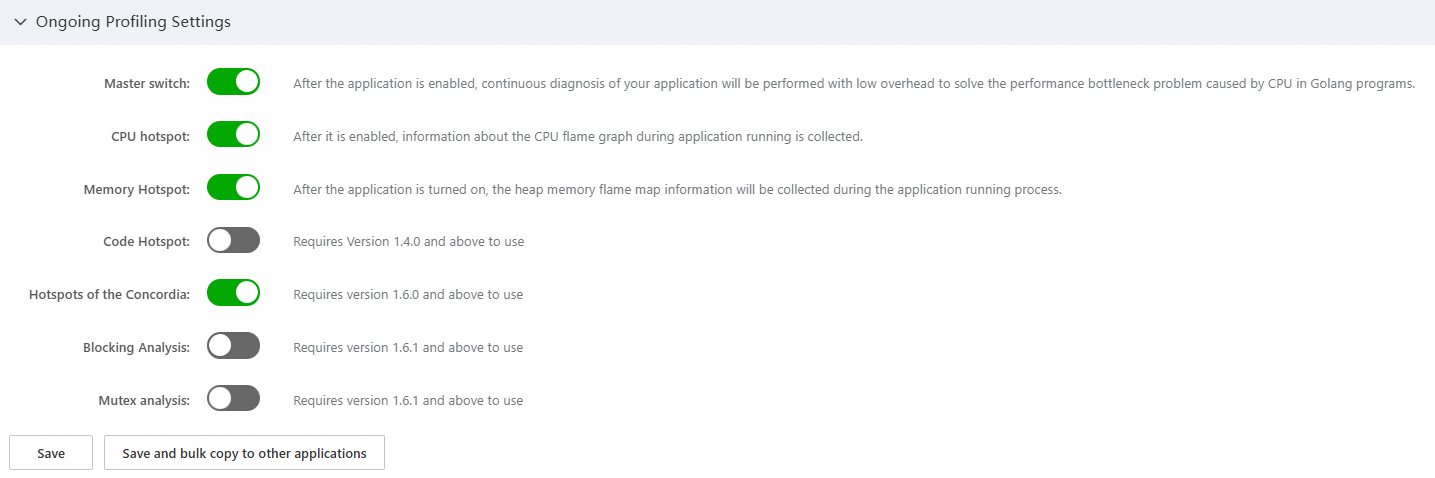
In the Ongoing Profiling Settings area, enable the main switch to see sub-switches including CPU Hotspot, Memory Hotspot, Code Hotspot, Hotspots of the Concordia, Blocking Analysis, and Mutex analysis. For more information, see Go application continuous profiling.
Interface call settings
In the Interface call configuration section, you can specify a threshold for slow calls, and configure the HTTP status code whitelist and the invalid interface filtering policy.
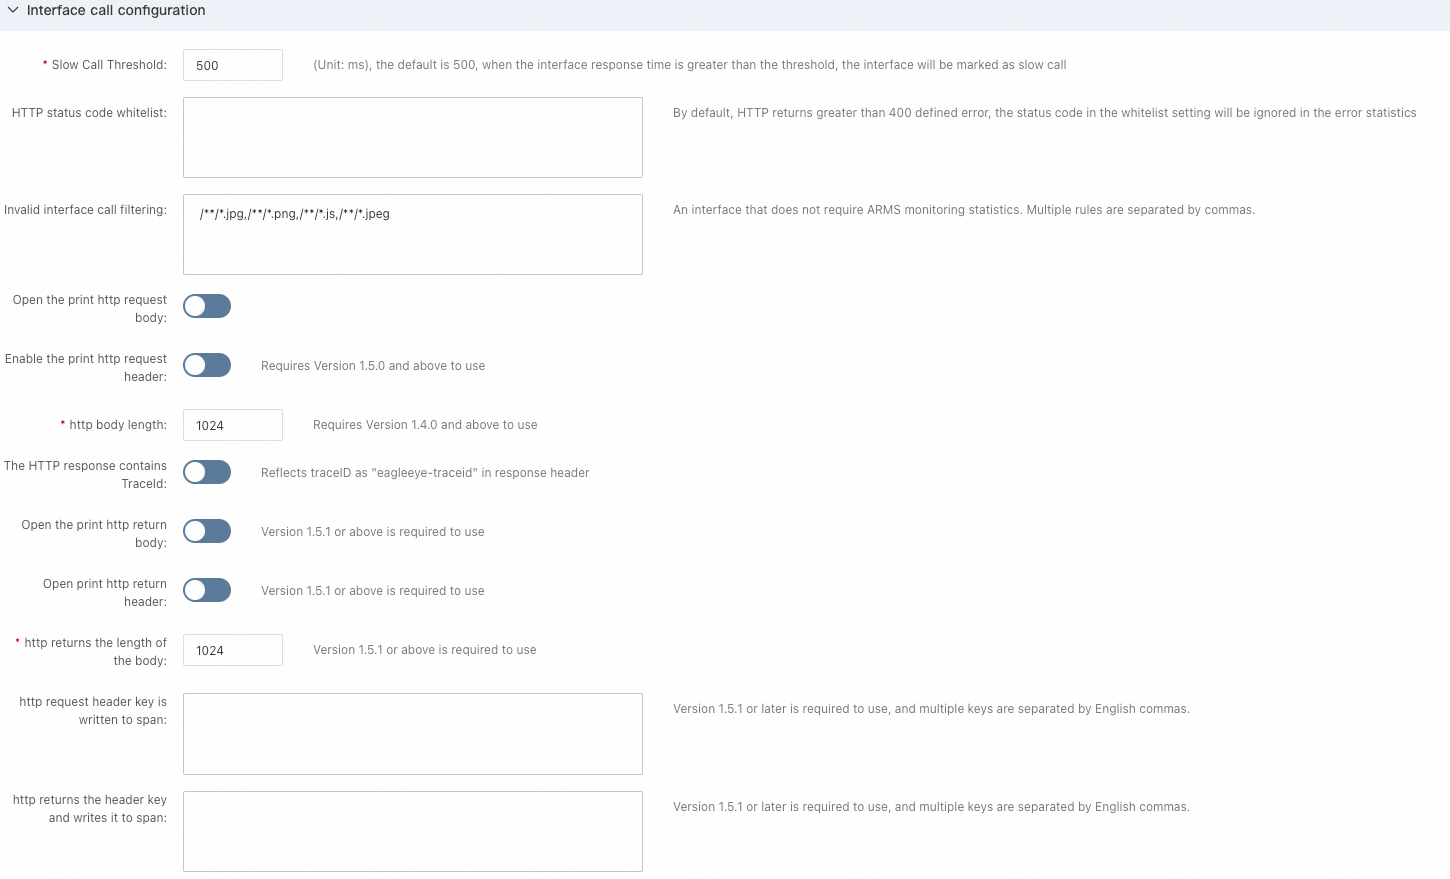
Slow Call Threshold: Unit: ms. Default value: 500. If the response time of a request exceeds the threshold, the request is marked as slow.
HTTP status code whitelist:
By default, HTTP status codes greater than 400 are classified as error calls. If you do not want certain status codes to be classified as errors, you can set a whitelist to ignore these errors.
This only affects the HTTP frameworks currently supported by Application Monitoring.
Affected data: Error count metrics for HTTP server/client (arms_http_requests_error_count, arms_http_client_requests_error_count, arms_app_requests_error_count) and span status.
Affected Features: Error count on the Overview, Provided Services, and Dependencies tabs, as well as span status, error count, and alerts on the Trace Explorer tab.
Content Format: Enter single status codes, separate multiple status codes with an commas (,). Fuzzy matching is not supported.
Example:
403,502Default Value: None
Invalid interface call filtering:
If you do not want to see some calls on the Provided Services tab, you can enter the names of interfaces whose call details you do not need to view, thereby hiding them.
Affected Data: All metrics and spans corresponding to the interface will be ignored.
Affected Features: All interface-related metrics on the Overview, Provided Services, and Dependencies tabs, as well as span count, interface call count, error count, and alerts on the Trace Explorer tab.
Content Format: Use strings or AntPath expressions to match the full names of invalid interfaces. Separate multiple rules with commas (,). (The default AntPath expression is provided for compatibility with existing data and is not recommended to be deleted. New configurations should be appended to the existing rules.)
Example:
/api/test/*,/api/playground/createDefault Value:
//*.jpg,//.png,/**/.js,//*.jpeg,//.pdf,/**/.xlsx,//*.txt,//.docs,/**/.gif,/**/*.csvOpen the print http request body: When enabled, the http.request.body field is added to the spans of HTTP Client to indicate the request body. The default printed body length is 1024.
Enable the print http request header: When enabled, the http.request.header field is added to the spans of HTTP Client to indicate the request header.
http body length: The length of the HTTP request body. The default printed body length is 1024.
The HTTP response contains TraceId: When enabled, TraceId is added to the response header. The key is Eagleeye-TraceId.
Open the print http return body: When enabled, the http.response.body field is added to the spans of HTTP Server to indicate the response body.
Open print http return header: When enabled, the http.response.header field is added to the spans of HTTP Server to indicate the response header.
http returns the length of the body: The length of the HTTP response body. The default printed body length is 1024.
http request header key is written to span: Enter the keys that appear in the header. Separate multiple keys with commas (,). Then, the http.request.header.key field is added to the spans of HTTP Client.
http returns the header key and writes it to span: Enter the keys that appear in the header. Separate multiple keys with commas (,). Then, the http.response.header.key field is added to the spans of HTTP Server.
Database call settings
In the Database call configuration section, you can specify a threshold for slow SQL queries and a maximum retention length for collected SQL statements. You can also specify whether to display the variable values and constant values in SQL statements, and whether to record the return value of MySQL queries.
Show the variable binding value in SQL: captures the variable values bound to the PrepareStatement parameter. This configuration takes effect without the need to restart the application.
Show the constant values in SQL: The SQL statements are truncated without additional processing. This configuration takes effect without the need to restart the application.

Trace propagation protocol settings
In the Call Chain Pass-through Protocol Settings section, you can select a tracing propagation protocol based on your business requirement. The default protocol is W3C, but options such as Zipkin, Jaeger, or EagleEye are also available.

Agent collection settings
In the Probe Acquisition Configuration section, you can set the maximum number of traces collected per second by the agent and the log level of the agent.

Advanced settings
In the Advanced Settings section, you can configure advanced settings, such as quantile statistics, error and slow interface sampling, and the maximum length for exception stacks.

Copy application settings to other applications
You can copy the settings of an application to other applications.
Copy a single configuration item to other applications
In the section of the configuration item, click Save and bulk copy to other applications.
If the Current settings not saved message appears, click Save to save the configuration and then click Save and bulk copy to other applications.
In the dialog box that appears, select a specific application or all other applications and click OK.
Copy all configuration items to other applications
In the lower part of the page, click Save and bulk copy to other apps.
If the Current settings not saved message appears, click Save to save the configurations and then click Save and bulk copy to other applications.
In the dialog box that appears, select a specific application or all other applications and click OK.
Globally apply application settings
You can globally apply the current application settings. If you create a new application, the settings are used by default.
In the lower part of the page, click Save current app settings as global default configuration.
If the Current settings not saved message appears, click Save to save the configurations and then click Save current app settings as global default configuration.
In the message that appears, click OK.