When debugging a failed request in a Go application, you need to correlate the trace that captured the failure with the application logs that recorded what happened. Application Real-Time Monitoring Service (ARMS) automatically injects trace IDs into your Go application logs through log framework instrumentation. From a slow or failed trace in the ARMS console, you can jump directly to the associated log entries in Simple Log Service (SLS) and pinpoint the root cause.
How trace-log association works
The ARMS agent for Go instruments supported log frameworks at initialization. Once enabled:
The agent hooks into your log framework when the application starts.
Each log entry automatically includes the
traceIdfield from the active span.SLS indexes these fields, linking log entries to the corresponding traces in the ARMS console.
No code changes are required. The ARMS agent handles injection transparently for all supported log frameworks.
Supported log frameworks
The ARMS agent instruments the following Go log frameworks. Verify that your framework version falls within the supported range before enabling trace-log association.
Framework | Repository | Minimum version | Maximum version |
Zerolog | v1.10.0 | v1.33.0 | |
Zap | v1.20.0 | v1.27.0 | |
Logrus | v1.5.0 | v1.9.3 | |
Log | Go 1.21 | N/A | |
Slog | Go 1.21 | N/A |
Log and Slog are part of the Go standard library. The minimum version refers to the Go release version, not a module version.
If your log framework version falls outside the supported range, upgrade or downgrade to a compatible version before you enable trace-log association.
Prerequisites
Before you begin, ensure that you have:
A Go application compiled and deployed with the ARMS agent for Go
Log collection configured through Simple Log Service. For more information, see Data collection overview
Enable trace ID injection
Step 1: Open the application settings
Log on to the ARMS console.
In the left-side navigation pane, choose .
Select a region in the top navigation bar and click your application.
Icons in the Language column indicate the programming language: -
 : Java -
  : Go -
  : Python - - (Hyphen): an application monitored in Managed Service for OpenTelemetry
Step 2: Configure log association
In the top navigation bar, choose .
In the Application log Association configuration section of the Custom Configurations tab, configure the following settings:
Setting Value Log Source Log service SLS Automatically associate business logs with TraceId Turn on Region Select the region where your Simple Log Service is deployed Project and Logstore Bind the project and Logstore that store your application logs 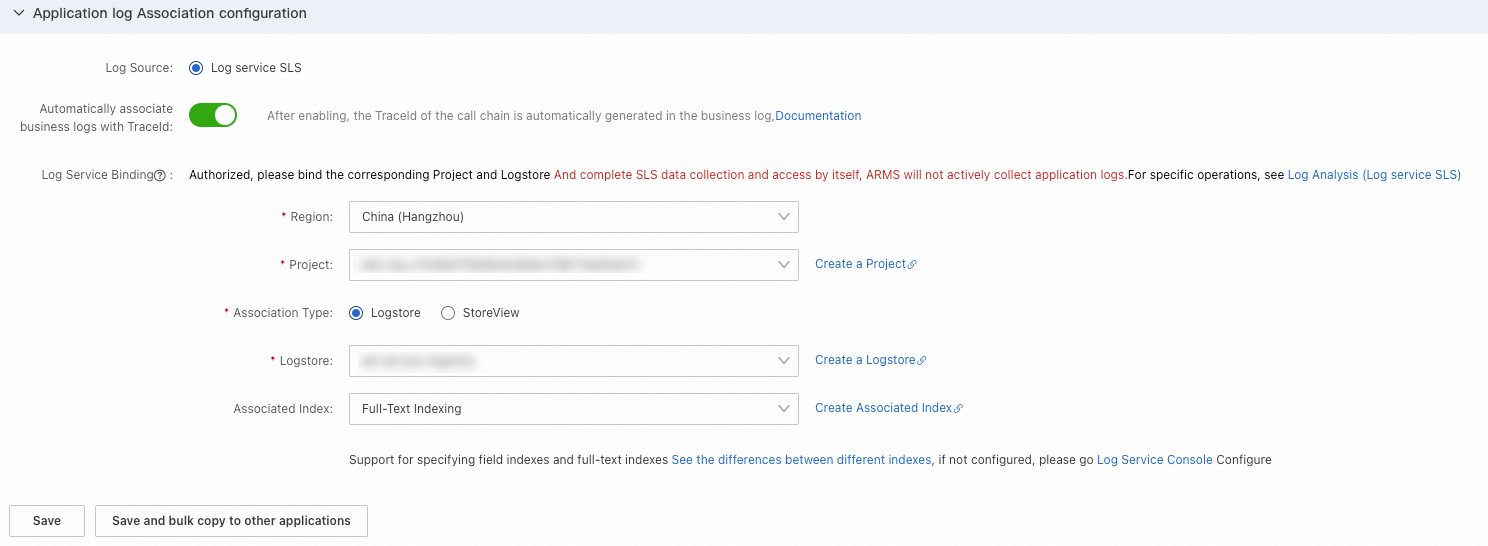
Step 3: Verify the association
Open your application logs and confirm that trace IDs appear in the log entries. The following figure shows a successful association.

Step 4 (optional): Upload application logs to SLS
By default, the ARMS agent for Go does not collect application logs. To upload application logs to SLS, configure log collection and specify the target project and Logstore.

Considerations
The ARMS agent injects trace IDs automatically. No code changes are required for the supported log frameworks listed above.
If you switch log frameworks, verify that the new framework and version are within the supported range.