After you install an Application Real-Time Monitoring Service (ARMS) agent for a Go application, ARMS starts to monitor the application. You can view information about application instances, such as basic metrics, garbage collection (GC), and heap memory on the Instance Monitoring tab of the application details page.
Prerequisites
An ARMS agent is installed for the application. For more information, see Application Monitoring overview.
Go to the Instance Monitoring tab
Log on to the ARMS console. In the left-side navigation pane, choose .
On the Application List page, select a region in the top navigation bar and click the name of the application that you want to manage.
NoteIf the
 icon is displayed in the Language column, the application is connected to Application Monitoring. If a hyphen (-) is displayed, the application is connected to Managed Service for OpenTelemetry.
 In the top navigation bar, click the Instance Monitoring tab.
Instance Monitoring tab
The Instance Monitoring tab provides dashboard data based on whether the application is deployed in an Elastic Compute Service (ECS) instance or a Container Service for Kubernetes (ACK) cluster, and whether the environment is monitored in Managed Service for Prometheus.
If your application is deployed in an ACK cluster that is monitored in Managed Service for Prometheus, the data of Managed Service for Prometheus is displayed in the dashboard. For information about how to use Managed Service for Prometheus to a monitor an ACK cluster, see Monitor an ACK cluster.
If the ACK cluster is not monitored in Managed Service for Prometheus, only the basis information about the cluster is displayed.
ECS instance
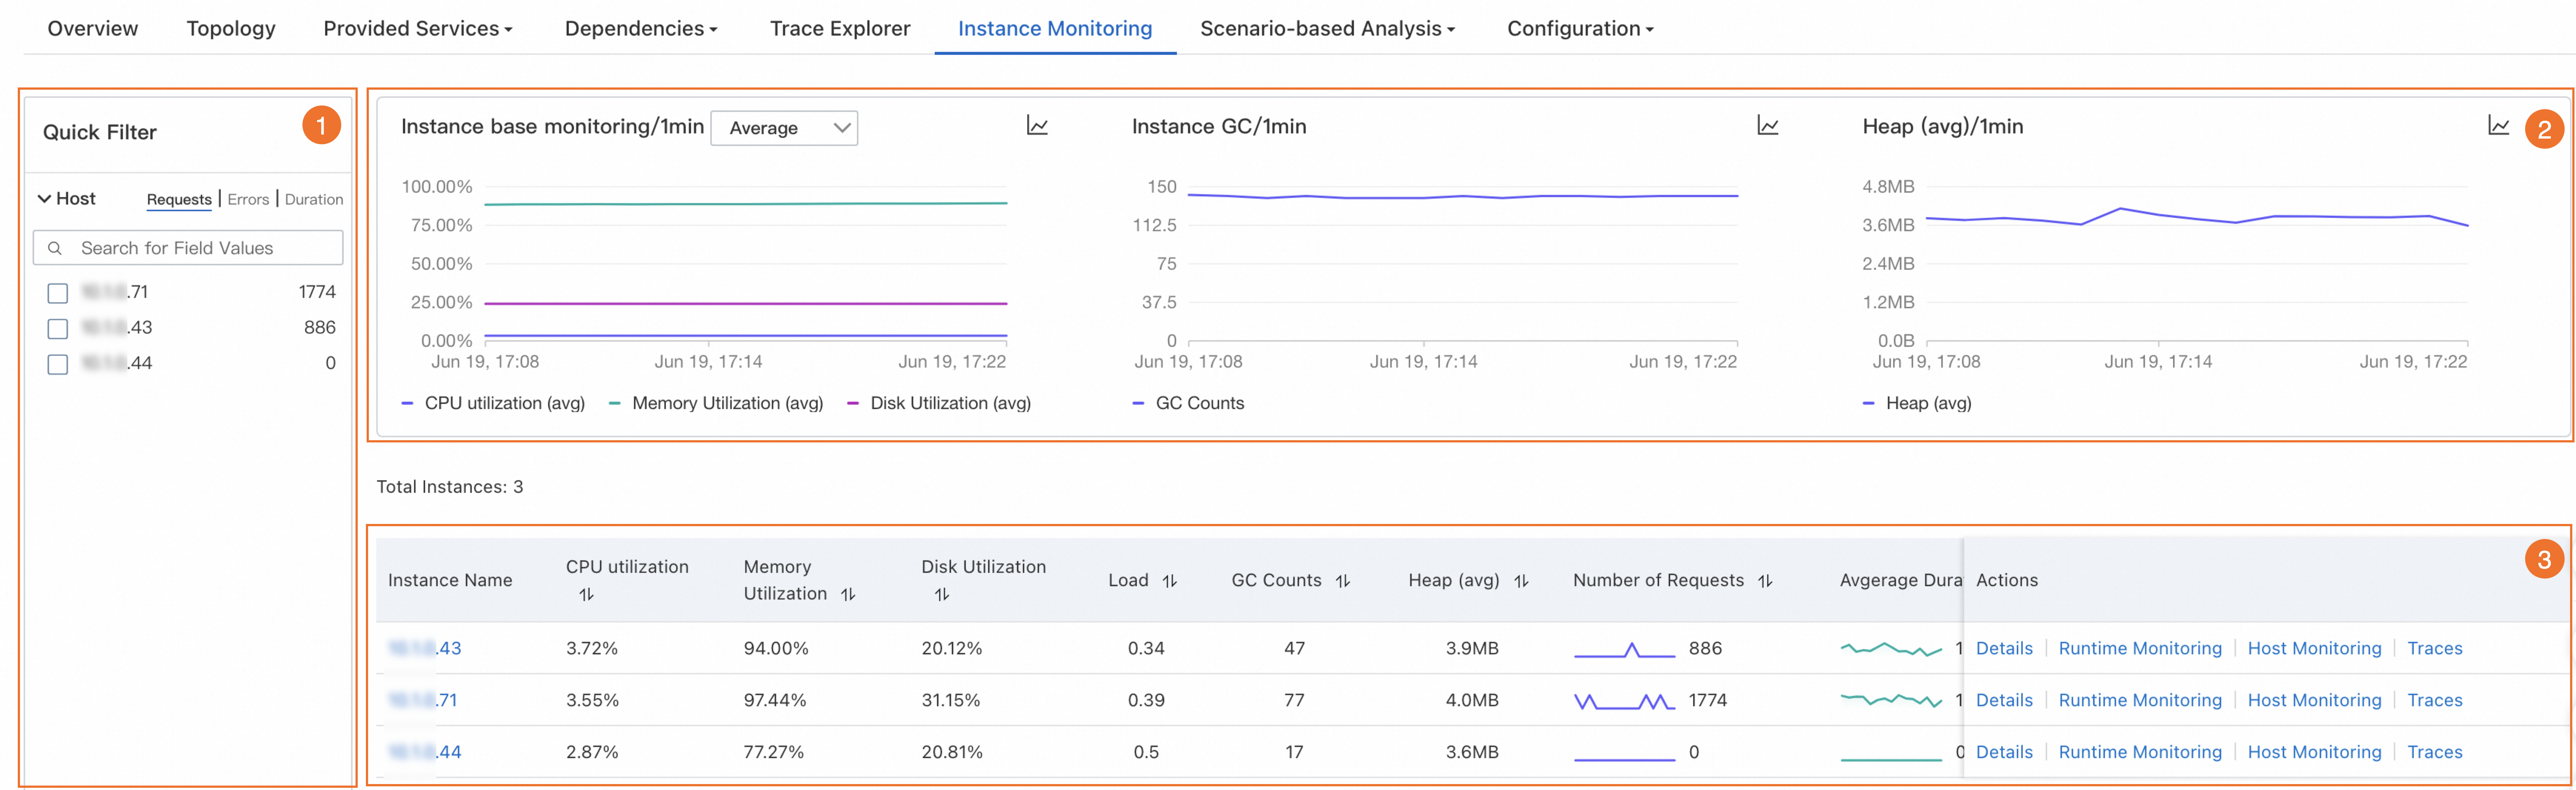
In the Quick Filter section (icon 1), you can query charts and instances by host IP address.
In the trend charts section (icon 2), you can view the time series of basic metrics, GCs, and heap memory.
Instance base monitoring: shows the trend chart of CPU, memory, and disk usage in the specified time period. Switch between the average and maximum values from the drop-down list.
Instance GC: shows the trend chart of GCs in the specified time period.
Heap: shows the trend chart of heap memory within the specified time period.
Click the
 icon. In the dialog box that appears, you can view the metric data in a specific time period or compare the metric data in the same time period on different dates. You can switch between the
  icons to display the data in a column chart or a trend chart.
 In the instance list section (icon 3), you can view instance information, such as the IP address, CPU, memory, and disk usage, load, number of GCs, heap memory usage, and key metrics of each instance defined by the RED Method, including rate, errors, and duration.
In the instance list, you can perform the following operations:
Click an instance IP address or click Details in the Actions column to view the instance details. For more information, see the Instance details section.
Click Traces in the Actions column to view the trace details of an instance. For more information, see Trace Explorer.
ACK cluster monitored in Managed Service for Prometheus
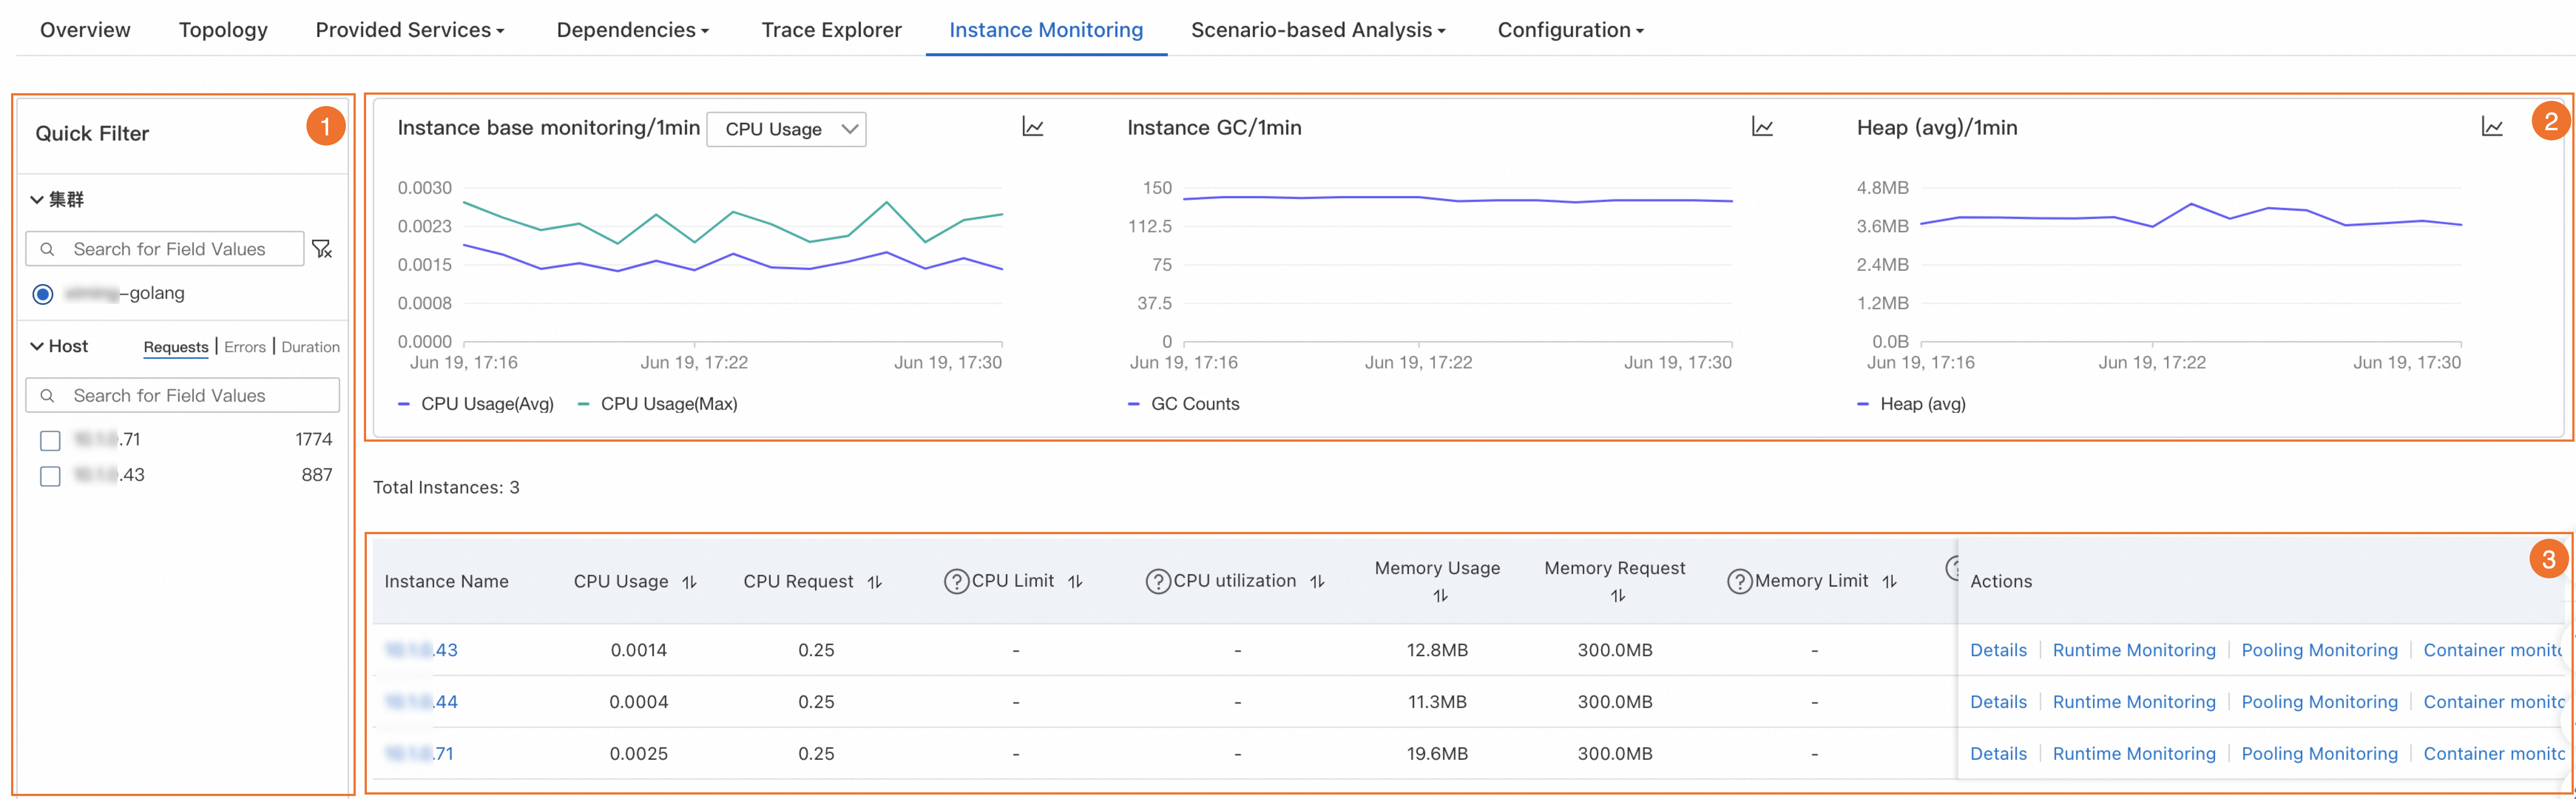
In the Quick Filter section (icon 1), you can query charts and instances by cluster ID or host IP address.
In the trend charts section (icon 2), you can view the time series of basic metrics, GCs, and heap memory.
Instance base monitoring: shows the trend charts of CPU utilization and memory usage in the specified time period. Switch between the average and maximum values from the drop-down list.
Instance GC: shows the trend chart of GCs in the specified time period.
Heap: shows the trend chart of heap memory within the specified time period.
Click the
icon. In the dialog box that appears, you can view the metric data in a specific time period or compare the metric data in the same time period on different dates. You can switch between the icons to display the data in a column chart or a trend chart. In the instance list section (icon 3), you can view instance information, such as the IP address, used CPU, requested CPU, maximum CPU, CPU utilization (%), used memory, requested memory, maximum memory, memory usage (%), used disk size, maximum disk size, disk usage (%), load, number of GCs, heap memory usage, and key metrics of each instance defined by the RED Method, including rate, errors, and duration. Note that if the maximum CPU, memory, or disk size is not configured, - is displayed in place of the CPU utilization, memory usage, or disk usage.
In the instance list, you can perform the following operations:
Click an instance IP address or click Details in the Actions column to view the instance details. For more information, see the Instance details section.
Click Traces in the Actions column to view the trace details of an instance. For more information, see Trace Explorer.
Kubernetes cluster (custom data collection)
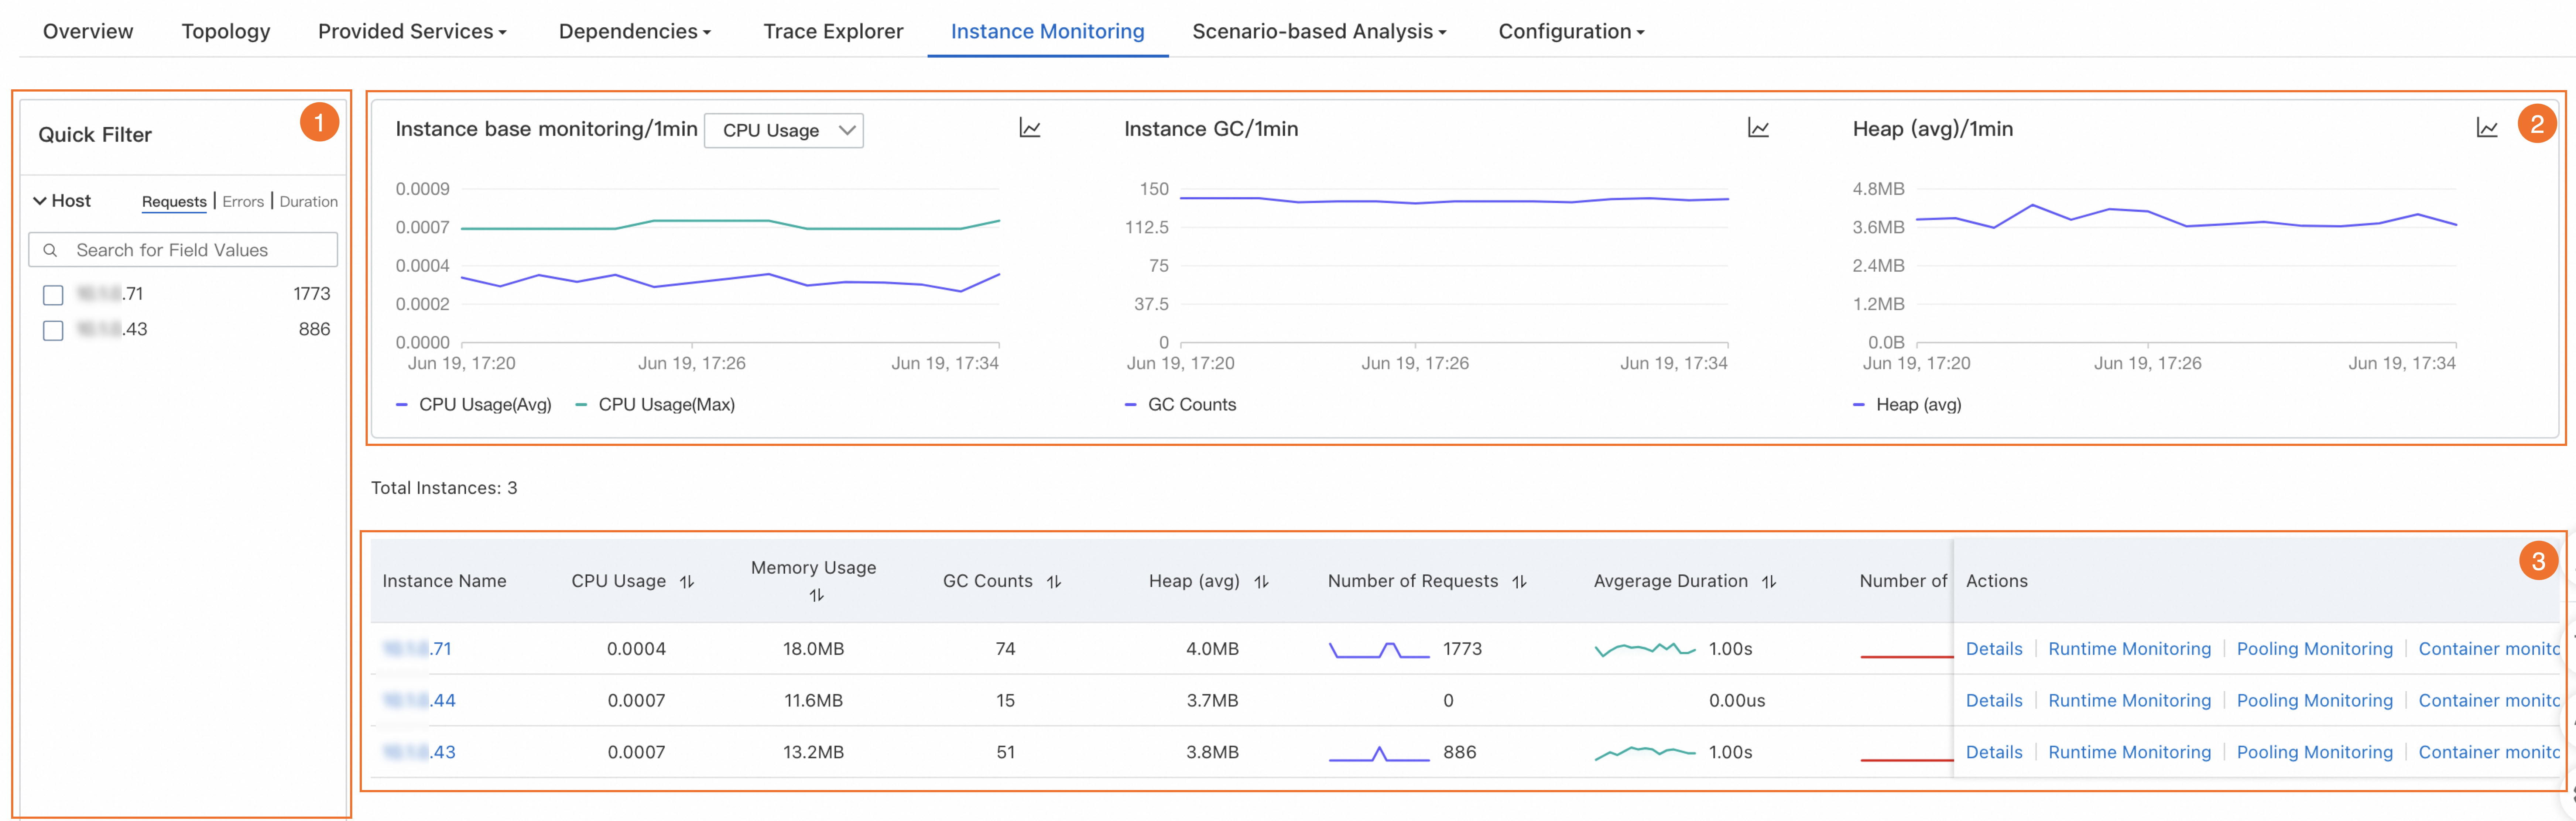
In the Quick Filter section (icon 1), you can query charts and instances by host IP address.
In the trend charts section (icon 2), you can view the time series of basic metrics, GCs, and heap memory.
Instance base monitoring: shows the trend charts of CPU utilization and memory usage in the specified time period. Switch between the average and maximum values from the drop-down list.
Instance GC: shows the trend chart of GCs in the specified time period.
Heap: shows the trend chart of heap memory within the specified time period.
Click the
icon. In the dialog box that appears, you can view the metric data in a specific time period or compare the metric data in the same time period on different dates. You can switch between the icons to display the data in a column chart or a trend chart. In the instance list section (icon 3), you can view instance information, such as the IP address, CPU utilization, memory usage, load, number of GCs, heap memory usage, and key metrics of each instance defined by the RED Method, including rate, errors, and duration.
In the instance list, you can perform the following operations:
Click an instance IP address or click Details in the Actions column to view the instance details. For more information, see the Instance details section.
Click Traces in the Actions column to view the trace details of an instance. For more information, see Trace Explorer.
Instance details
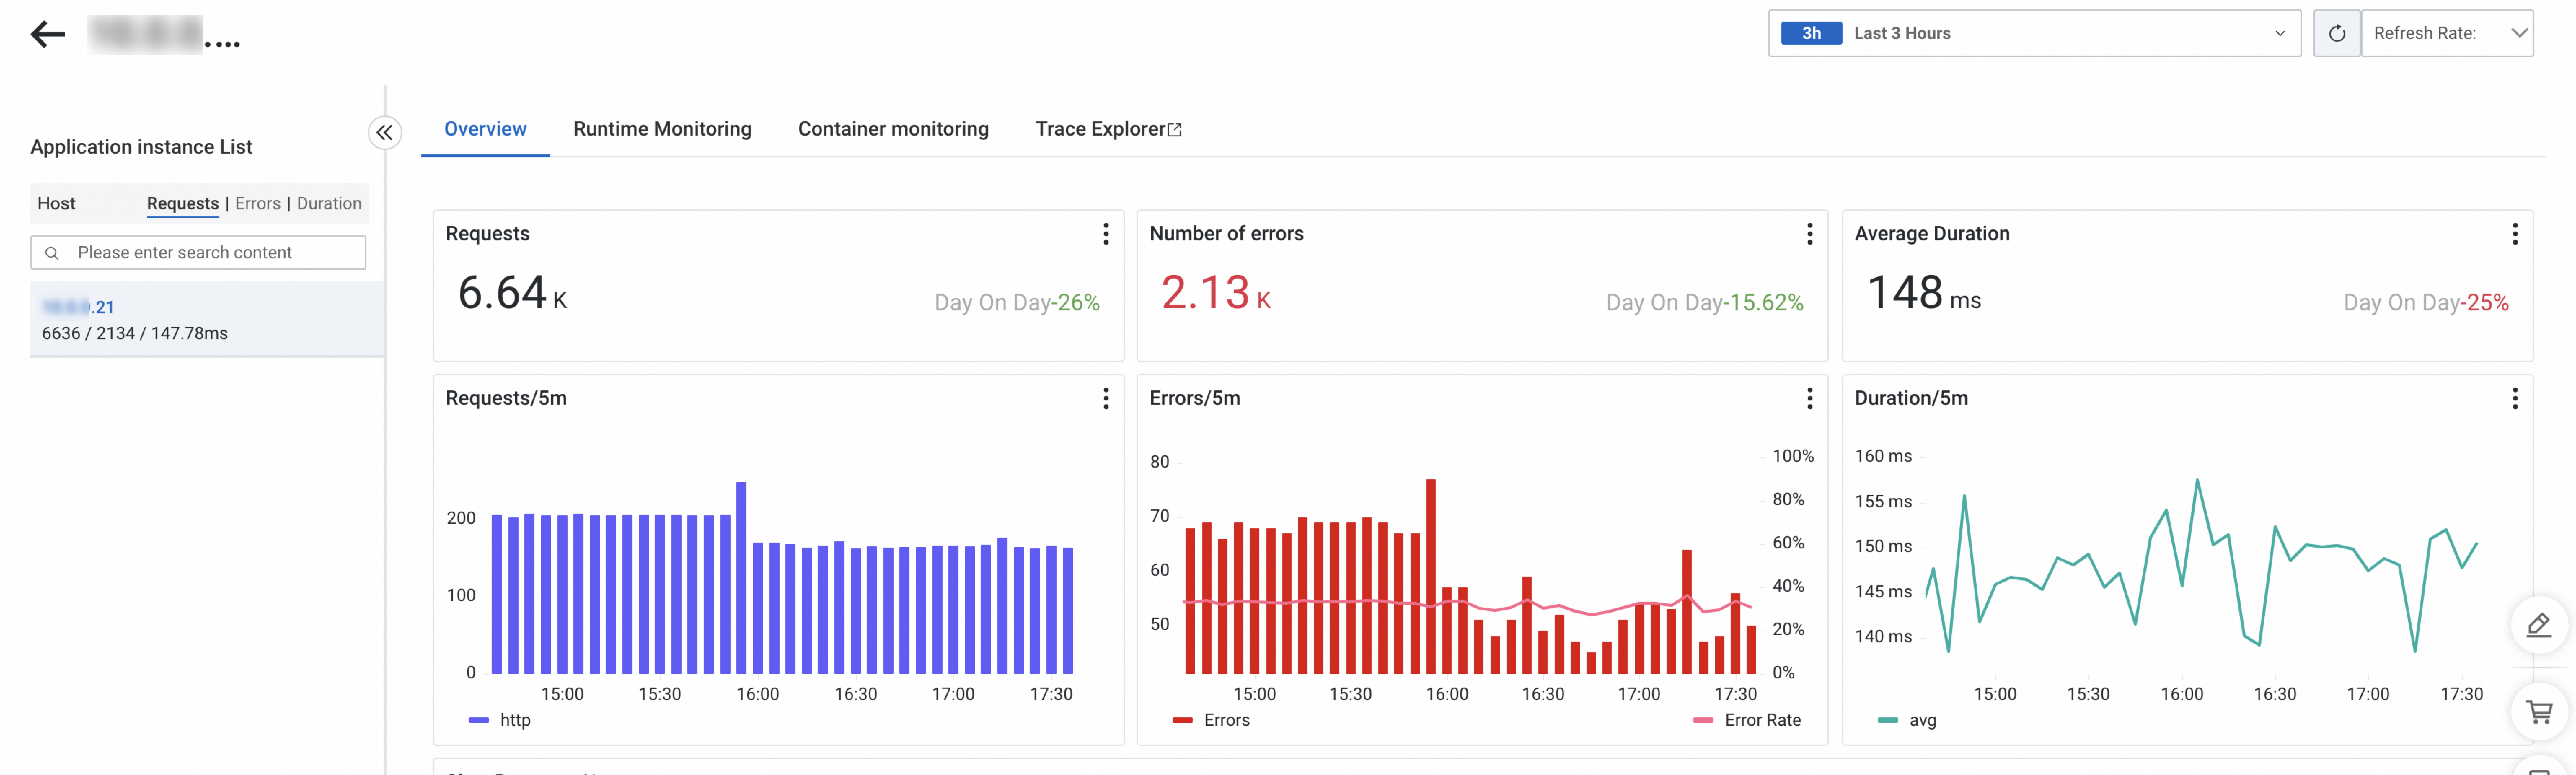
Overview
On the Overview tab, you can view the number of requests, number of errors, and average duration.
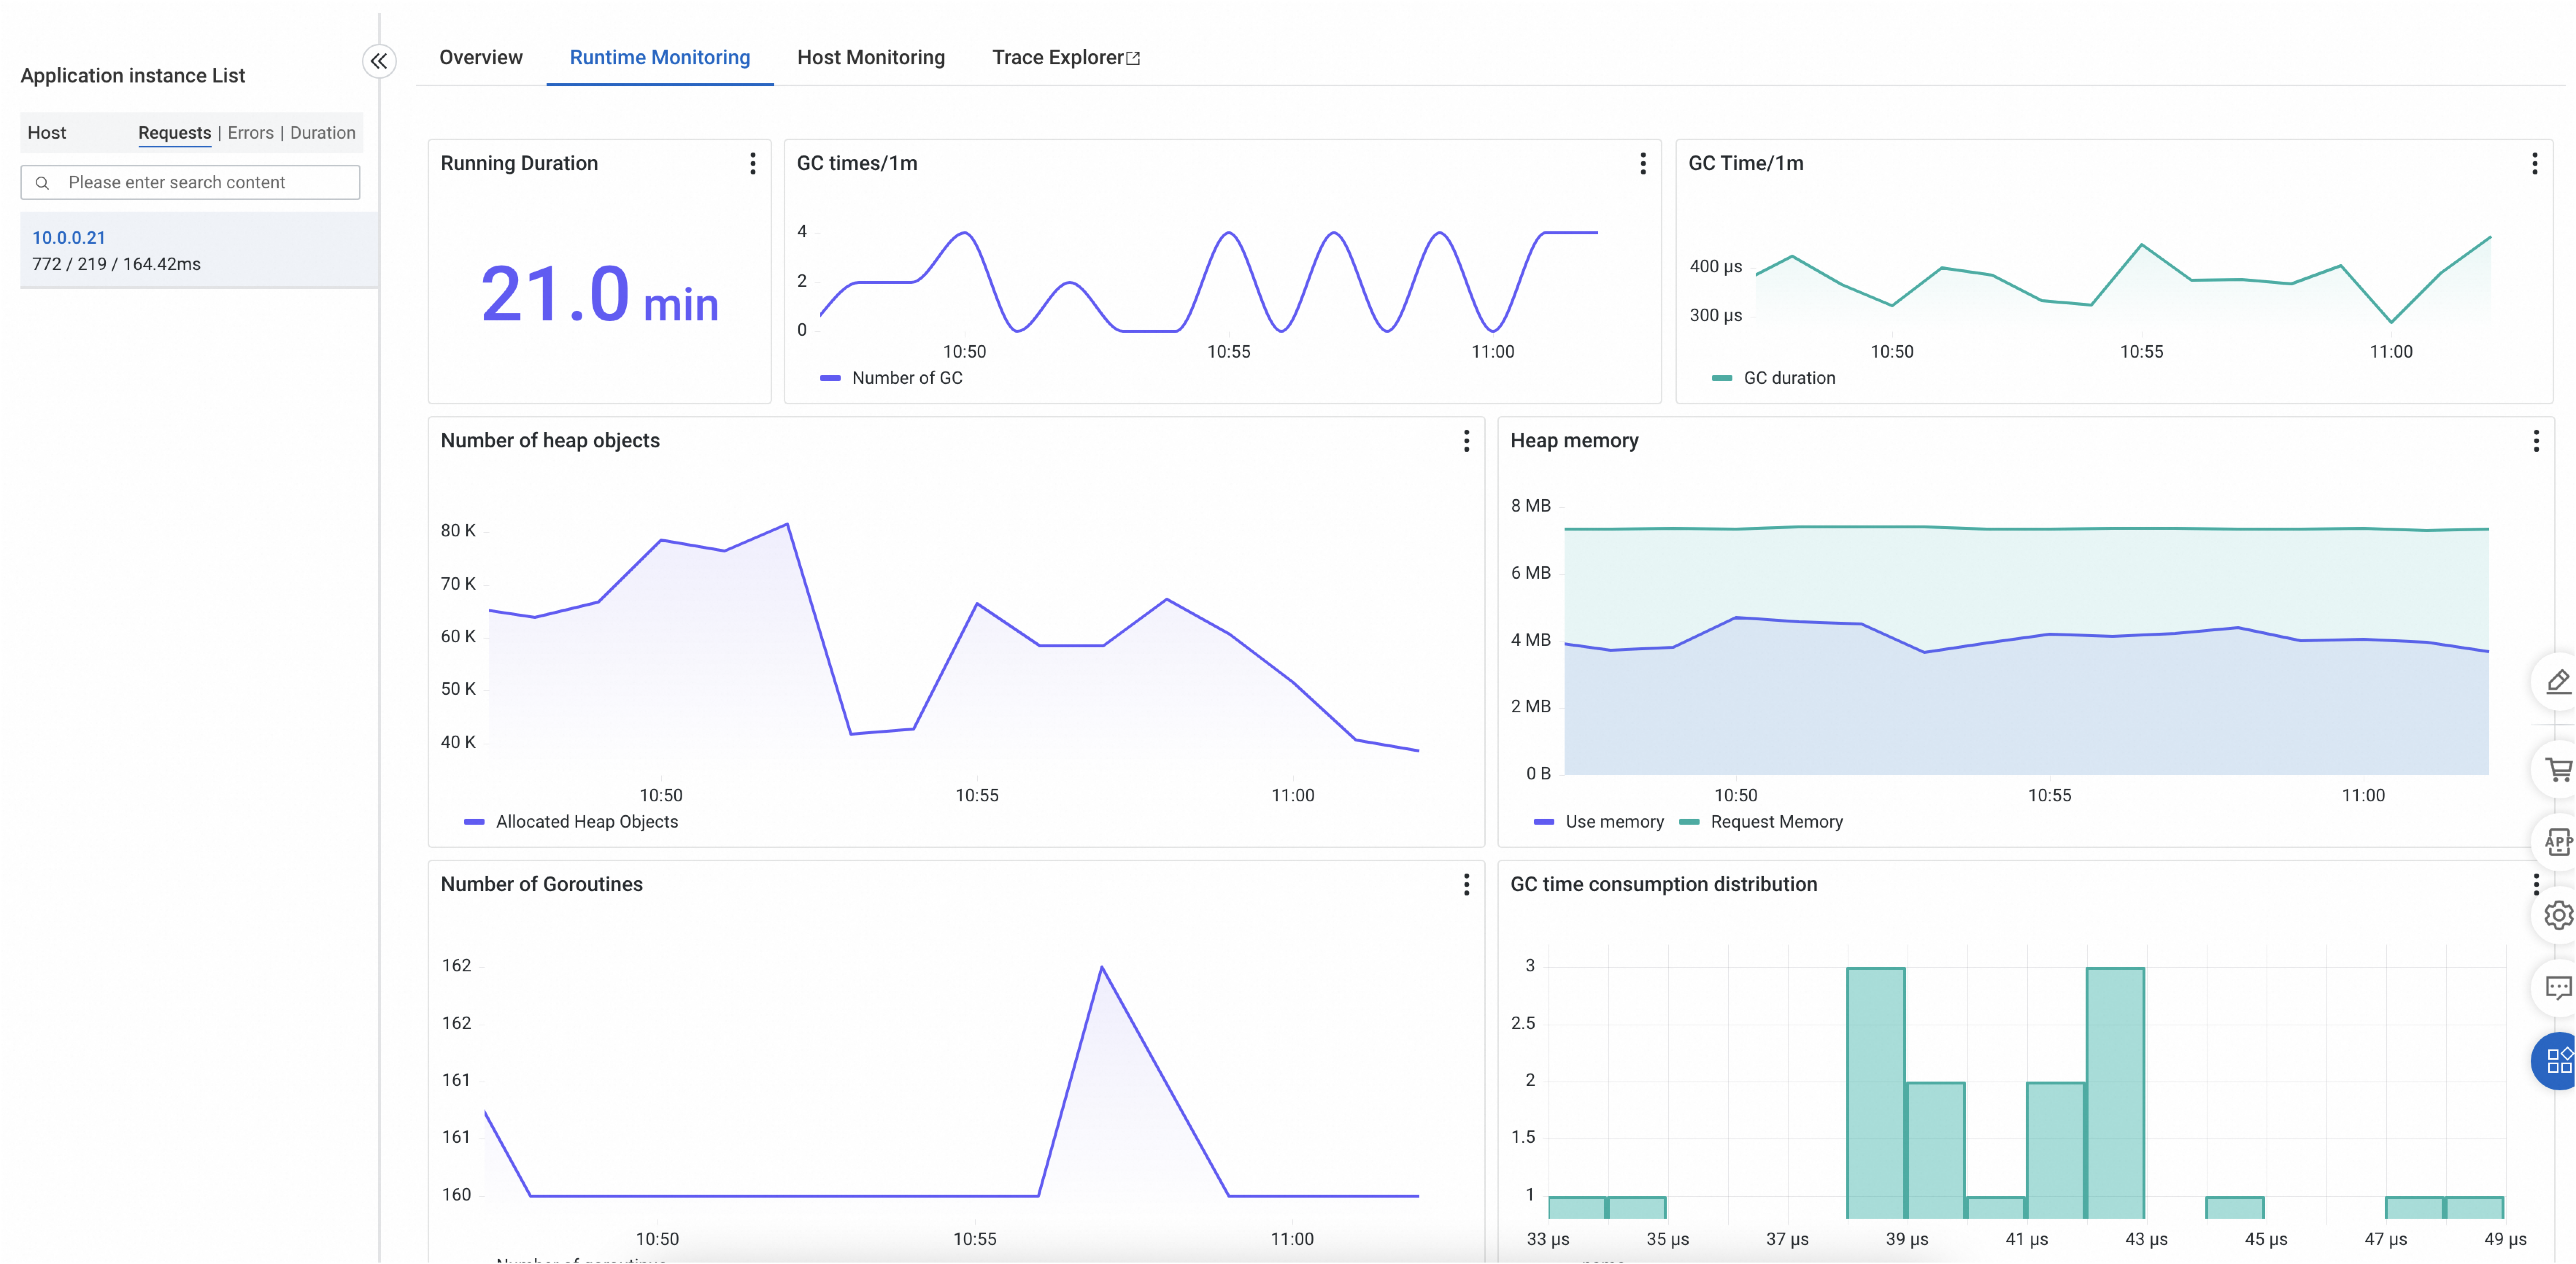
Runtime Monitoring
On the Runtime Monitoring tab, you can view the GCs, GC duration, and heap memory of the instance.
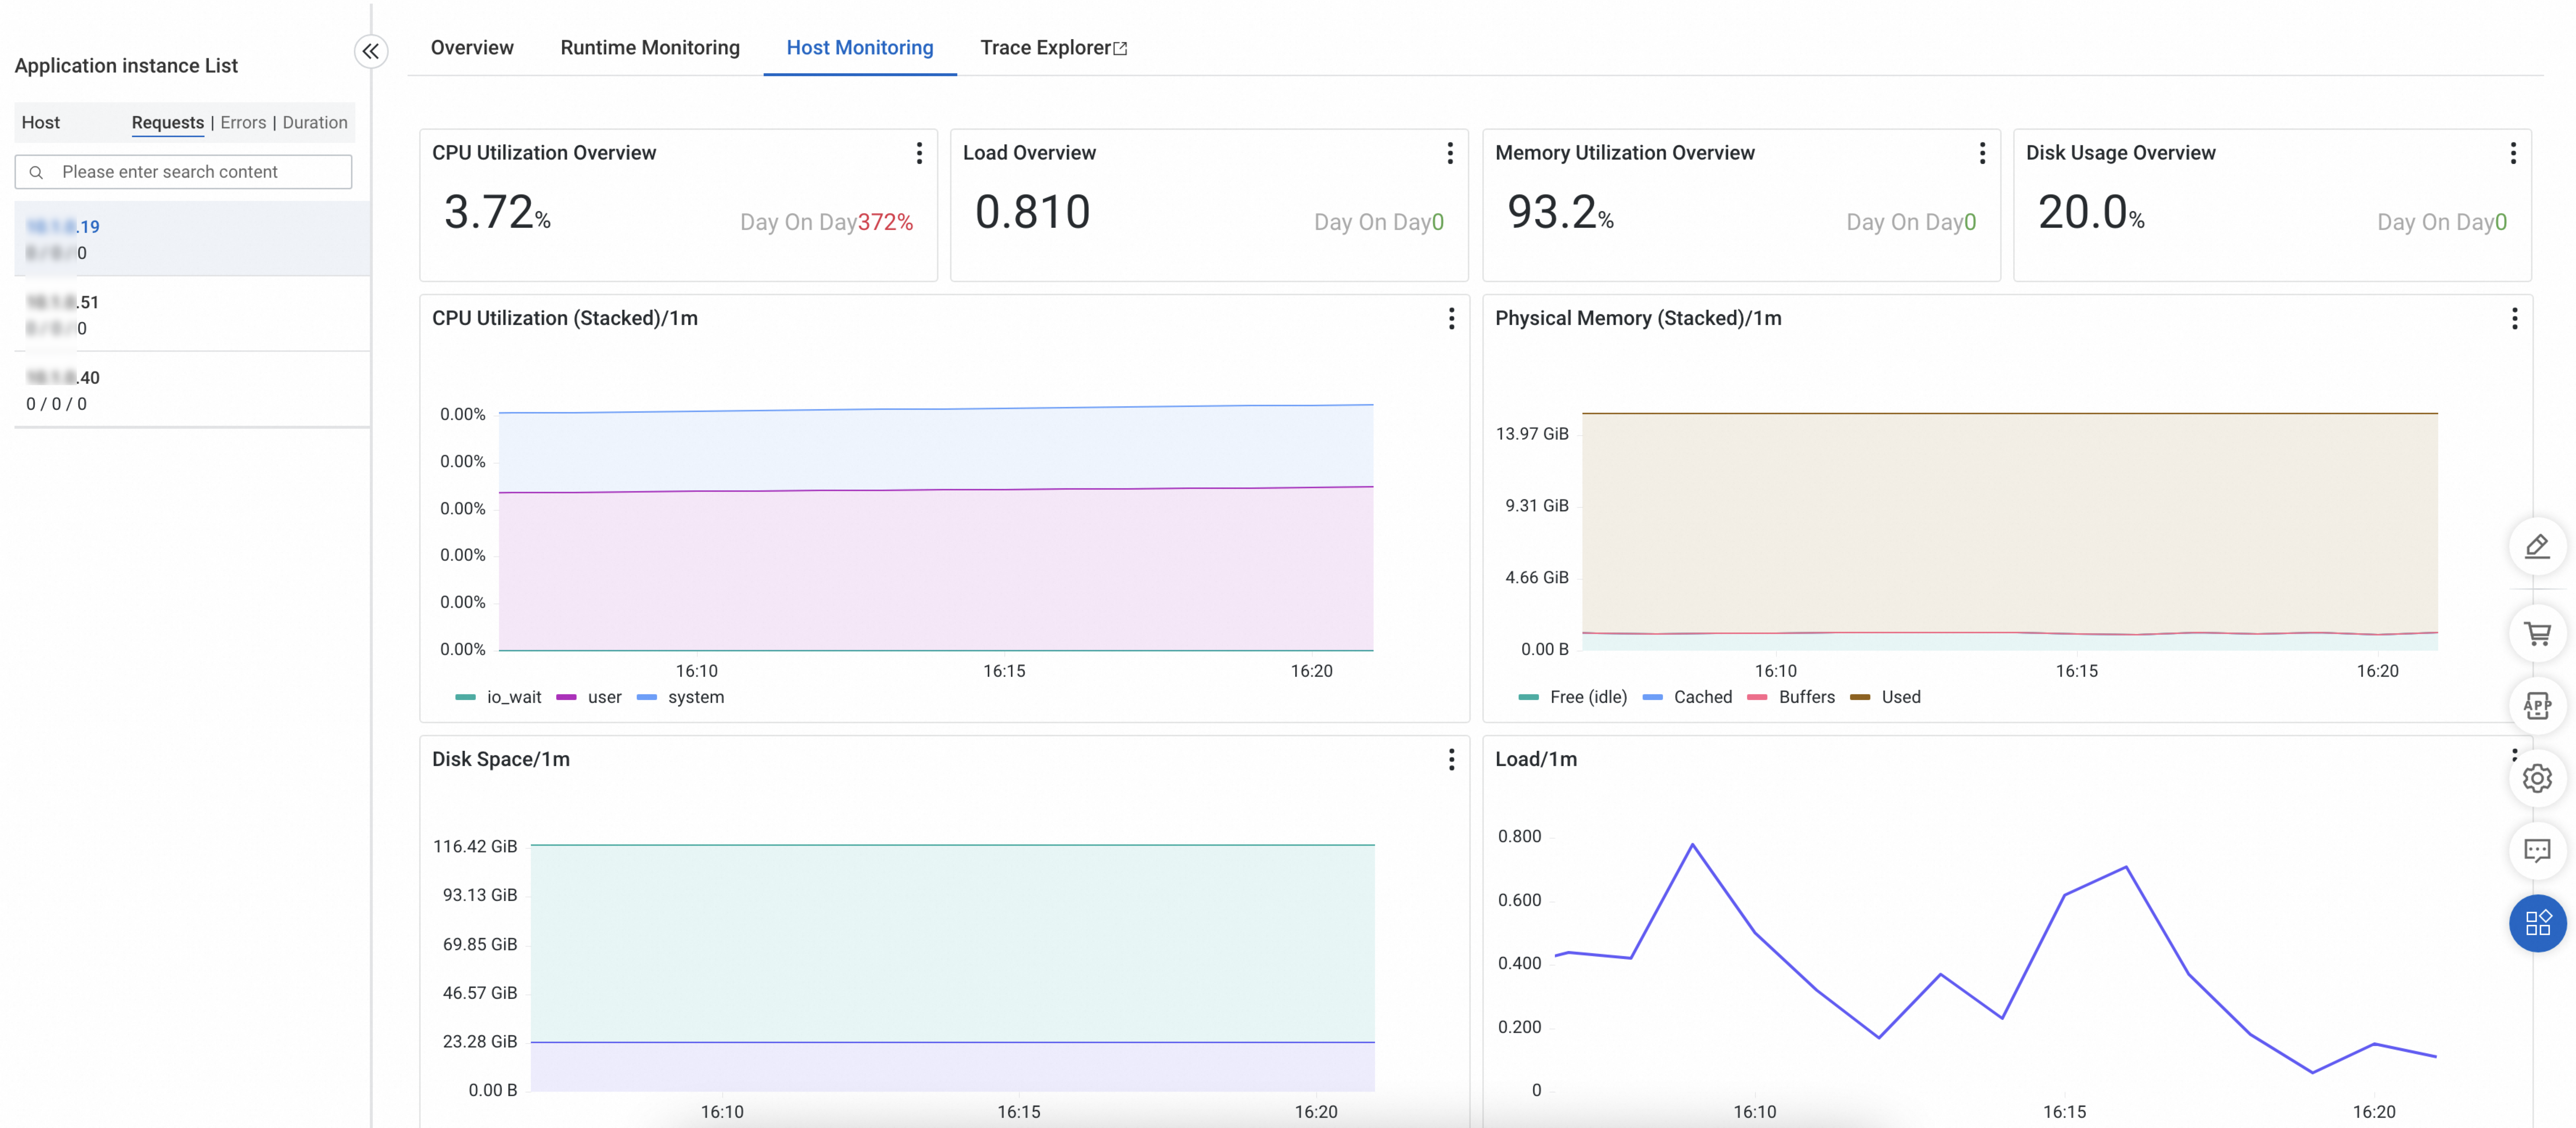
Host Monitoring
On the Host Monitoring tab, you can view the metrics about CPU utilization, memory usage, disk usage, load, traffic, and packets.
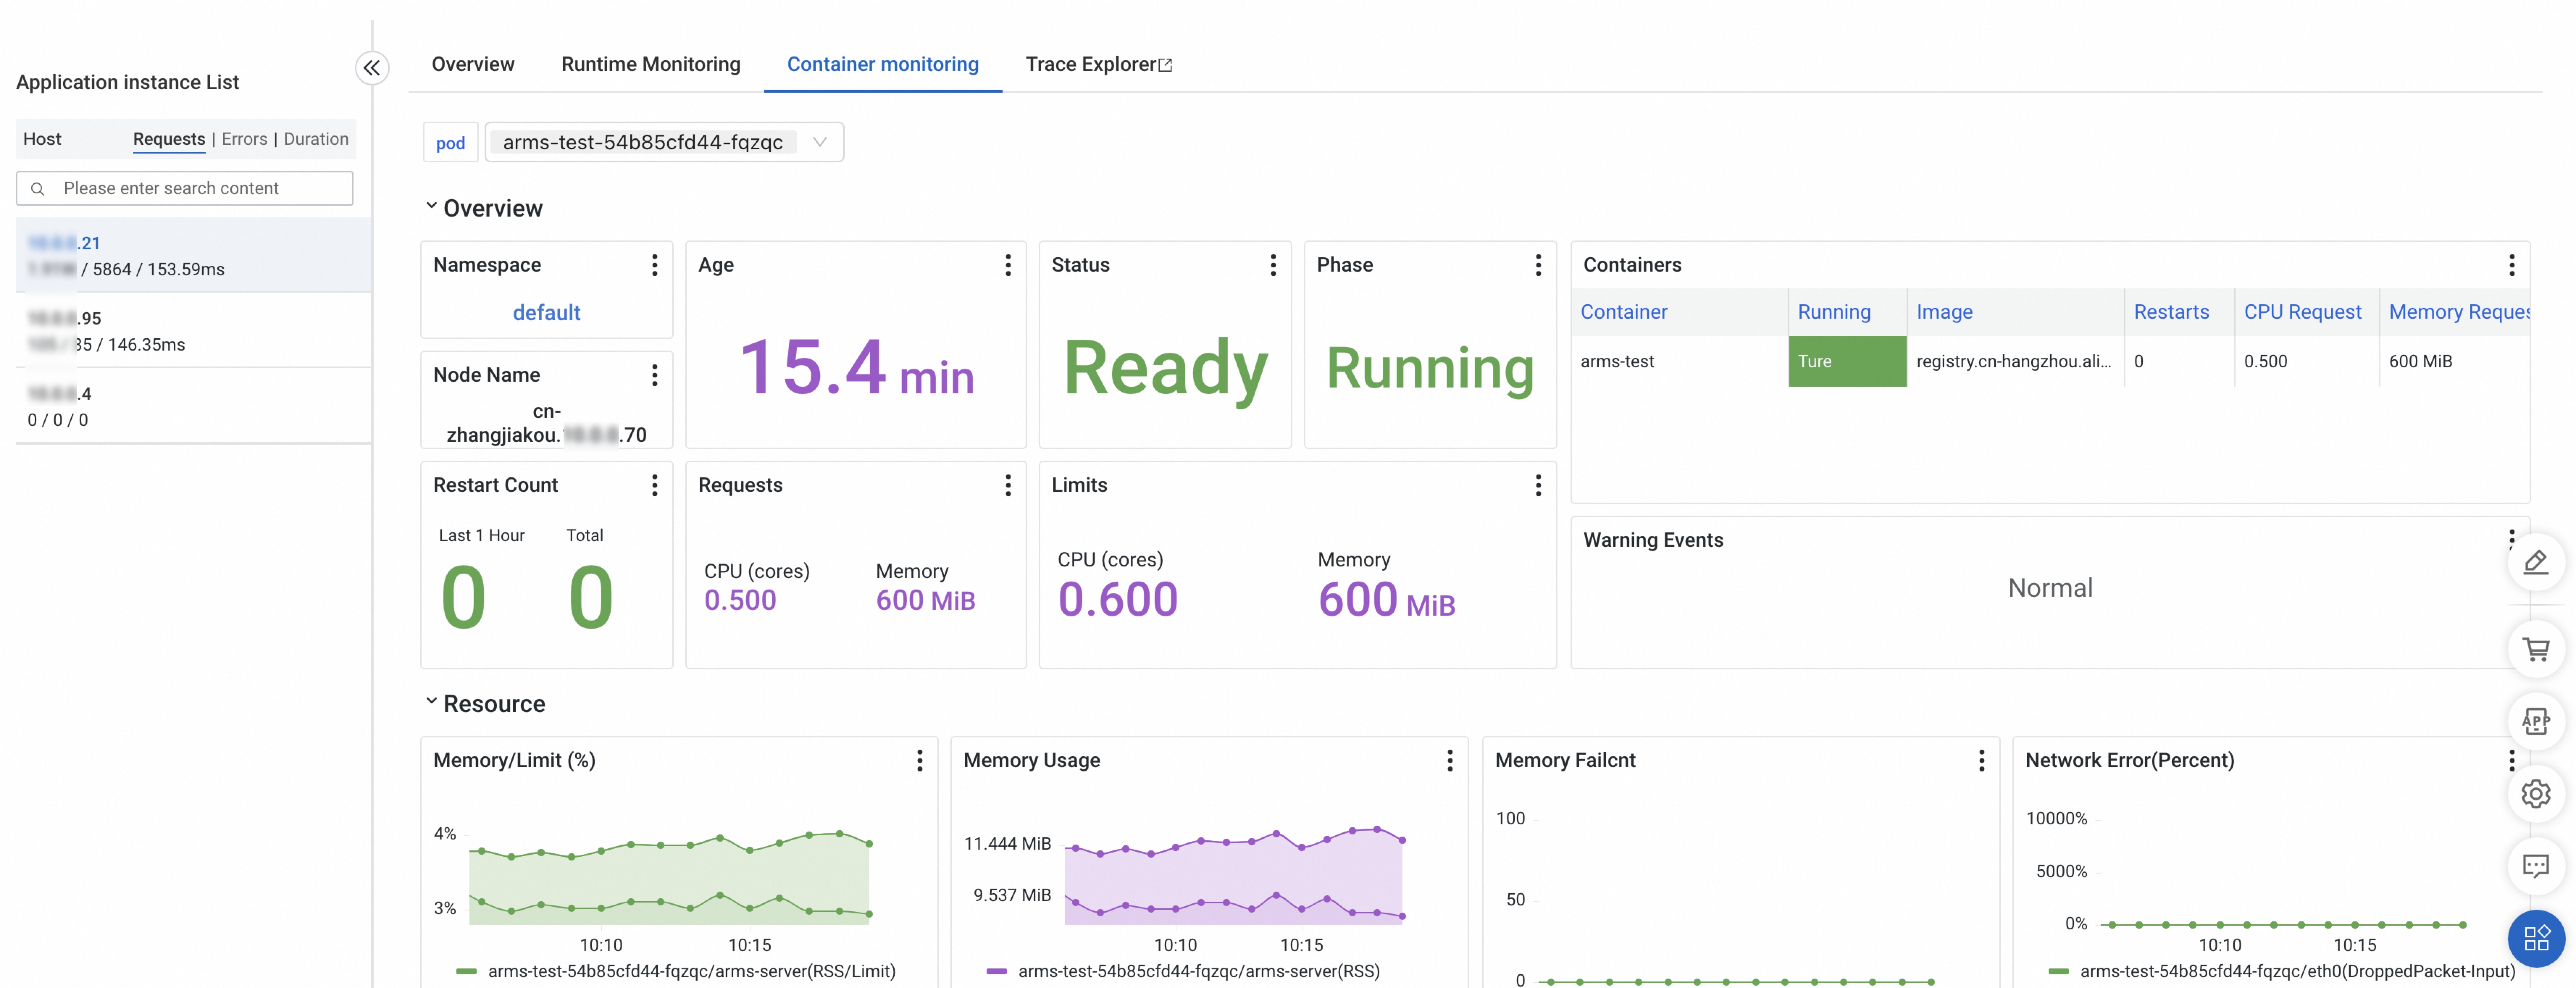
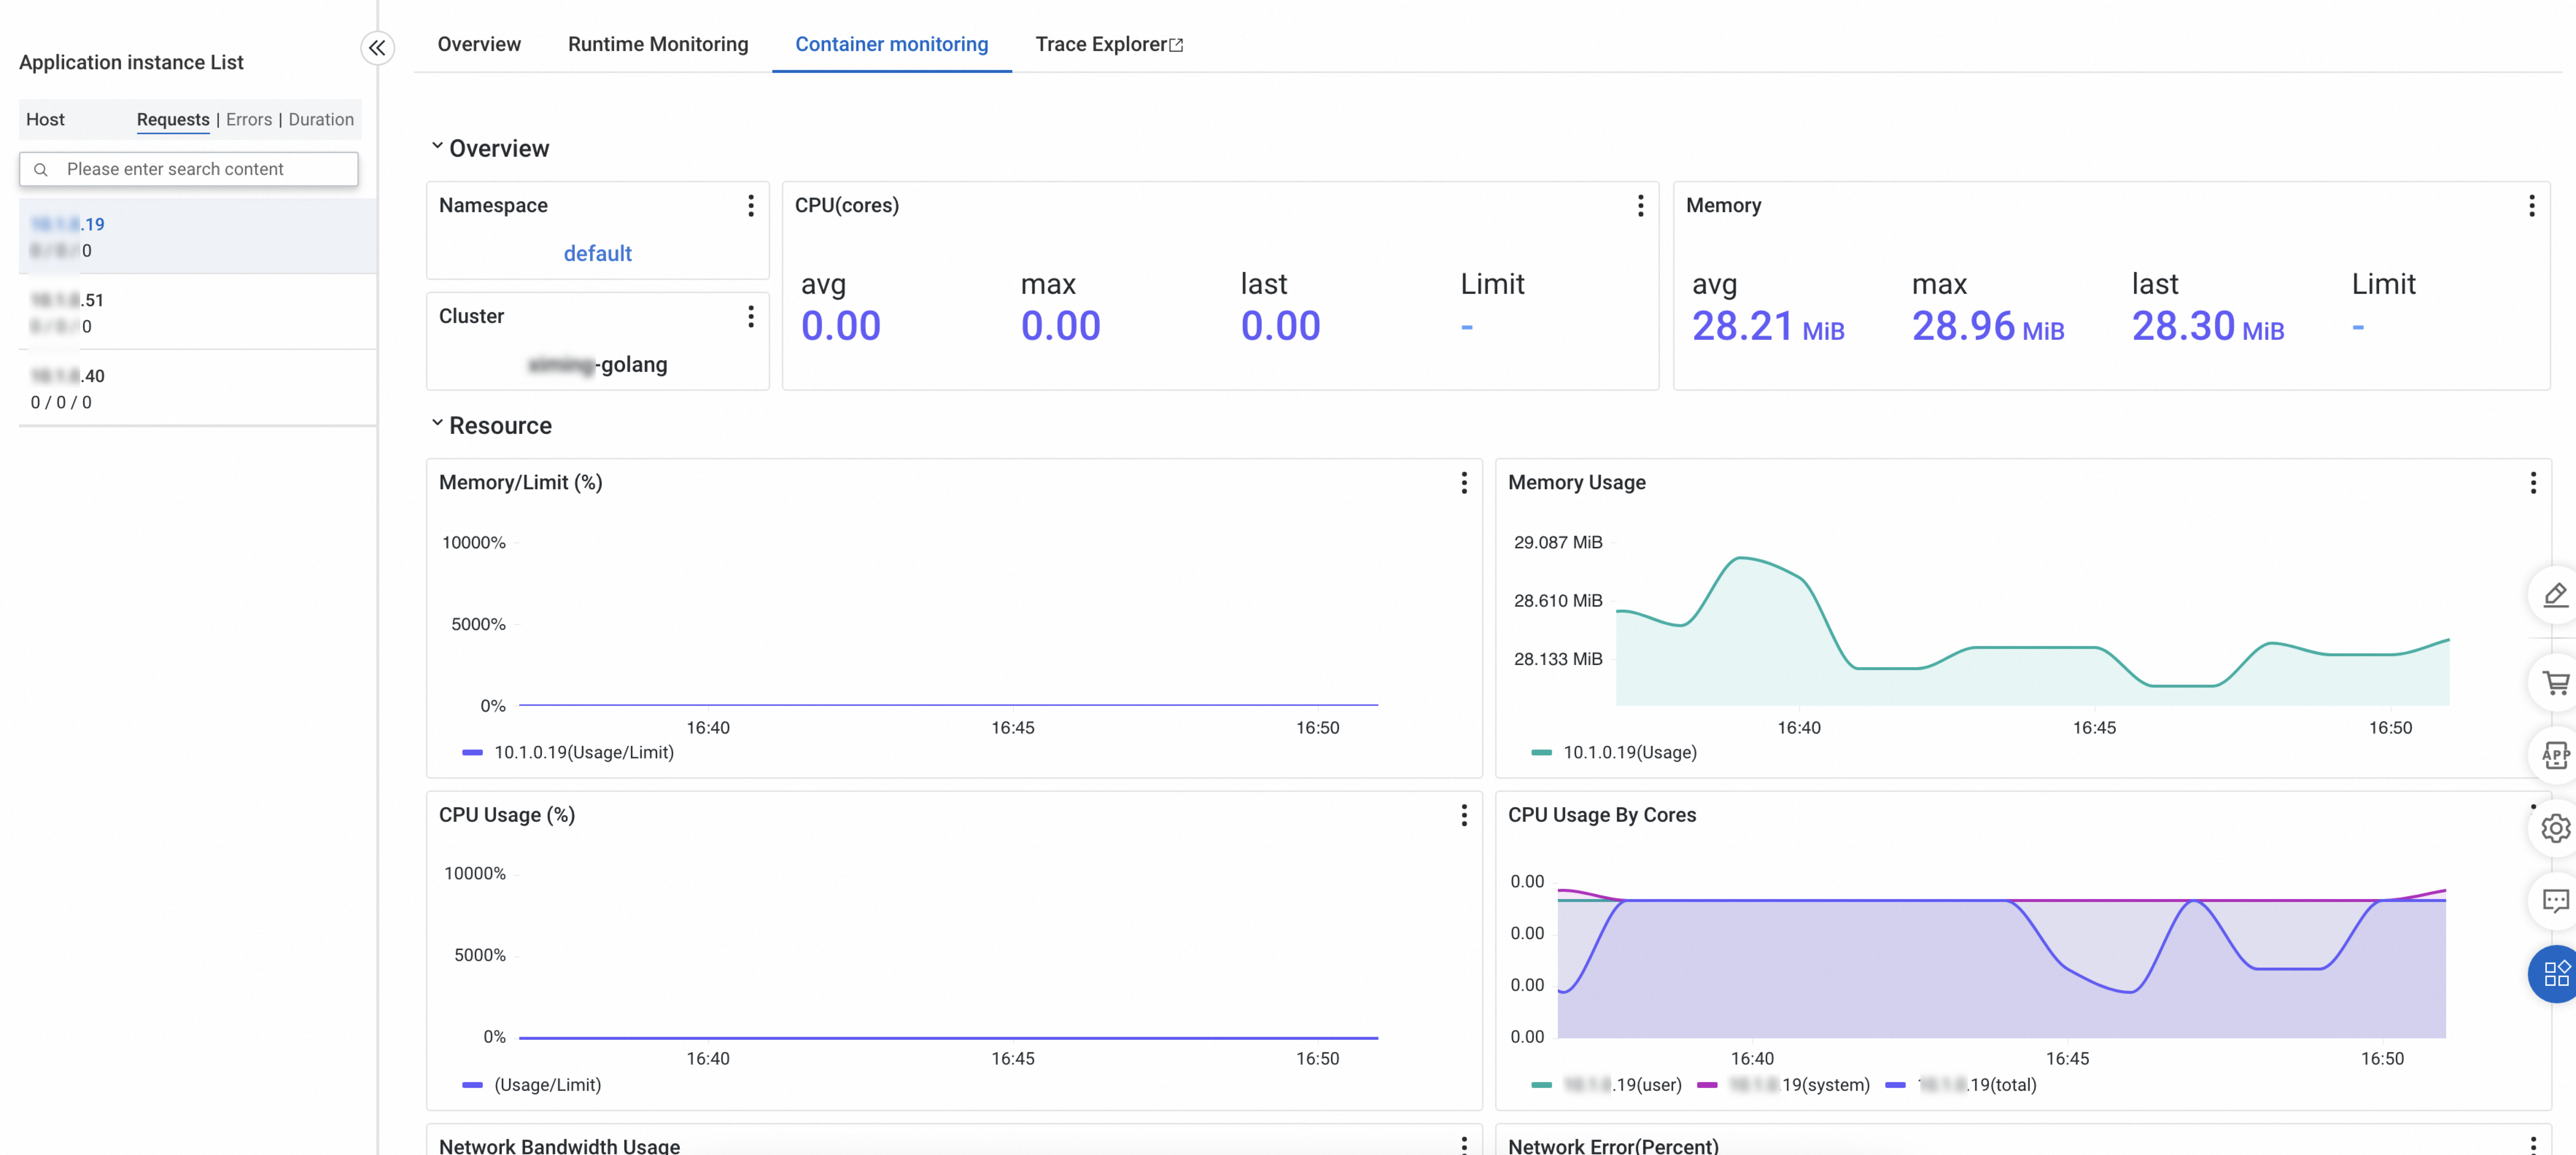
Container monitoring
ACK cluster monitored in Managed Service for Prometheus
For information about how to connect your ACK cluster to Managed Service for Prometheus, see Create a Prometheus instance to monitor an ACK cluster.
On the Container monitoring tab, you can view the metrics about CPU, memory, and disk usage, load, traffic, and packets.
Kubernetes cluster (custom data collection)
On the Container monitoring tab, you can view the time series of CPU, memory, and network traffic.
Trace Explorer
Trace Explorer allows you to combine filter conditions and aggregation dimensions for real-time analysis based on the stored full trace data. This can meet the custom diagnostics requirements in various scenarios. For more information, see Trace Explorer.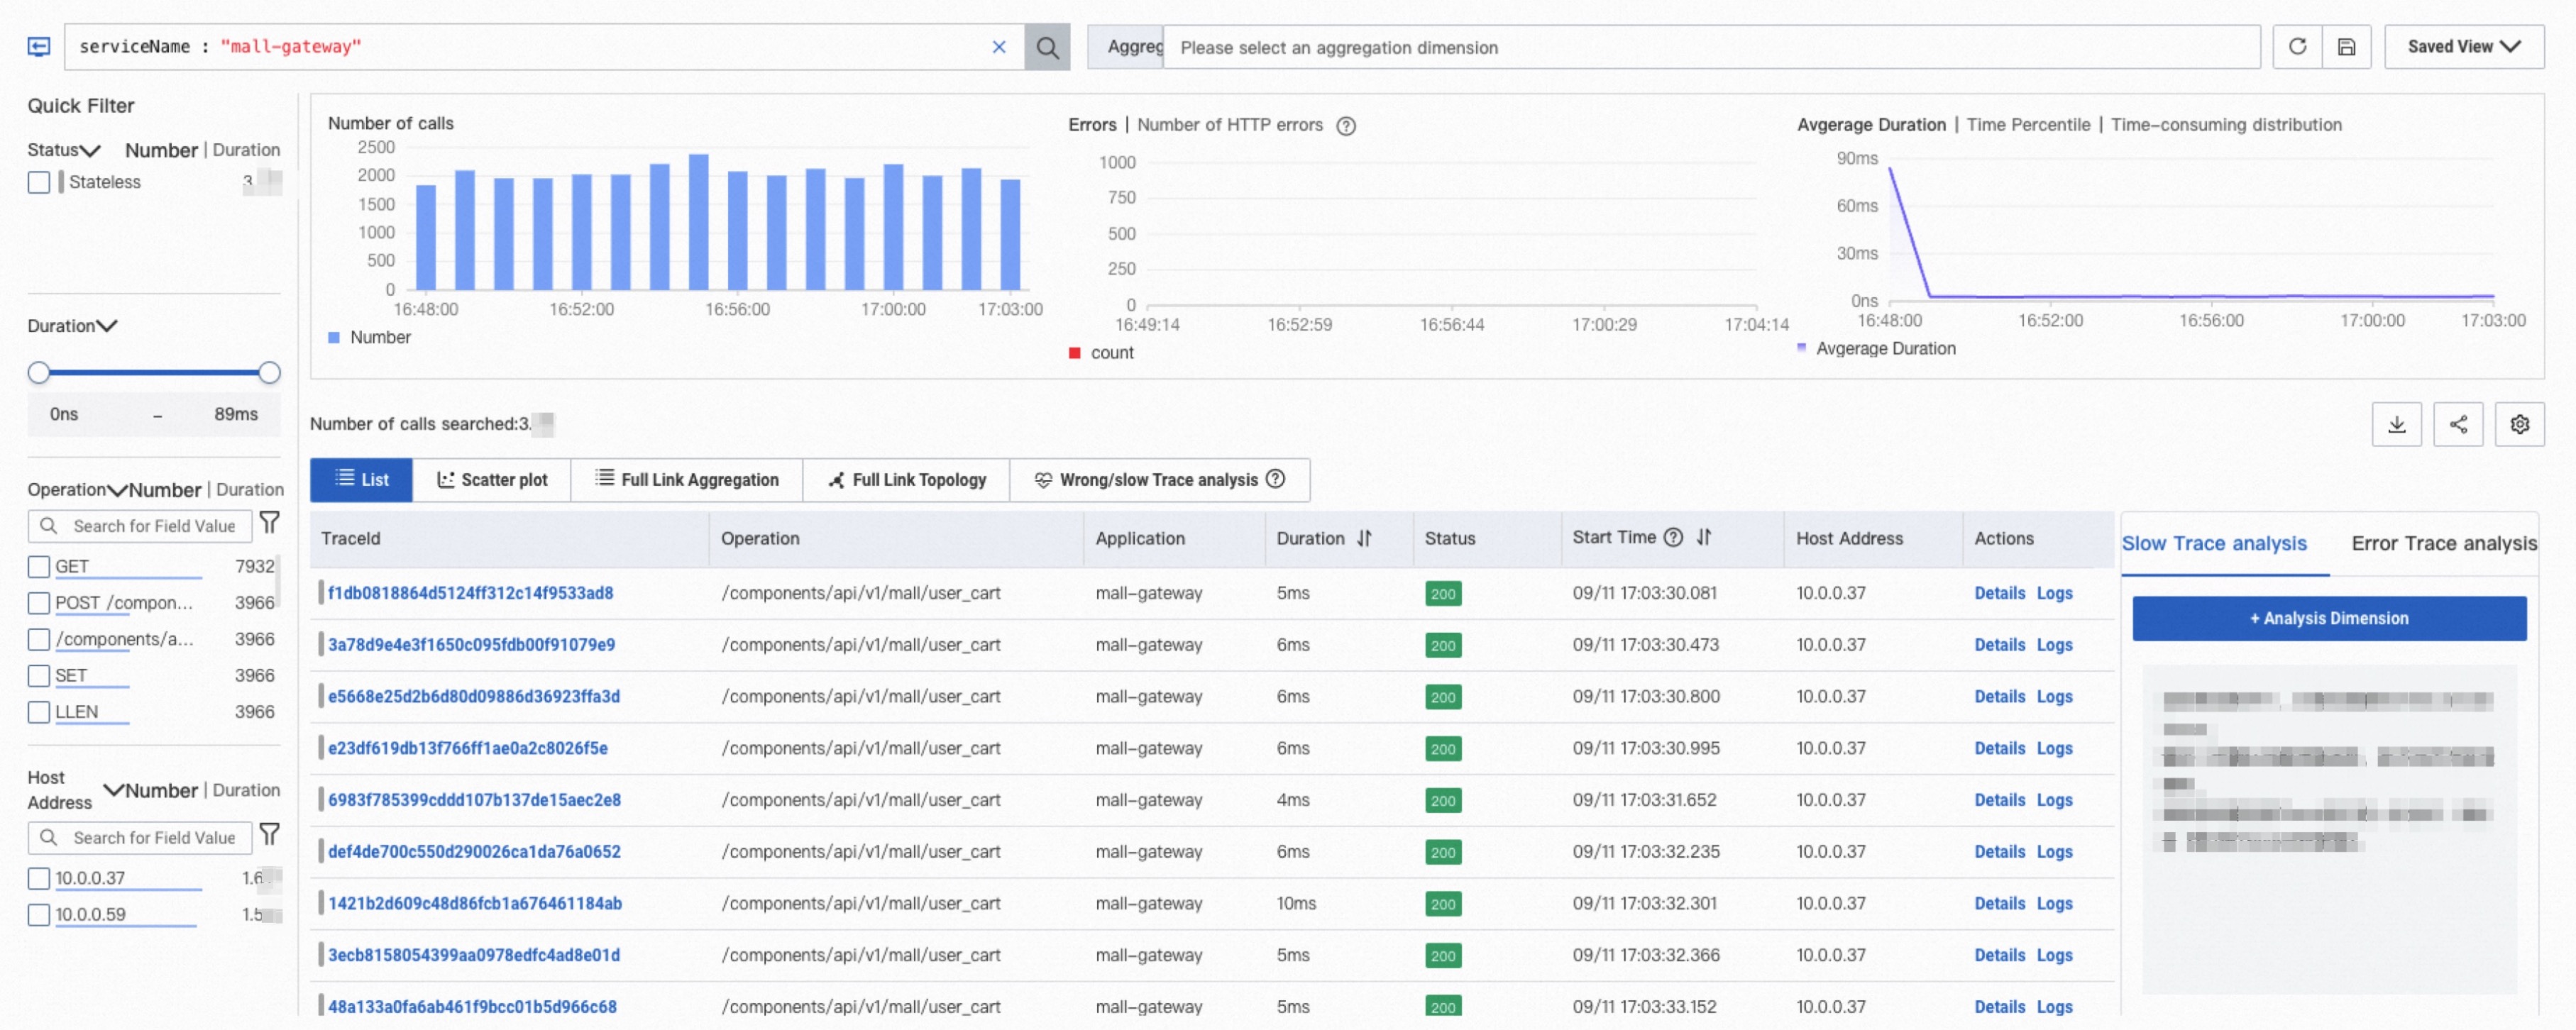
References
For information about Application Monitoring, see Application Monitoring metrics.