Release date
April 2020
New data source features
- Query result caching and management are supported for all data sources.
- The date filter for the Presto data source is optimized.
- Data Lake Analytics is supported in Quick BI Basic.
New dataset features
- Five-level directories are supported in dataset folders.
New BI portal features
BI portal UIs are optimized in the following aspects:
- Four-level menus are supported.
- The theme color can be customized.
New dashboard features
- Funnel charts are updated. The visual style can be specified, and the chart type can be configured. For more information, see Funnel chart.
- The tornado-leaned funnel chart is renamed butterfly chart. The visual style can be specified, and the chart type can be configured. For more information, see Butterfly chart.
- Bubble maps and colored maps are updated in the following aspects:
- The style template, color, and number of intervals can be configured.
- Maps of the following countries are supported: China, Singapore, Germany, Mexico, Japan, and the United States. Maps of a country or area can be displayed.
- Local zoom-in, zoom-out, and drag operations are supported. This allows you to conveniently view data of an area.
- The geographical location names in the chart are updated to the standard national geographical location names of the latest version.
- The Style tab of pie charts is updated.
- The slices are arranged clockwise from the first quadrant in descending order of weights.
- If the number of slices is small, the slice boundaries are displayed.
- Visual Style can be set to Pie or Ring.
- Show label can be set to Dimension, measure, or percentage.
- The Style tab of word clouds is updated.
- The Style Settings section is added. You can configure the word cloud shape and specify whether to display text vertically in this section.
- The Series Settings section is added. You can specify Display Name and Number Formatting for the measure in this section.
- The chart styles and configurations of kanbans, gauges, and progress bars are optimized. Dynamic target values can be configured for gauges and progress bars. For more information, see Kanban, Gauge, and Progress bar.
- Theme settings and filter interaction are supported for more chart types.
- The time configuration dialog box is closed immediately after you select minutes and seconds in a query control.
- Fluctuation analysis is supported for bar charts and line charts in Quick BI Enterprise Standard. This feature analyzes the causes of data fluctuations. For more information, see Metric analysis.
- Dashboards can be unpublished and restored. The publishing states of dashboards are displayed. For more information, see Save, save and publish, restore, unpublish, and republish a dashboard.
- New functions of the query control are added. The UIs are upgraded in the following
aspects:
- Smart selection is supported for associated fields in the same dataset.
- Fields in different datasets can be selected in a query control.
- Time fields in different time granularities can be selected in a query control.
- Query Value Field and Display Name Field are displayed.
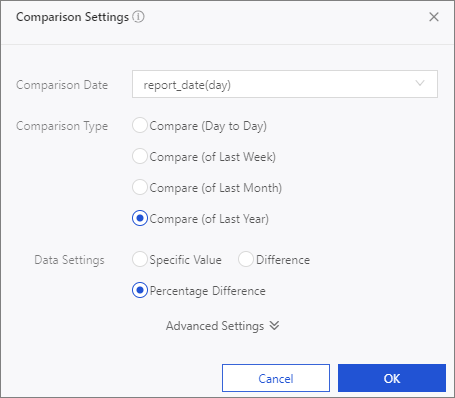
- The comparison feature is optimized. When Data Settings is set to Percentage Difference,
you can specify a calculation formula. If the value of the previous period is less
than 0, the formula takes effect. Otherwise, the default formula is used. For more
information, see Configure a chart.
- The hidden BI performance analysis tool is added to the dashboard preview page.
The performance analysis tool is displayed on the report browsing page if you append
&usePerf=trueto the URL. - In a full-screen dashboard, only eleven types of charts and three widgets that are
commonly used are reserved.
Reserved components (3 widgets and 11 charts) Unpublished components (27 types of charts) Widgets: Text Area, iFrame, Image - 100% stacked area chart and 100% stacked vertical bar chart
- Stacked area chart, stacked horizontal bar chart, stacked vertical bar chart, circular bar, and waterfall chart
- Combination chart
- LBS bubble map, LBS heat map, and LBS flying line map
- Trend indicator
- Gauge, progress bar, and liquid fill
- Scatter chart, bubble chart, and facet scatter chart
- Funnel chart and butterfly chart
- Radar chart and polar diagram
- Treemap and hierarchy chart
- Word cloud
- Sankey diagram and flow analysis chart
Charts: - Line chart and area chart
- Vertical bar chart and horizontal bar chart
- Pie chart
- Cross table
- Colored map and bubble map
- Kanban and ticker board
- Ranking board
Note You cannot create a chart of the unpublished type or switch the current chart to the unpublished chart type. The inventory charts of the removed types are displayed properly. However, their chart types cannot be changed.The standard dashboards are not affected.

New mobile device features
- The display of query control on mobile devices is optimized.
New workbook features
- Workbooks can be unpublished and restored. The publishing states of workbooks are displayed. For more information, see Save, save and publish, restore, unpublish, and republish a workbook.
Other new features
- API Statistics Overview is added to the Open Service feature in Quick BI Enterprise Standard. This allows you to view details about API operations called. For more information, see API statistics overview.